
This article is based on publicly available IR materials and is not a recommendation to buy or sell any specific securities.
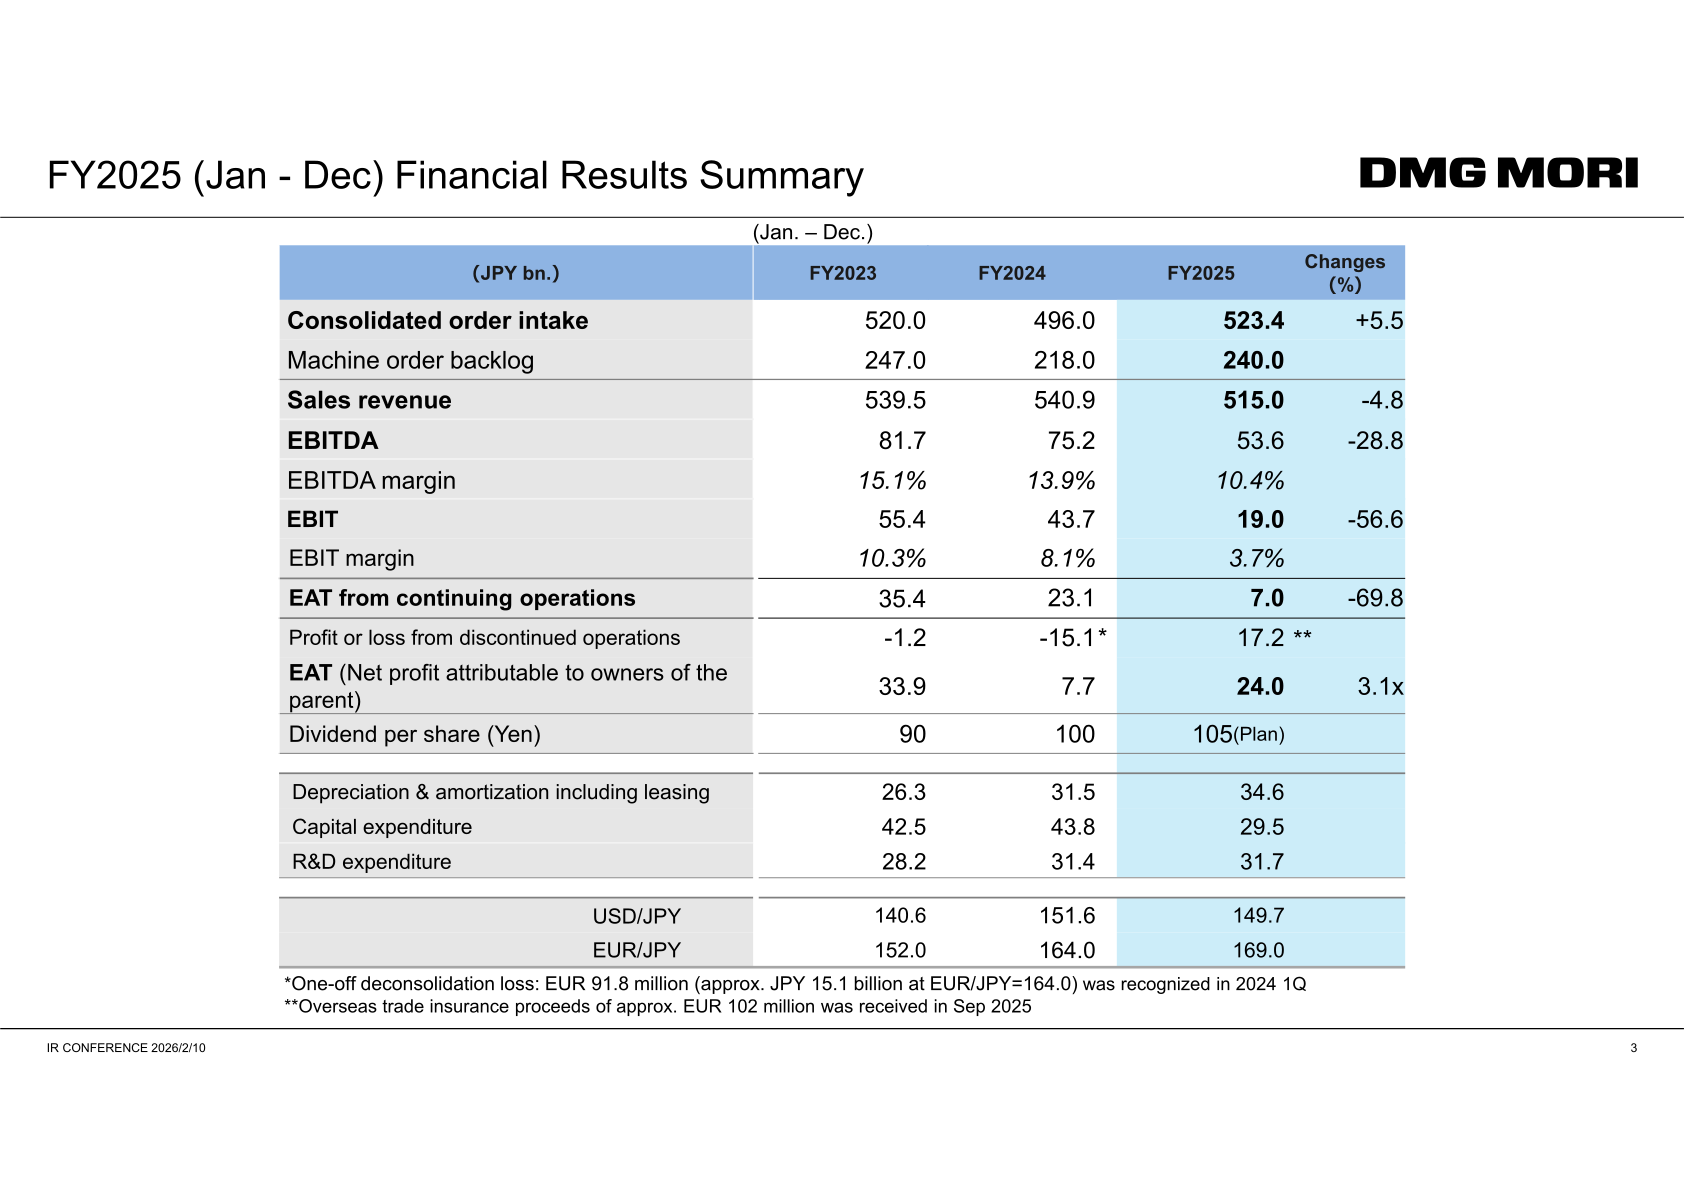
DMG MORI CO., LTD. (6141) presented its “FY2025 (Jan-Dec) Results IR Announcement” dated February 10, 2026. The company’s fiscal year runs from January to December, so FY2025 covers January–December 2025. Consolidated orders for the year rose 6% year on year to JPY 523.4 billion, and the machine order backlog at the end of December 2025 stood at JPY 240.0 billion (end of December 2024: JPY 218.0 billion). Sales revenue declined to JPY 515.0 billion from JPY 540.9 billion, EBITDA fell to JPY 53.6 billion (margin 10.4%) and EBIT to JPY 19.0 billion (margin 3.7%), while EAT (net profit attributable to owners of the parent) rose to JPY 24.0 billion from JPY 7.7 billion, helped by overseas trade insurance proceeds of JPY 17.2 billion recorded under discontinued operations. The planned dividend per share is JPY 105 (FY2024: JPY 100).
Consolidated Results (FY2025 Jan–Dec Actual)
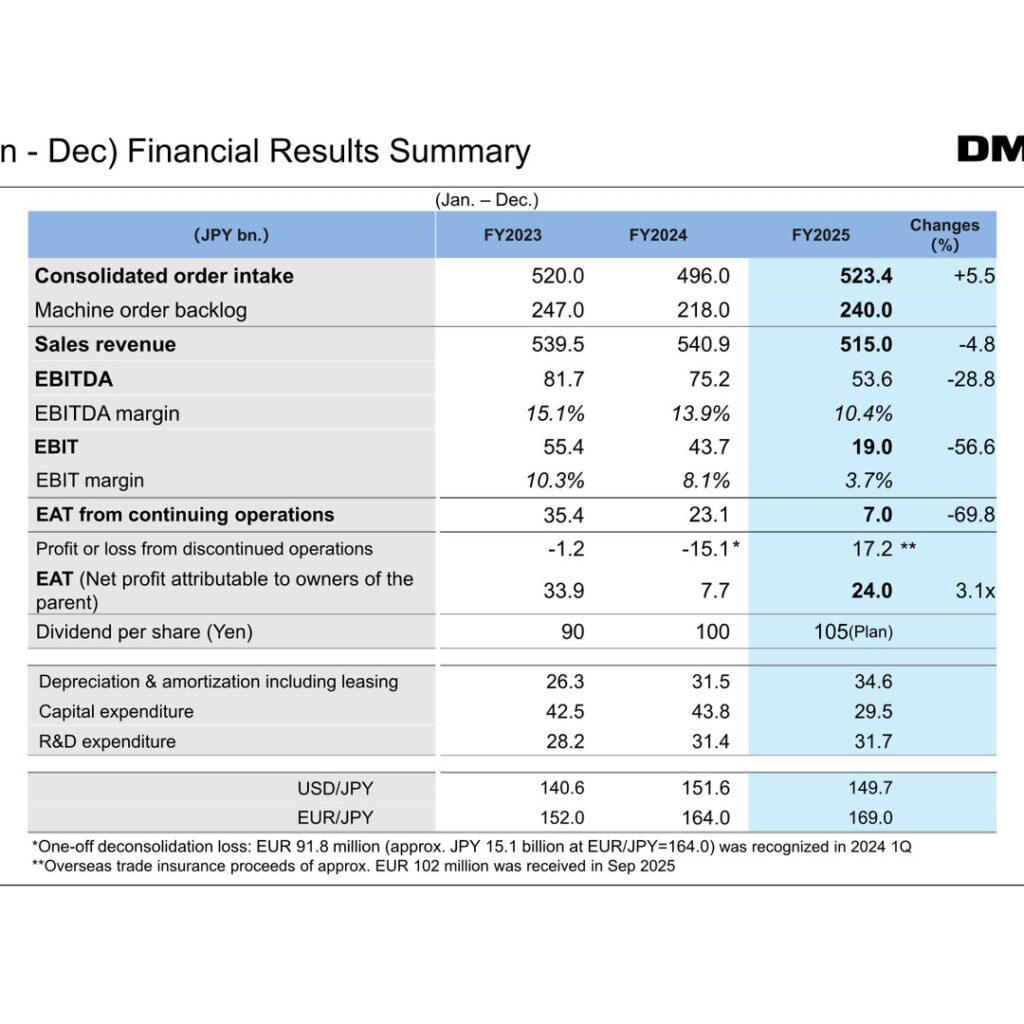
Consolidated order intake was JPY 523.4 billion (+5.5% vs. JPY 496.0 billion in FY2024), and the machine order backlog rose to JPY 240.0 billion from JPY 218.0 billion. Sales revenue was JPY 515.0 billion (-4.8%), EBITDA JPY 53.6 billion (-28.8%; EBITDA margin 10.4% vs. 13.9%), and EBIT JPY 19.0 billion (-56.6%; EBIT margin 3.7% vs. 8.1%). EAT from continuing operations was JPY 7.0 billion (-69.8%). Profit or loss from discontinued operations was +JPY 17.2 billion, reflecting overseas trade insurance proceeds of approx. EUR 102 million received in September 2025, compared with -JPY 15.1 billion in FY2024, when a one-off deconsolidation loss of EUR 91.8 million (approx. JPY 15.1 billion at EUR/JPY=164.0) was recognized in 1Q 2024. As a result, EAT (net profit attributable to owners of the parent) was JPY 24.0 billion, 3.1x the FY2024 figure of JPY 7.7 billion. Average exchange rates were USD/JPY 149.7 (FY2024: 151.6) and EUR/JPY 169.0 (FY2024: 164.0).
| Item (JPY bn.) | FY2025 | FY2024 | Changes (%) |
|---|---|---|---|
| Consolidated order intake | 523.4 | 496.0 | +5.5 |
| Machine order backlog | 240.0 | 218.0 | — |
| Sales revenue | 515.0 | 540.9 | -4.8 |
| EBITDA | 53.6 | 75.2 | -28.8 |
| EBITDA margin | 10.4% | 13.9% | — |
| EBIT | 19.0 | 43.7 | -56.6 |
| EBIT margin | 3.7% | 8.1% | — |
| EAT from continuing operations | 7.0 | 23.1 | -69.8 |
| Profit or loss from discontinued operations | 17.2 | -15.1 | — |
| EAT (Net profit attributable to owners of the parent) | 24.0 | 7.7 | 3.1x |
| Dividend per share (Yen) | 105 (Plan) | 100 | — |
| Depreciation & amortization including leasing | 34.6 | 31.5 | — |
| Capital expenditure | 29.5 | 43.8 | — |
| R&D expenditure | 31.7 | 31.4 | — |
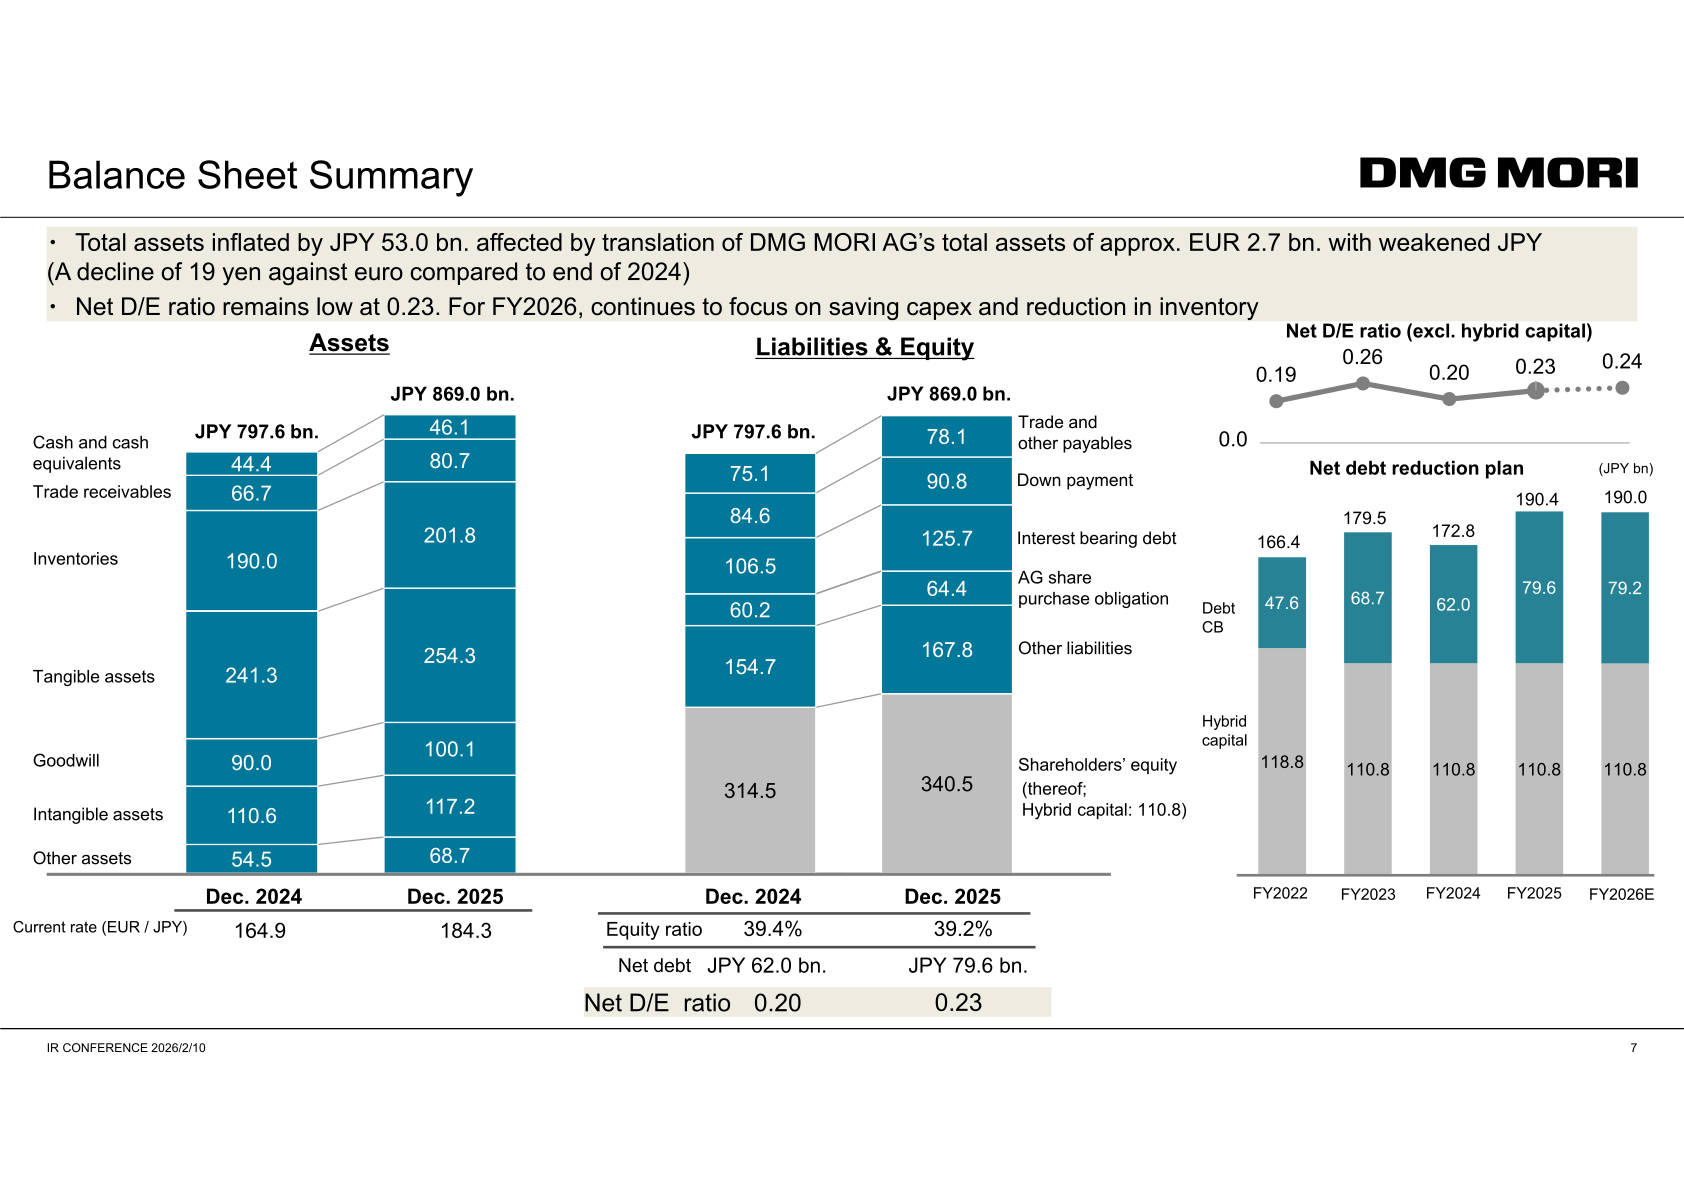
According to the EBIT bridge from FY2024 to FY2025, positive factors totaled +JPY 9.0 billion (gross profit improvement and SG&A cost reductions) and negative factors totaled -JPY 33.7 billion (decrease in sales revenue, depreciation etc., increase in MRO engineers and salary revision, exchange loss, new CNC transition costs, and disposal of excess parts ordered during COVID). On a quarterly basis, the company notes that sales recovered in 4Q (Oct–Dec) to make up for low performance in 1Q to 3Q, and that EBIT bottomed out in 1Q and has since recovered. Operating free cash flow for FY2025 was a surplus of JPY 14.8 billion (operating cash flow JPY 26.2 billion, investment cash flow -JPY 9.8 billion). The net D/E ratio remains low at 0.23 (0.20 at the end of December 2024), net debt was JPY 79.6 bn. (JPY 62.0 bn.), and the equity ratio was 39.2% (39.4%) at the end of December 2025.
Orders and Sales Breakdown
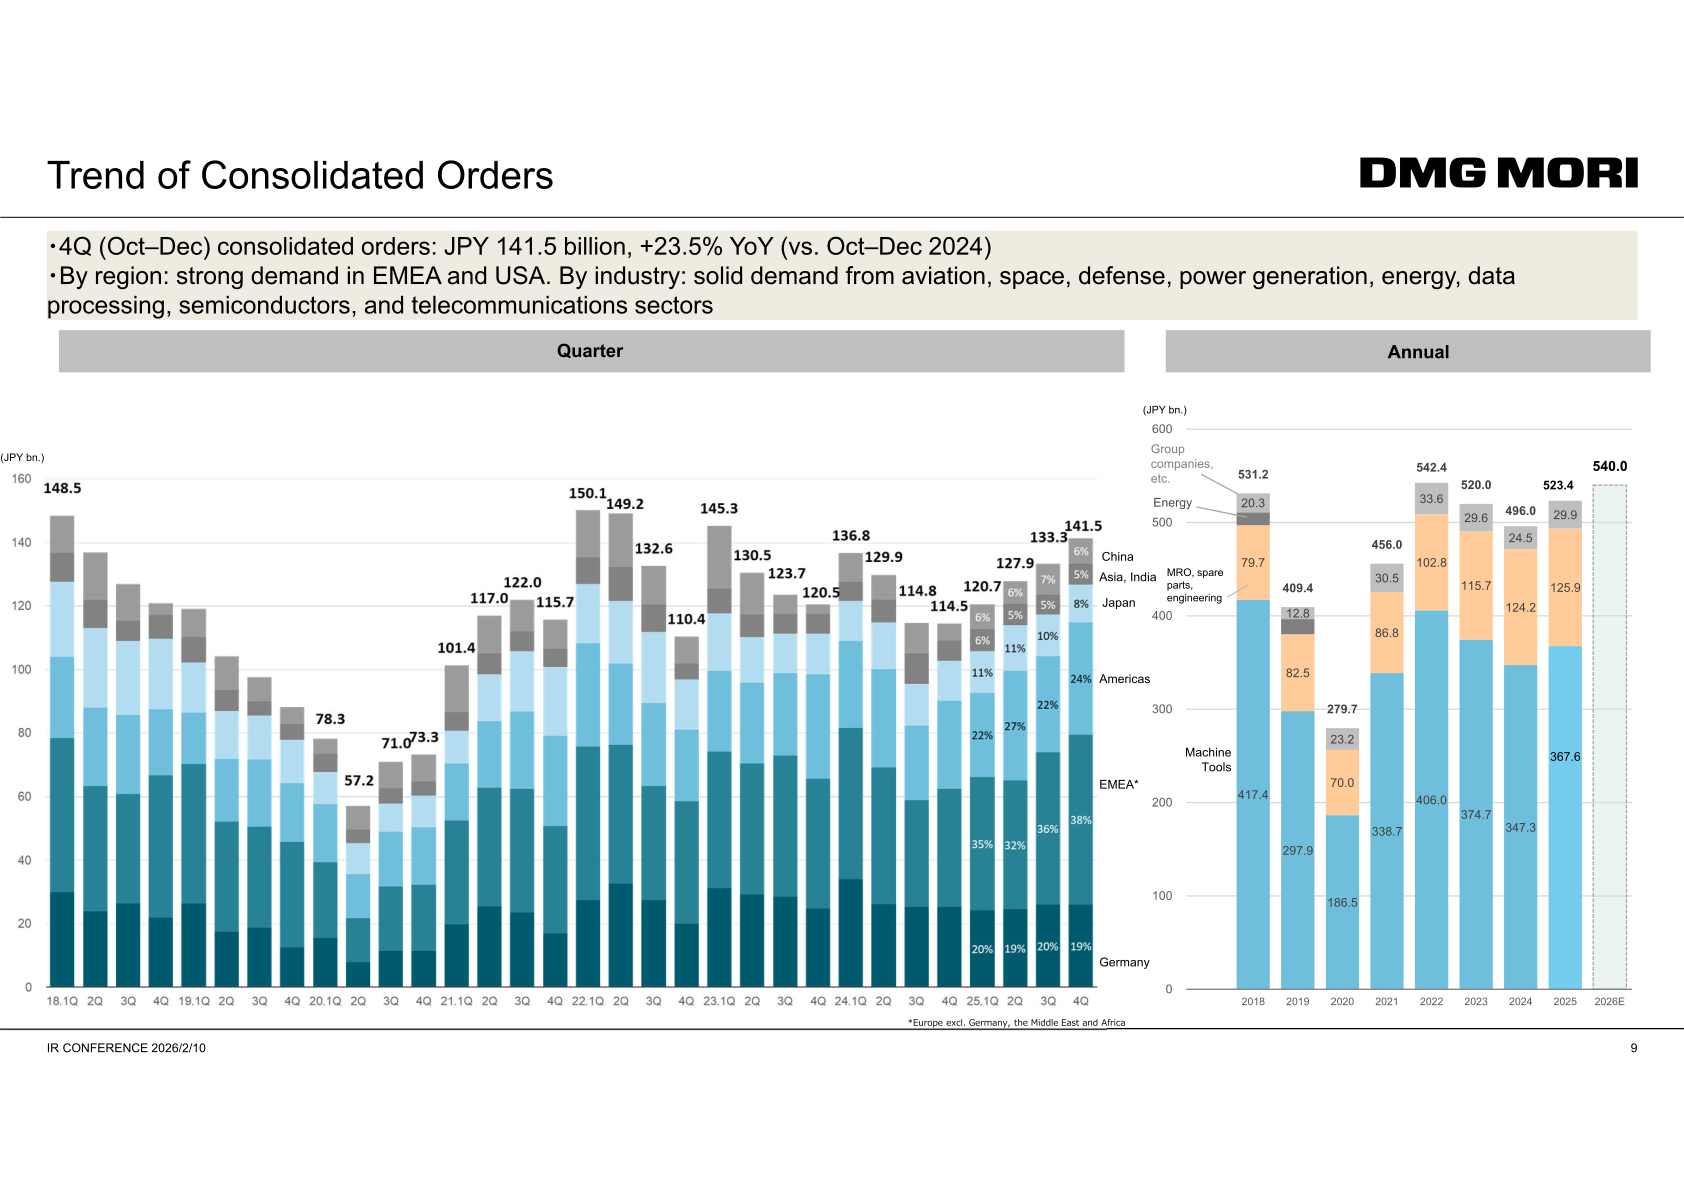
DMG MORI does not report segment results in this presentation; instead it breaks down consolidated orders by category and region. Annual orders of JPY 523.4 billion in 2025 comprised machine tools JPY 367.6 billion, MRO (maintenance, repair & overhaul), spare parts and engineering JPY 125.9 billion, and group companies, energy, etc. JPY 29.9 billion (2024: JPY 347.3 billion, JPY 124.2 billion and JPY 24.5 billion, respectively; total JPY 496.0 billion). MRO, spare parts and engineering orders were flat year on year and accounted for 24% of consolidated orders. The average machine order price rose to JPY 79.6 million (FY2024: JPY 71.0 million, +12%), or EUR 471 thousand (FY2024: EUR 433 thousand, +9%), driven by higher orders of MX machines and large-sized machines and lower discount rates. 4Q (Oct–Dec) consolidated orders were JPY 141.5 billion, +23.5% year on year and +6% quarter on quarter, with strong demand in EMEA and the USA and solid demand from the aviation, space, defense, power generation, energy, data processing, semiconductor and telecommunications sectors. In 4Q 2025 the regional mix of orders was Germany 19%, EMEA (Europe excl. Germany, the Middle East and Africa) 38%, Americas 24%, Japan 8%, Asia/India 5% and China 6%.
| Consolidated orders by category (JPY bn.) | 2025 | 2024 |
|---|---|---|
| Machine tools | 367.6 | 347.3 |
| MRO, spare parts, engineering | 125.9 | 124.2 |
| Group companies, etc. / Energy | 29.9 | 24.5 |
| Total consolidated orders | 523.4 | 496.0 |
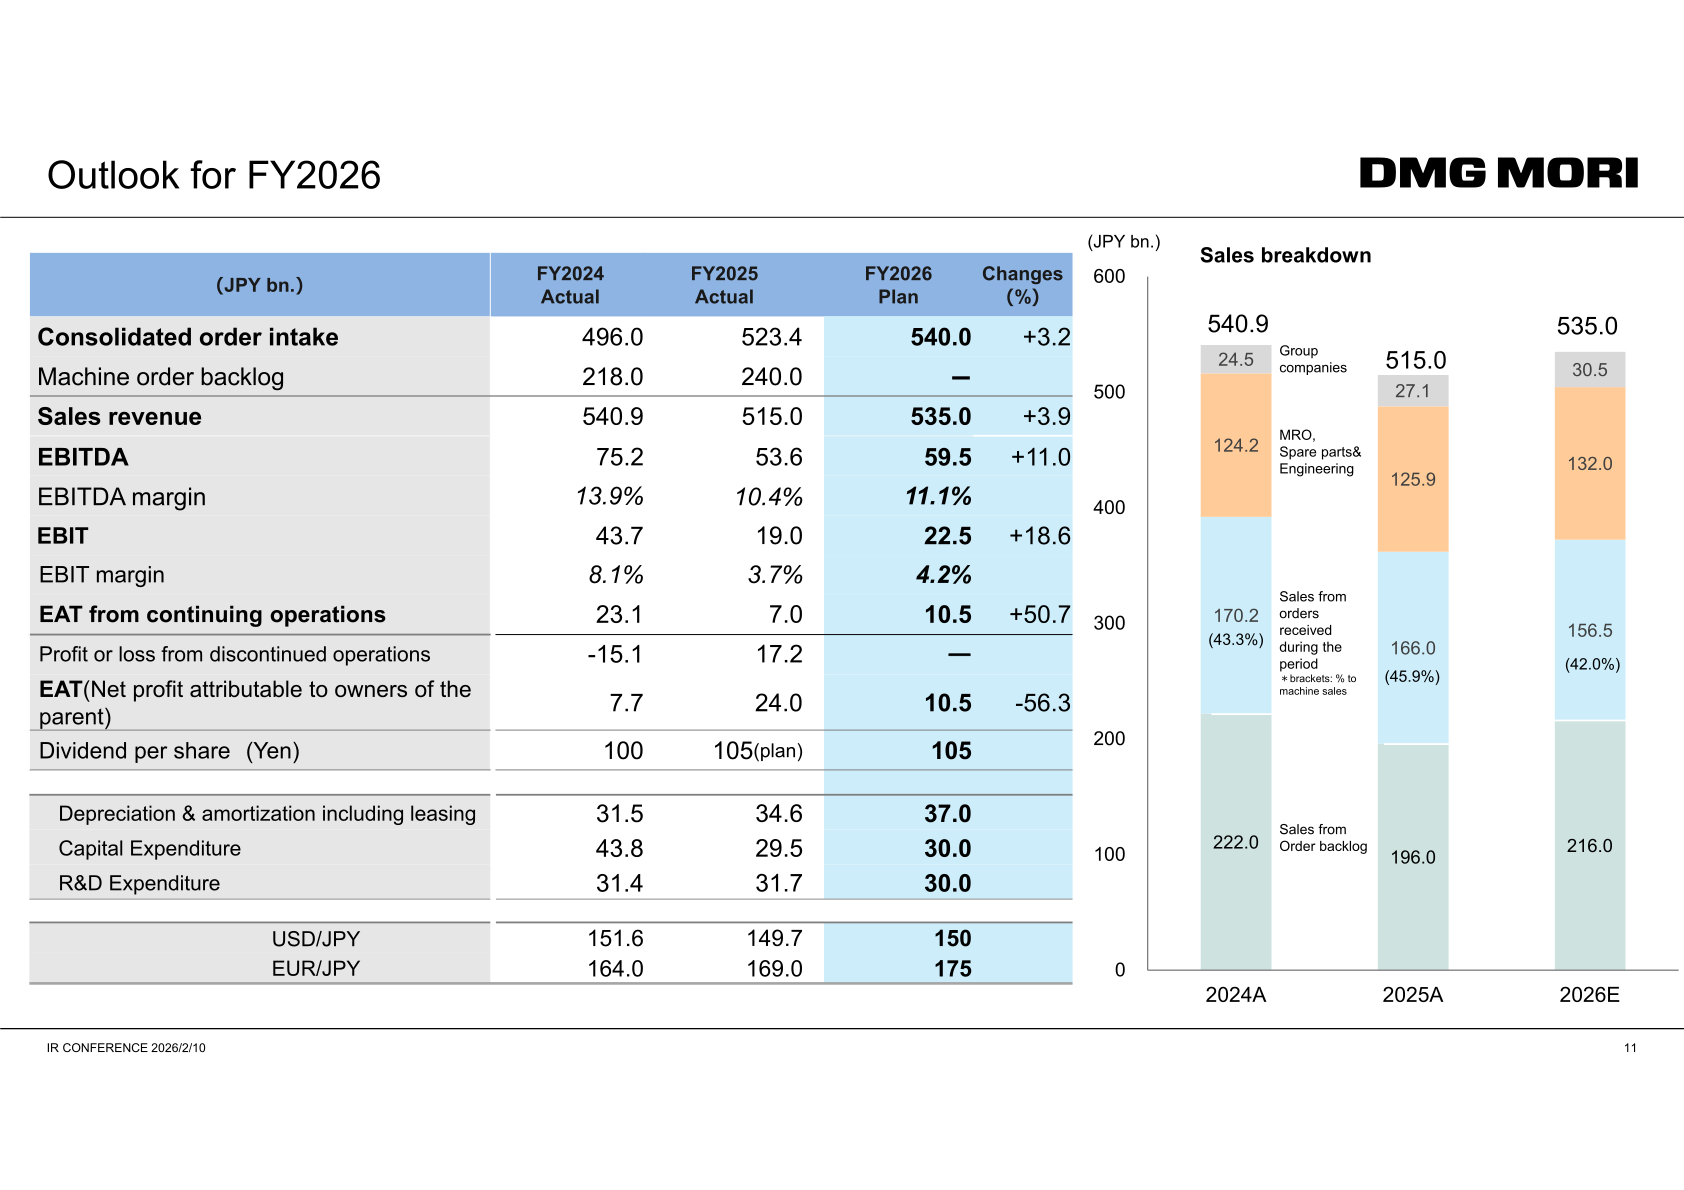
Sales revenue of JPY 515.0 billion in 2025 consisted of sales from order backlog JPY 196.0 billion, sales from orders received during the period JPY 166.0 billion (45.9% of machine sales), MRO, spare parts & engineering JPY 125.9 billion, and group companies JPY 27.1 billion (2024: JPY 222.0 billion, JPY 170.2 billion (43.3%), JPY 124.2 billion and JPY 24.5 billion, respectively).
FY2026 Forecast
For FY2026 (Jan–Dec), the company plans consolidated order intake of JPY 540.0 billion (+3.2%), sales revenue of JPY 535.0 billion (+3.9%), EBITDA of JPY 59.5 billion (+11.0%; EBITDA margin 11.1%), EBIT of JPY 22.5 billion (+18.6%; EBIT margin 4.2%), and EAT of JPY 10.5 billion (-56.3%; EAT margin 2.0%), with EAT from continuing operations of JPY 10.5 billion (+50.7%). The plan assumes USD/JPY 150 and EUR/JPY 175. Depreciation & amortization including leasing is planned at JPY 37.0 billion, capital expenditure at JPY 30.0 billion, and R&D expenditure at JPY 30.0 billion. Planned sales breakdown: sales from order backlog JPY 216.0 billion, sales from orders received during the period JPY 156.5 billion (42.0%), MRO, spare parts & engineering JPY 132.0 billion, and group companies JPY 30.5 billion. Operating free cash flow for FY2026 is forecast at a surplus of JPY 15.0 billion, driven by higher advance payments from recovering orders and inventory reductions.
| Item (JPY bn.) | FY2026 Plan | FY2025 Actual | Changes (%) |
|---|---|---|---|
| Consolidated order intake | 540.0 | 523.4 | +3.2 |
| Sales revenue | 535.0 | 515.0 | +3.9 |
| EBITDA | 59.5 | 53.6 | +11.0 |
| EBITDA margin | 11.1% | 10.4% | — |
| EBIT | 22.5 | 19.0 | +18.6 |
| EBIT margin | 4.2% | 3.7% | — |
| EAT from continuing operations | 10.5 | 7.0 | +50.7 |
| EAT (Net profit attributable to owners of the parent) | 10.5 | 24.0 | -56.3 |
| Dividend per share (Yen) | 105 | 105 (plan) | — |
| USD/JPY | 150 | 149.7 | — |
| EUR/JPY | 175 | 169.0 | — |
Focus activities for 2026/2027 are grouped into sales revenue growth (penetration of growing fields such as defense, data-related, medical and energy; further enhancement of MX — 5-axis machines, mill-turn centers, automation, full-turnkey and AI products; lifecycle DMQP driving sales through my DMG MORI; increase in engineering revenue; deployment of BX machines (basic machines)), cost management (productivity improvement through generative AI, efficiency improvement in indirect operations, MRO/AI agents, QCD optimization), and finance (reduction of inventory and increased collection of down payments to improve net working capital; introduction of processes to optimize cash, inventory and HR globally).
Shareholder Returns
The planned dividend per share for FY2025 is JPY 105, up from JPY 100 in FY2024 and JPY 90 in FY2023. For FY2026, the company plans a dividend per share of JPY 105. No share buyback is mentioned in the presentation.
| Item | FY2026 Plan | FY2025 | FY2024 | FY2023 |
|---|---|---|---|---|
| Dividend per share (Yen) | 105 | 105 (Plan) | 100 | 90 |
Balance Sheet and Topics
Total assets at the end of December 2025 were JPY 869.0 billion (end of December 2024: JPY 797.6 billion), inflated by JPY 53.0 billion due to the translation of DMG MORI AG’s total assets of approx. EUR 2.7 billion with a weaker yen (a decline of 19 yen against the euro compared with the end of 2024). The net D/E ratio (excl. hybrid capital) was 0.23 (0.20 at the end of 2024; hybrid capital of JPY 110.8 billion is included in shareholders’ equity of JPY 340.5 billion), and for FY2026 the company continues to focus on saving capex and reducing inventory. Other topics covered include the Open House Pfronten 2026 (January 26 – February 6, 2026) with three world premiere machine models (CTX 450 4A, DMU 65 H monoBLOCK 2nd Generation, LASERTEC 65 DED hybrid 2nd Generation), the Mobile Module network service to be standard on all CELOS X machines by 2027, the grand opening of a new 4,500 m² training center in Pfronten with capacity for 150 trainees, a CDP2025 A-List ranking for climate action for the second year and a first “A” rating for water risk management, and the Partner Award 2026 to six suppliers. At the Annual General Meeting of Shareholders on March 27, 2026, the board is to comprise 12 directors with the ratio of external directors rising from 42% to 50% (6/12), female directors 25% (3/12) and non-Japanese directors 17% (2/12).
This article is an analysis based on publicly available information and is not a recommendation to buy or sell any specific securities. Investment decisions are your own responsibility.
![[Obayashi] Investors’ Guide 2026 — The Complete 24-Article Breakdown](https://japan-equity.com/wp-content/uploads/2026/07/hub_cover-1024x1024.png)
![[Obayashi] IR & SR Policy — Feeding Dialogue Back into Management](https://japan-equity.com/wp-content/uploads/2026/07/p32_sq-1024x1024.jpg)
![[Obayashi] Real Estate Development — 18.7% Margin, ¥287.7bn Unrealized Gains](https://japan-equity.com/wp-content/uploads/2026/07/p20_sq-1024x1024.jpg)
![[Obayashi] Domestic Civil Engineering — Resilience Spending Supports 9.6% Margin](https://japan-equity.com/wp-content/uploads/2026/07/p11_sq-1024x1024.jpg)
![[Obayashi] Share Price & External Ratings — vs TOPIX, ESG Index Inclusion](https://japan-equity.com/wp-content/uploads/2026/07/p40_sq-1024x1024.jpg)
![[Construction] ¥75.5tn Investment, Shrinking Workforce — Big-5 Market Share](https://japan-equity.com/wp-content/uploads/2026/07/p12_sq-1024x1024.jpg)



![[Obayashi] Capital Policy & Shareholder Returns — ROE 10%+, DOE ~5%, ¥100bn Buyback](https://japan-equity.com/wp-content/uploads/2026/07/p27_sq-1024x1024.jpg)
![[Obayashi] Reducing Cross-Shareholdings — ¥285.2bn Sold in Five Years](https://japan-equity.com/wp-content/uploads/2026/07/p29_sq-1024x1024.jpg)
![[Obayashi] ¥750bn Investment Plan — ¥300bn to Development, ¥190bn to Tech/DX](https://japan-equity.com/wp-content/uploads/2026/07/p30_sq-1024x1024.jpg)
![[Obayashi] MTP2022 KPIs — Operating Profit ~2x Target, ROE 14.4%](https://japan-equity.com/wp-content/uploads/2026/07/p25_sq-1024x1024.jpg)
![[Obayashi] Cash Allocation — ¥420bn Investment CF Over Five Years](https://japan-equity.com/wp-content/uploads/2026/07/p26_sq-1024x1024.jpg)
![[Obayashi] Green Energy — 44 Plants, 344MW, and the Green Hydrogen Challenge](https://japan-equity.com/wp-content/uploads/2026/07/p21_sq-1024x1024.jpg)
![[Obayashi] Tackling the Labor Shortage — Robotics Construction®](https://japan-equity.com/wp-content/uploads/2026/07/p14_sq-1024x1024.jpg)
