
This article is based on publicly available IR materials and is not a recommendation to buy or sell any specific securities.
AMADA CO., LTD. reported record-high sales revenue and order intake for FY2025 (the twelve months ended March 31, 2026), but operating profit declined year on year and fell short of the company’s forecast. Sales revenue rose 10.3% to 437.3 billion yen (+9.3% in real terms), supported by U.S. data center capital expenditure and contributions from the acquired H&F and Via Mechanics businesses. Operating profit fell 8.7% to 44.7 billion yen (-10.2% in real terms) and net income attributable to owners of parent declined 5.7% to 30.5 billion yen, impacted by lower capacity utilization, U.S. tariffs, rising personnel costs, and higher-than-expected amortization of intangible assets. Orders reached an all-time high of 456.9 billion yen, up 22.6% (+21.7% in real terms). For FY2026 the company forecasts revenue of 460.0 billion yen and operating profit of 48.0 billion yen, and it unveiled its Medium-term Business Plan 2030 alongside the results.
Consolidated Results (Full-Year Actual)
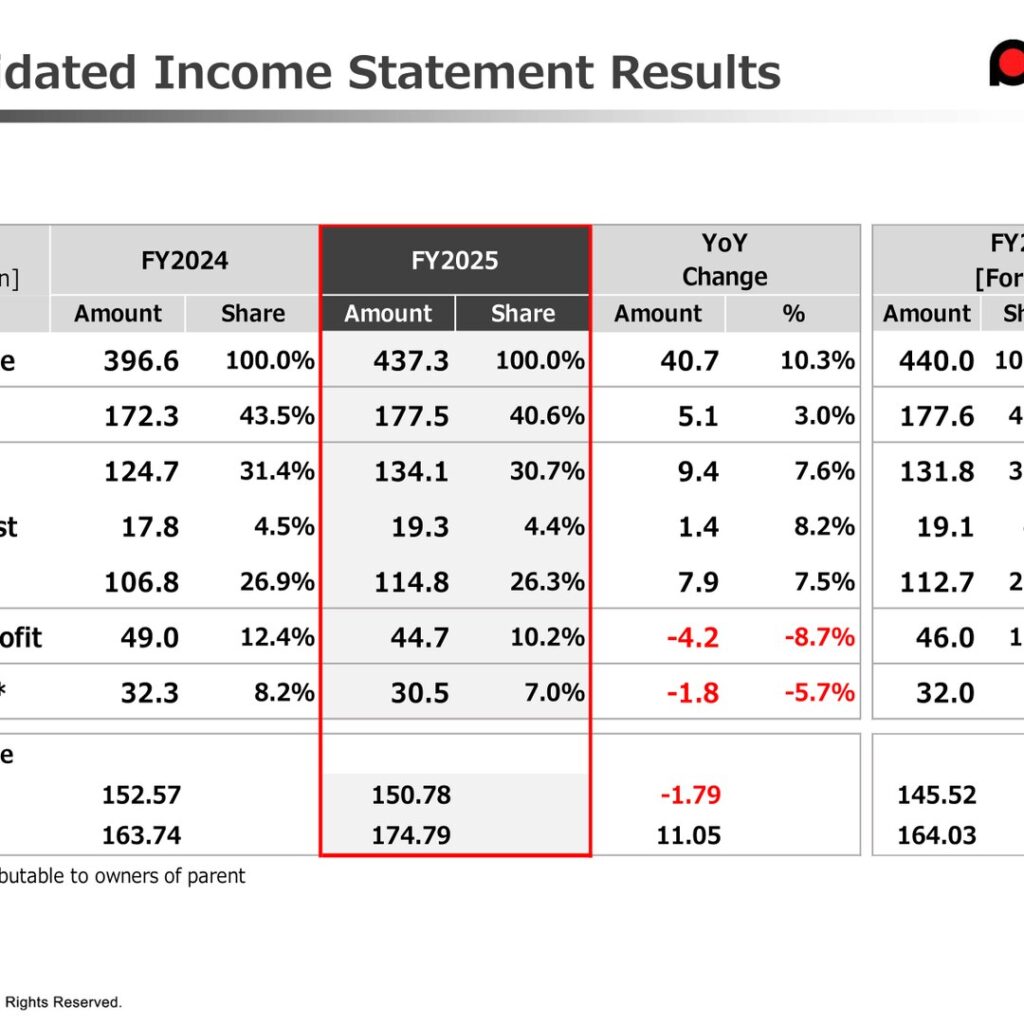
Sales revenue of 437.3 billion yen was 40.7 billion yen (10.3%) higher than FY2024 and reached 99.4% of the 440.0 billion yen forecast. Gross profit increased 3.0% to 177.5 billion yen, but the gross margin narrowed from 43.5% to 40.6%. SG&A rose 7.6% to 134.1 billion yen (fixed cost 114.8 billion yen, variable cost 19.3 billion yen). Operating profit of 44.7 billion yen (operating margin 10.2%, down from 12.4%) was 97.4% of the 46.0 billion yen forecast, and net income of 30.5 billion yen was 95.5% of the 32.0 billion yen forecast. The company notes that the operating profit decline of 4.2 billion yen reflected a 2.6 billion yen negative impact from changes in the COGS percentage (decreased factory utilization and U.S. tariffs outweighing improvements in selling prices and material cost) and a 1.1 billion yen negative impact from SG&A expenses, including a 2.0 billion yen increase in depreciation expenses and a 0.7 billion yen increase in personnel expenses. Average exchange rates were 150.78 yen to the U.S. dollar and 174.79 yen to the euro. Record-high revenue was achieved in all regions except Europe, and all overseas regions marked record-high order intake.
| Item (billions of yen) | FY2024 | FY2025 | YoY Change | YoY % | FY2025 Forecast | Achievement |
|---|---|---|---|---|---|---|
| Sales revenue | 396.6 | 437.3 | 40.7 | 10.3% | 440.0 | 99.4% |
| Gross profit | 172.3 | 177.5 | 5.1 | 3.0% | 177.6 | 100.0% |
| SG&A | 124.7 | 134.1 | 9.4 | 7.6% | 131.8 | 101.8% |
| Operating profit | 49.0 | 44.7 | -4.2 | -8.7% | 46.0 | 97.4% |
| Operating margin | 12.4% | 10.2% | – | – | 10.5% | – |
| Net income attributable to owners of parent | 32.3 | 30.5 | -1.8 | -5.7% | 32.0 | 95.5% |
| Orders | 372.8 | 456.9 | 84.1 | 22.6% | – | – |
By region, FY2025 sales revenue was 156.0 billion yen in Japan (35.7% of the total), 120.5 billion yen in North America (27.6%), 82.3 billion yen in Europe (18.8%), and 78.3 billion yen in Asia and others (17.9%); overseas sales totaled 281.2 billion yen (64.3%). Year-on-year growth was 8.2% in Japan, 6.2% in North America, 7.4% in Europe, and 41.9% in Asia and others. Orders rose from 139.4 billion yen to 158.0 billion yen in Japan and from 233.4 billion yen to 298.9 billion yen overseas.
Segment Results
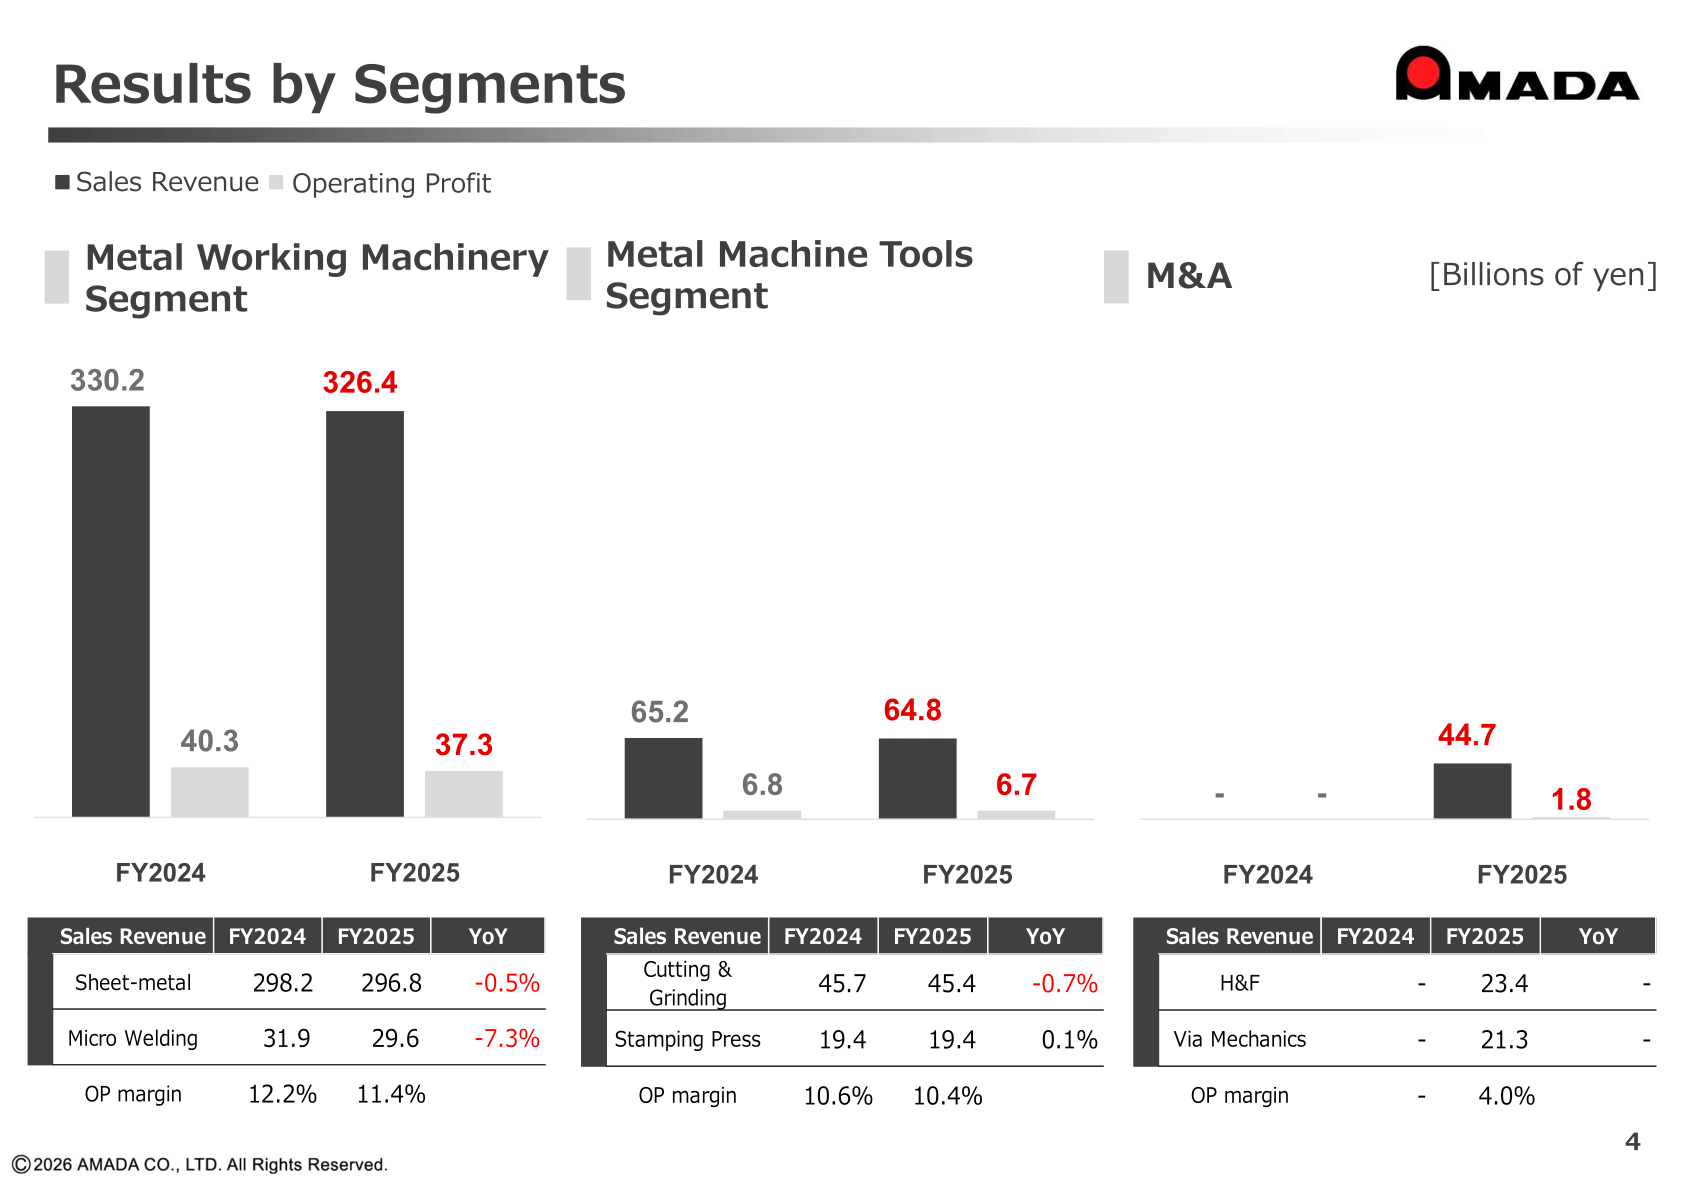
In the Metal Working Machinery segment, sales revenue edged down from 330.2 billion yen to 326.4 billion yen and operating profit declined from 40.3 billion yen to 37.3 billion yen; the operating margin fell from 12.2% to 11.4%. Within the segment, Sheet-metal revenue was 296.8 billion yen (-0.5%) and Micro Welding revenue was 29.6 billion yen (-7.3%). In the Metal Machine Tools segment, sales revenue was 64.8 billion yen versus 65.2 billion yen and operating profit was 6.7 billion yen versus 6.8 billion yen, with the operating margin at 10.4% (FY2024: 10.6%); Cutting & Grinding revenue was 45.4 billion yen (-0.7%) and Stamping Press revenue was 19.4 billion yen (+0.1%). The newly consolidated M&A segment (H&F and Via Mechanics) contributed sales revenue of 44.7 billion yen (H&F 23.4 billion yen, Via Mechanics 21.3 billion yen) and operating profit of 1.8 billion yen, with an operating margin of 4.0%.
| Segment | Metric (billions of yen) | FY2024 | FY2025 |
|---|---|---|---|
| Metal Working Machinery | Sales revenue | 330.2 | 326.4 |
| Metal Working Machinery | Operating profit | 40.3 | 37.3 |
| Metal Working Machinery | OP margin | 12.2% | 11.4% |
| Sheet-metal | Sales revenue | 298.2 | 296.8 |
| Micro Welding | Sales revenue | 31.9 | 29.6 |
| Metal Machine Tools | Sales revenue | 65.2 | 64.8 |
| Metal Machine Tools | Operating profit | 6.8 | 6.7 |
| Metal Machine Tools | OP margin | 10.6% | 10.4% |
| Cutting & Grinding | Sales revenue | 45.7 | 45.4 |
| Stamping Press | Sales revenue | 19.4 | 19.4 |
| M&A (H&F, Via Mechanics) | Sales revenue | – | 44.7 |
| M&A (H&F, Via Mechanics) | Operating profit | – | 1.8 |
| M&A (H&F, Via Mechanics) | OP margin | – | 4.0% |
| H&F | Sales revenue | – | 23.4 |
| Via Mechanics | Sales revenue | – | 21.3 |
Inventory volume at year-end was 157.7 billion yen, up 26.3 billion yen (+20.0%) year on year, and inventory turnover was 4.3 months, up 0.3 month.
FY2026 Forecast
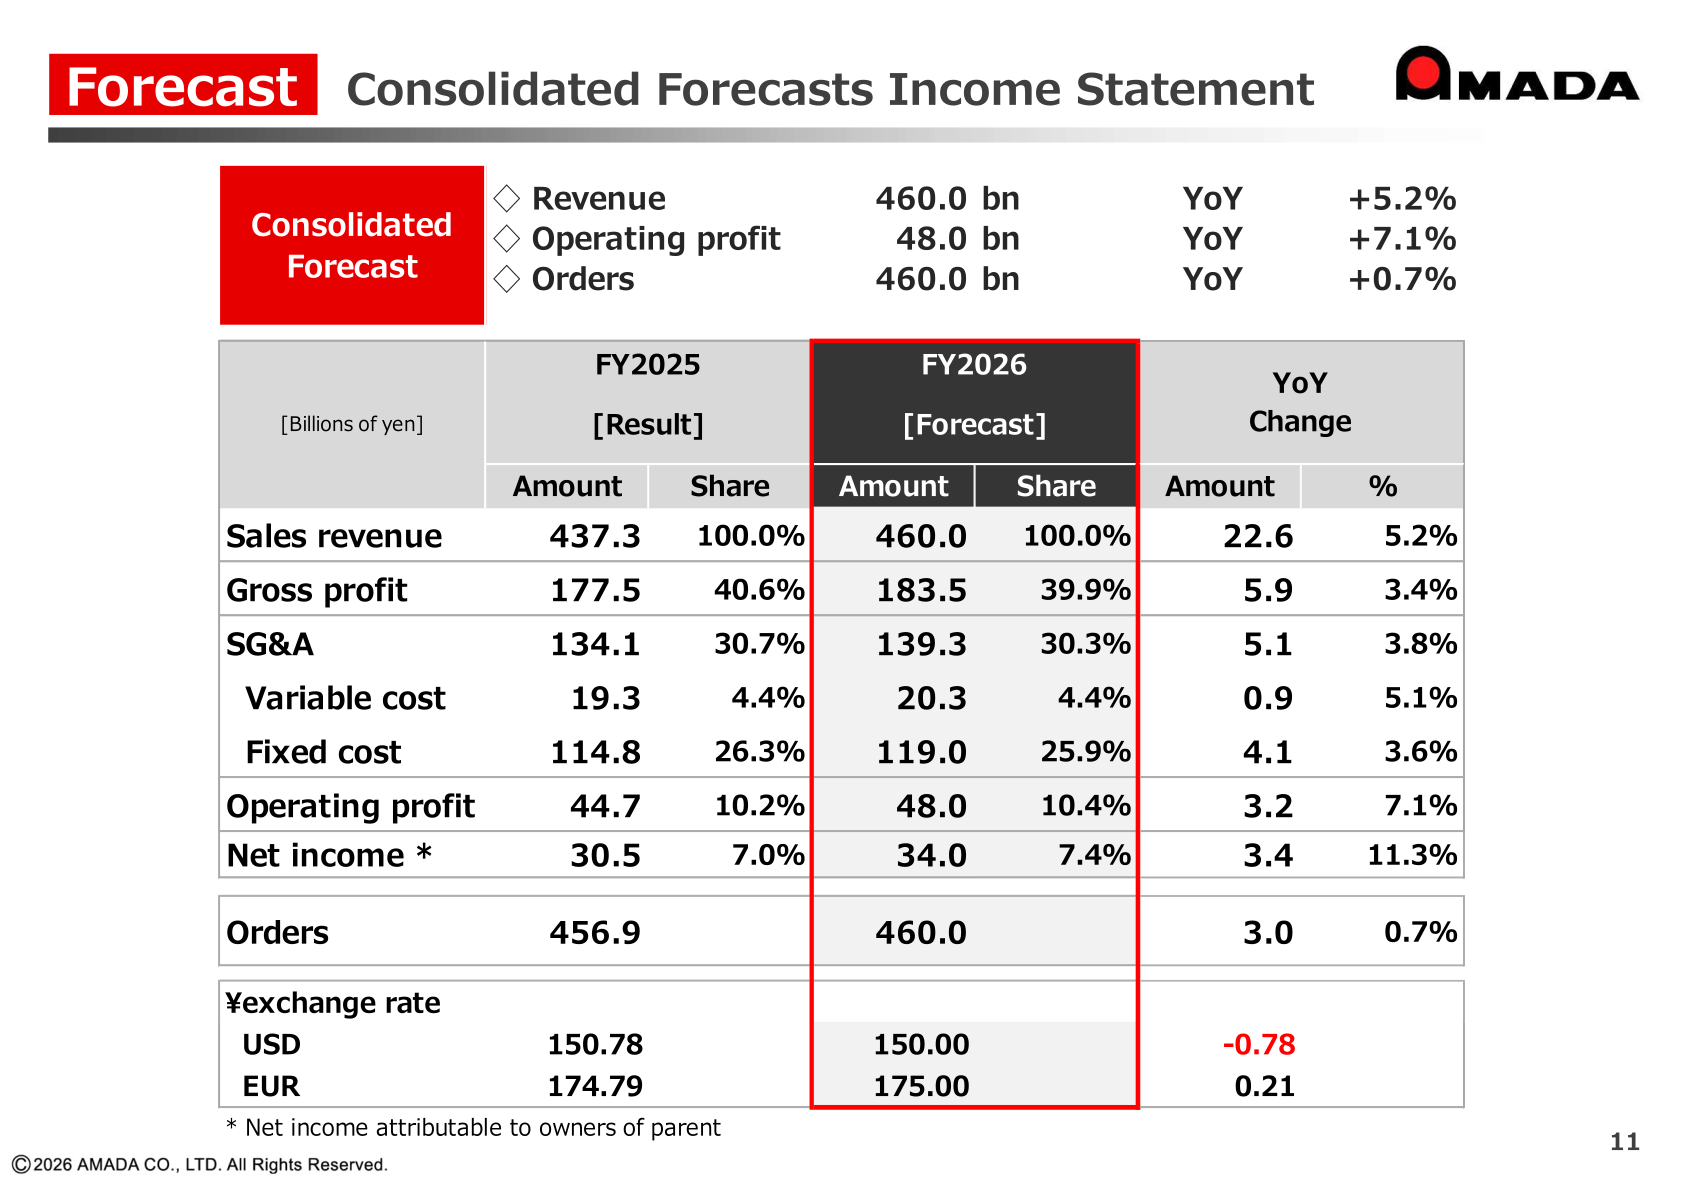
For FY2026 (the fiscal year ending March 31, 2027), AMADA forecasts sales revenue of 460.0 billion yen (+5.2% year on year), operating profit of 48.0 billion yen (+7.1%), net income attributable to owners of parent of 34.0 billion yen (+11.3%), and orders of 460.0 billion yen (+0.7%). The operating margin is projected at 10.4%. The company expects a 3.1 billion yen positive contribution from changes in the COGS percentage (improvement in selling prices and material cost, and a refund of U.S. tariffs, partly offset by decreased factory utilization and the impact of U.S. tariffs) and a 3.2 billion yen negative impact from SG&A expenses, including a 2.0 billion yen increase in personnel expenses and a 0.8 billion yen increase in R&D expenses. Assumed exchange rates are 150.00 yen to the U.S. dollar and 175.00 yen to the euro.
| Item (billions of yen) | FY2025 (Result) | FY2026 (Forecast) | YoY Change | YoY % |
|---|---|---|---|---|
| Sales revenue | 437.3 | 460.0 | 22.6 | 5.2% |
| Gross profit | 177.5 | 183.5 | 5.9 | 3.4% |
| SG&A | 134.1 | 139.3 | 5.1 | 3.8% |
| Operating profit | 44.7 | 48.0 | 3.2 | 7.1% |
| Operating margin | 10.2% | 10.4% | – | – |
| Net income attributable to owners of parent | 30.5 | 34.0 | 3.4 | 11.3% |
| Orders | 456.9 | 460.0 | 3.0 | 0.7% |
Shareholder Returns
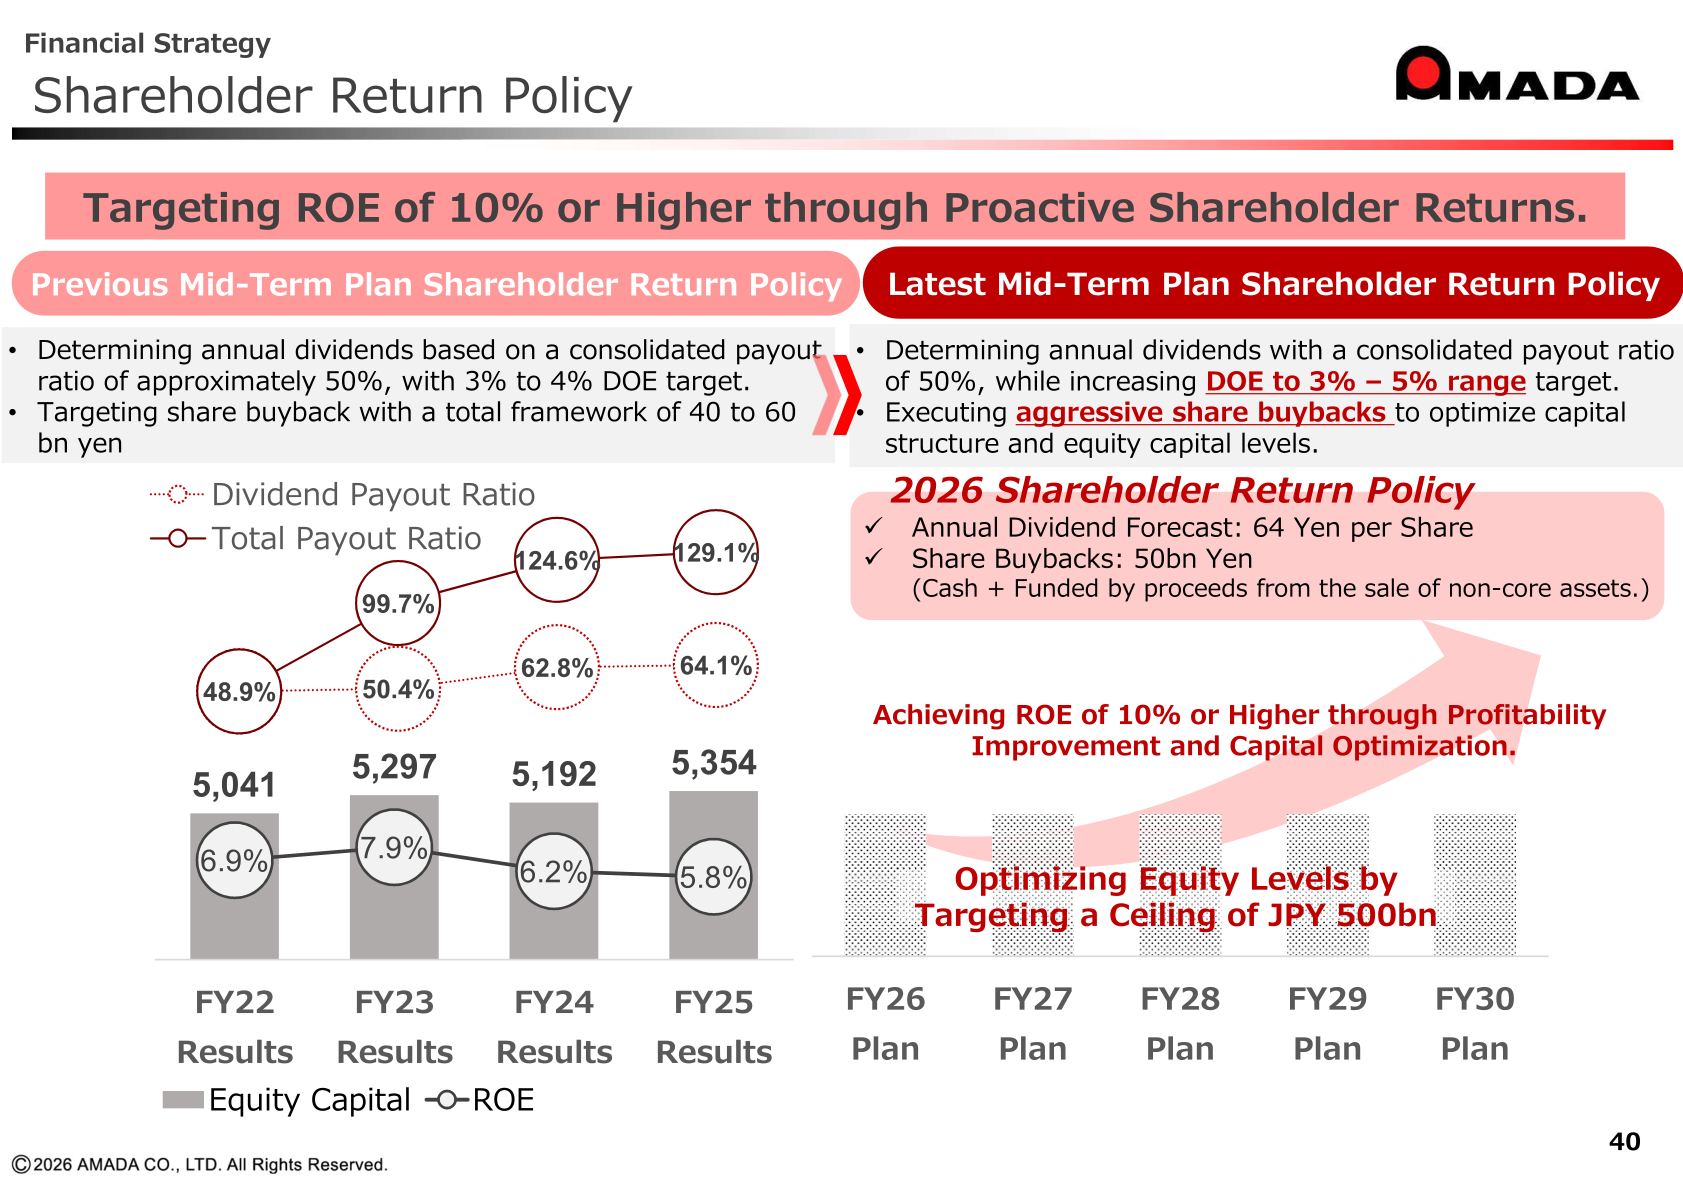
The annual dividend per share for FY2025 was 62 yen (interim 31 yen), unchanged from FY2024, with a payout ratio of 64.1% (FY2024: 62.8%). For FY2026 the company forecasts an annual dividend of 64 yen per share (payout ratio 58.5%) and plans share buybacks of 50 billion yen, funded by cash and proceeds from the sale of non-core assets. ROE was 5.8% in FY2025 (FY2024: 6.2%), and the FY2026 forecast is 6.6%. Under the new Medium-term Business Plan, annual dividends will be determined with a consolidated payout ratio of 50% while increasing the DOE target to the 3%–5% range, with aggressive share buybacks to optimize the capital structure and equity capital levels, targeting a ceiling of JPY 500bn in equity. The plan targets a total payout ratio of 120% on a five-year cumulative basis and ROE of 10% or higher.
| Item | FY2024 | FY2025 | FY2026 (Forecast) |
|---|---|---|---|
| Dividends per share (yen) | 62 | 62 | 64 |
| Payout ratio | 62.8% | 64.1% | 58.5% |
| EPS (yen) | 98.72 | 96.67 | 109.49 |
| ROE | 6.2% | 5.8% | 6.6% |
Medium-term Business Plan 2030
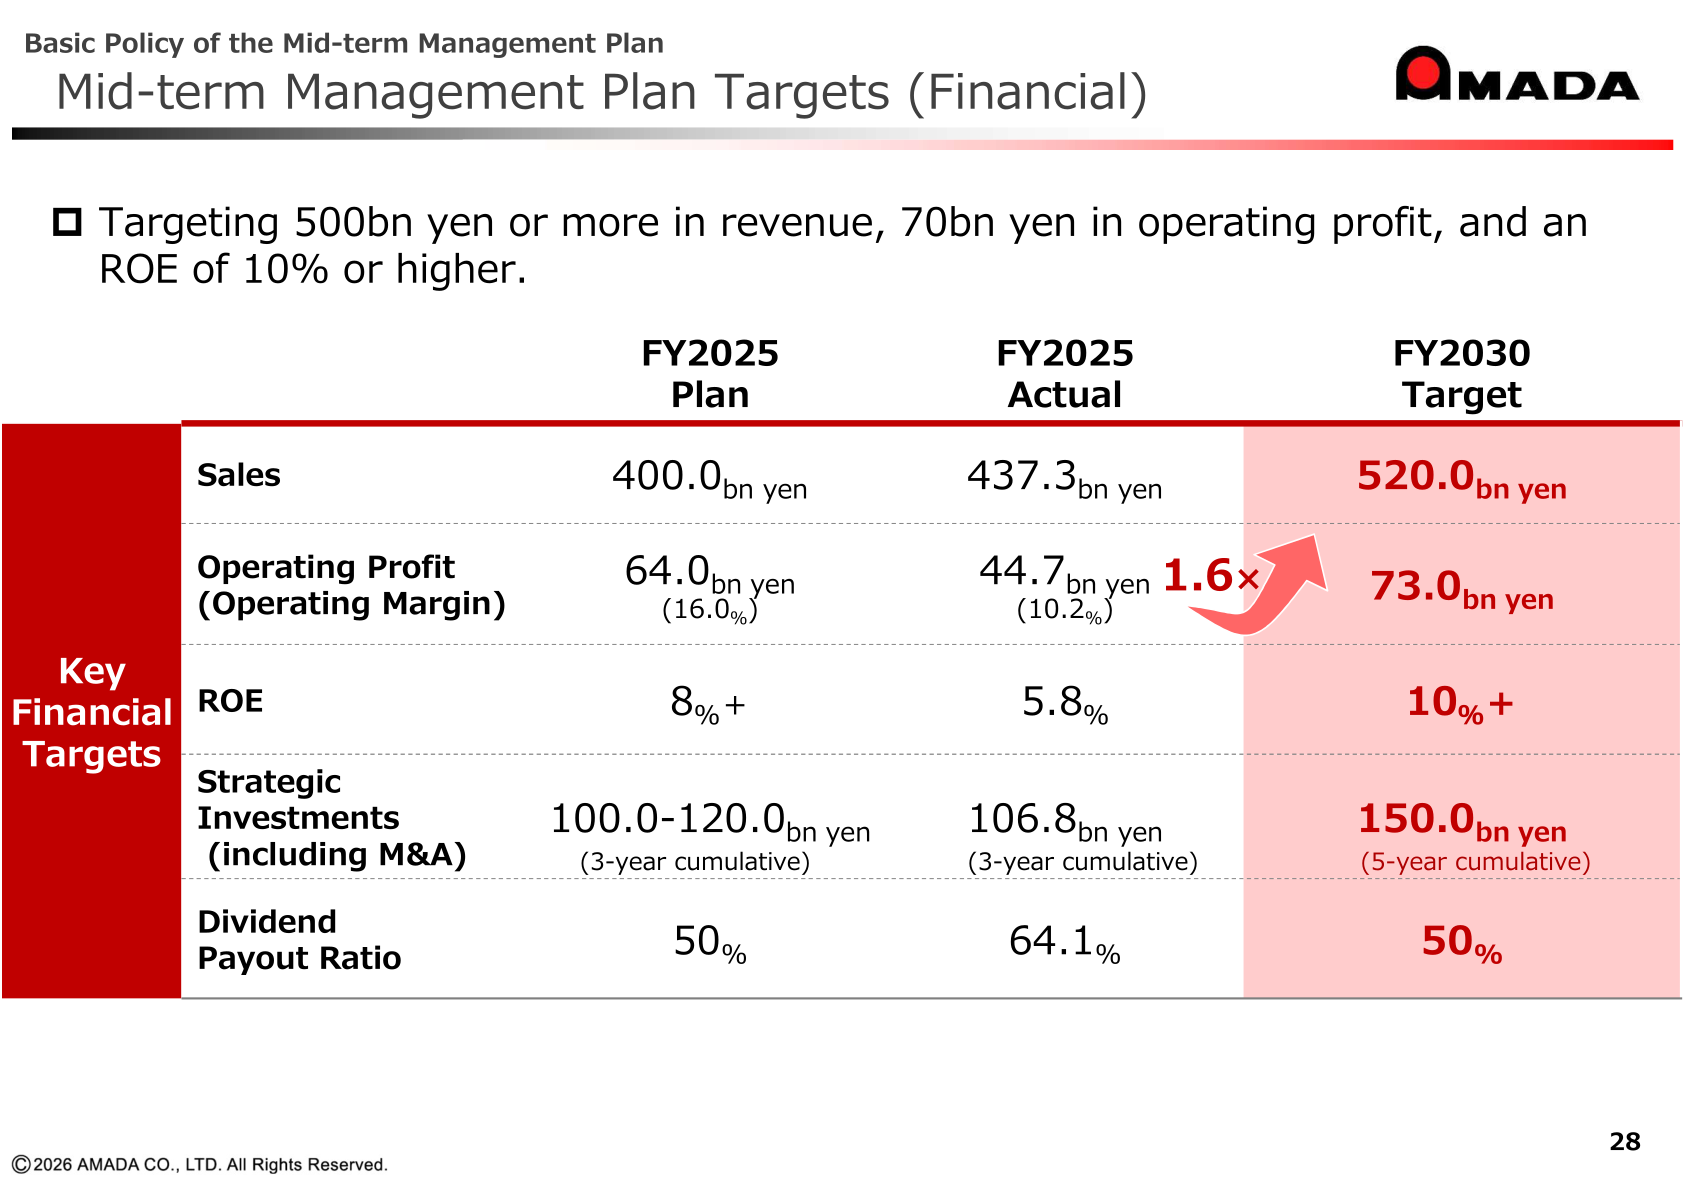
Reviewing the previous plan (FY2023–FY2025), AMADA achieved its sales target (437.3 billion yen versus a 400.0 billion yen plan), driven by the acquisitions of H&F and Via Mechanics, and its growth investment target (106.8 billion yen, including 68.7 billion yen of M&A, versus a 100.0–120.0 billion yen plan), while operating profit (44.7 billion yen, 10.2% margin, versus a 64.0 billion yen, 16.0% plan) and ROE (5.8% versus above 8.0%) missed their targets due to rising costs and delayed price pass-through. The new Medium-term Business Plan 2030 (FY2026–FY2030), under the slogan ‘Transform to AMADA 2030 >> For Growth Acceleration’, sets FY2030 targets of sales of 520.0 billion yen, operating profit of 73.0 billion yen, ROE of 10% or higher, strategic investments including M&A of 150.0 billion yen (five-year cumulative), and a dividend payout ratio of 50%. Key strategies include structural reforms aimed at improving the operating margin by 2–3 percentage points, the introduction of a Business Unit (BU) system with six new BUs to clarify P&L accountability, transition to a company with an Audit and Supervisory Committee, a shift from product-centric sales to a ‘product and service’ model, and non-linear growth through strategic M&A and partnerships. The five-year cash allocation plan envisions sales cash flow of approximately 350 billion yen (before R&D expenses), shareholder returns of approximately 250 billion yen or higher (including share buybacks of approximately 150 billion yen), growth investment of approximately 150 billion yen or higher (strategic capital expenditure and M&A of 70 billion yen, R&D investment of 60 billion yen, management foundation of 10 billion yen, and equipment upgrade of 10 billion yen), and strategic use of debt financing of approximately 50 billion yen or more.
| Item | FY2025 Plan | FY2025 Actual | FY2030 Target |
|---|---|---|---|
| Sales (billions of yen) | 400.0 | 437.3 | 520.0 |
| Operating profit (billions of yen) | 64.0 (16.0%) | 44.7 (10.2%) | 73.0 |
| ROE | 8%+ | 5.8% | 10%+ |
| Strategic investments incl. M&A (billions of yen) | 100.0–120.0 (3-year cumulative) | 106.8 (3-year cumulative) | 150.0 (5-year cumulative) |
| Dividend payout ratio | 50% | 64.1% | 50% |
This article is an analysis based on publicly available information and is not a recommendation to buy or sell any specific securities. Investment decisions are your own responsibility.
![[Obayashi] Investors’ Guide 2026 — The Complete 24-Article Breakdown](https://japan-equity.com/wp-content/uploads/2026/07/hub_cover-1024x1024.png)
![[Obayashi] IR & SR Policy — Feeding Dialogue Back into Management](https://japan-equity.com/wp-content/uploads/2026/07/p32_sq-1024x1024.jpg)
![[Obayashi] Real Estate Development — 18.7% Margin, ¥287.7bn Unrealized Gains](https://japan-equity.com/wp-content/uploads/2026/07/p20_sq-1024x1024.jpg)
![[Obayashi] Domestic Civil Engineering — Resilience Spending Supports 9.6% Margin](https://japan-equity.com/wp-content/uploads/2026/07/p11_sq-1024x1024.jpg)
![[Obayashi] Share Price & External Ratings — vs TOPIX, ESG Index Inclusion](https://japan-equity.com/wp-content/uploads/2026/07/p40_sq-1024x1024.jpg)
![[Construction] ¥75.5tn Investment, Shrinking Workforce — Big-5 Market Share](https://japan-equity.com/wp-content/uploads/2026/07/p12_sq-1024x1024.jpg)



![[Obayashi] Capital Policy & Shareholder Returns — ROE 10%+, DOE ~5%, ¥100bn Buyback](https://japan-equity.com/wp-content/uploads/2026/07/p27_sq-1024x1024.jpg)
![[Obayashi] Reducing Cross-Shareholdings — ¥285.2bn Sold in Five Years](https://japan-equity.com/wp-content/uploads/2026/07/p29_sq-1024x1024.jpg)
![[Obayashi] ¥750bn Investment Plan — ¥300bn to Development, ¥190bn to Tech/DX](https://japan-equity.com/wp-content/uploads/2026/07/p30_sq-1024x1024.jpg)
![[Obayashi] MTP2022 KPIs — Operating Profit ~2x Target, ROE 14.4%](https://japan-equity.com/wp-content/uploads/2026/07/p25_sq-1024x1024.jpg)
![[Obayashi] Cash Allocation — ¥420bn Investment CF Over Five Years](https://japan-equity.com/wp-content/uploads/2026/07/p26_sq-1024x1024.jpg)
![[Obayashi] Green Energy — 44 Plants, 344MW, and the Green Hydrogen Challenge](https://japan-equity.com/wp-content/uploads/2026/07/p21_sq-1024x1024.jpg)
![[Obayashi] Tackling the Labor Shortage — Robotics Construction®](https://japan-equity.com/wp-content/uploads/2026/07/p14_sq-1024x1024.jpg)
