
This article is based on publicly available IR materials and is not a recommendation to buy or sell any specific securities.
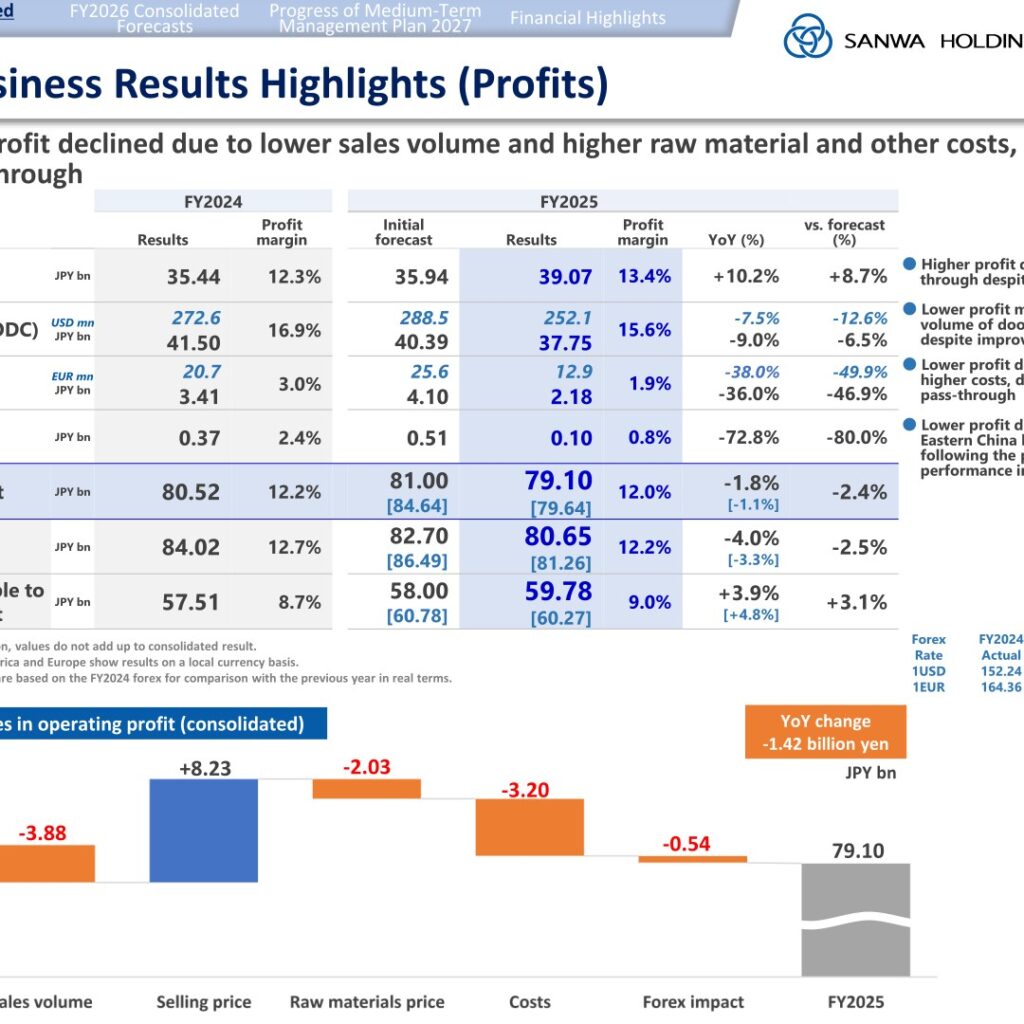
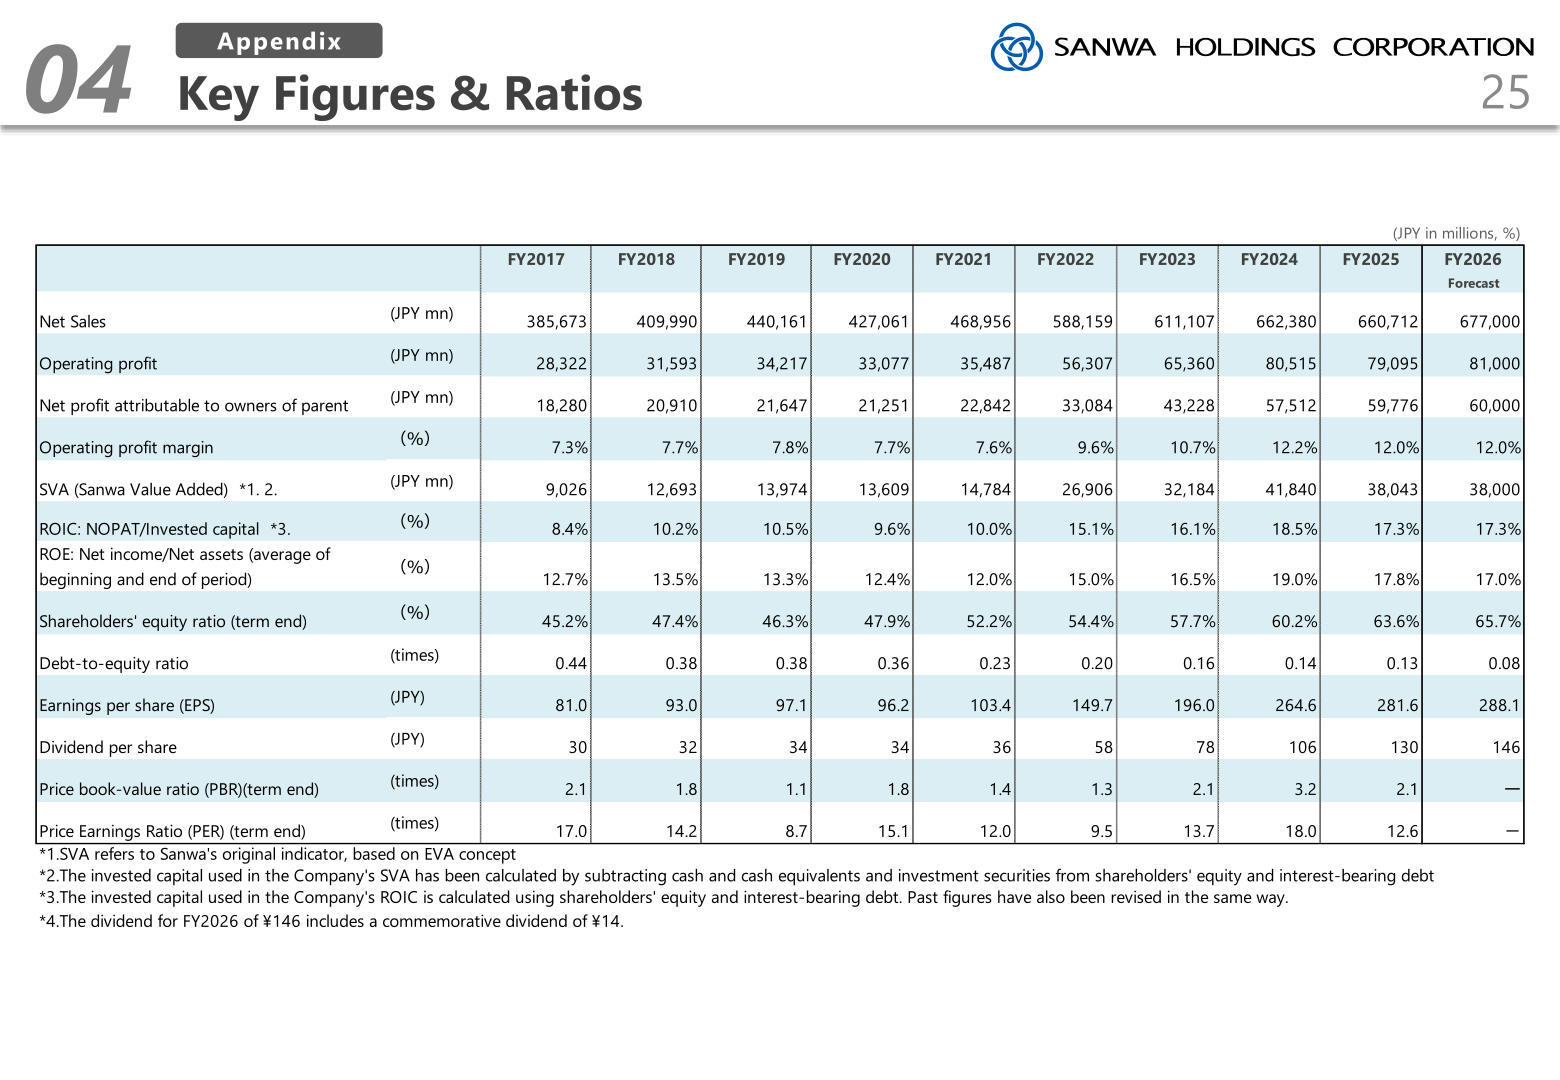
Sanwa Holdings Corporation reported FY2025 net sales of 660.7 billion yen, down 0.3% year on year, and operating profit of 79.10 billion yen, down 1.8%, with an operating profit margin of 12.0%. Ordinary profit fell 4.0% to 80.65 billion yen, while net profit attributable to owners of parent rose 3.9% to 59.78 billion yen. The company describes the outcome as sales and net income exceeding the forecast, while operating profit and ordinary profit fell short of the forecast; profit significantly exceeded the forecast in Japan but fell short in North America, Europe and Asia.
Consolidated Results (Full-Year Actual)
Although markets in Japan, North America and Europe remained weak, results exceeded the initial forecast due to steady progress in passing on higher costs through selling prices. Operating profit declined due to lower sales volume and higher raw material and other costs, despite steady price pass-through. Net sales fell 1.7 billion yen year on year and operating profit fell 1.42 billion yen year on year. The forex rates used were 1USD = 149.78 yen and 1EUR = 169.53 yen for FY2025, against 1USD = 152.24 yen and 1EUR = 164.36 yen for FY2024.
| Item | FY2025 Results | FY2024 Results | YoY (%) | vs. Forecast (%) |
|---|---|---|---|---|
| Net sales (JPY bn) | 660.7 | 662.4 | -0.3% | +1.0% |
| Operating profit (JPY bn) | 79.10 | 80.52 | -1.8% | -2.4% |
| Operating profit margin | 12.0% | 12.2% | — | — |
| Ordinary profit (JPY bn) | 80.65 | 84.02 | -4.0% | -2.5% |
| Net profit attributable to owners of parent (JPY bn) | 59.78 | 57.51 | +3.9% | +3.1% |
| Net profit margin | 9.0% | 8.7% | — | — |
The FY2025 initial forecast was net sales of 654.0 billion yen, operating profit of 81.00 billion yen, ordinary profit of 82.70 billion yen and net profit attributable to owners of parent of 58.00 billion yen. On the appendix basis stated in millions of yen, net sales were 660,712 million yen, operating profit 79,095 million yen, ordinary profit 80,647 million yen and profit attributable to owners of parent 59,776 million yen.
Segment Results
In Japan, sales rose on strong performance in climate change-related products as well as maintenance and services, along with steady progress in price pass-through, and profit rose on steady price pass-through despite lower sales volume. In North America (ODC), sales fell on a local currency basis due to decreased sales volume, and profit declined mainly due to lower sales volume of door products and higher costs. In Europe (NF), sales rose on a local currency basis driven by operator and automatic doors despite lower sales volume of door products, while profit fell on lower sales volume and higher costs. In Asia, sales and profit declined due to the delayed recovery of the eastern China business and a reactionary decline in Hong Kong following the previous year’s strong performance. Note that, due to intercompany elimination, the segment values do not add up to the consolidated result.
| Segment | Net sales FY2025 (JPY bn) | Net sales FY2024 (JPY bn) | Operating profit FY2025 (JPY bn) | Operating profit FY2024 (JPY bn) | OP margin FY2025 |
|---|---|---|---|---|---|
| Japan | 291.3 | 287.7 | 39.07 | 35.44 | 13.4% |
| North America (ODC) | 241.9 | 245.5 | 37.75 | 41.50 | 15.6% |
| Europe (NF) | 115.0 | 114.4 | 2.18 | 3.41 | 1.9% |
| Asia | 13.0 | 15.4 | 0.10 | 0.37 | 0.8% |
On a local currency basis, North America (ODC) net sales were USD 1,615 mn versus USD 1,613 mn in FY2024 (+0.1%) and operating profit was USD 252.1 mn versus USD 272.6 mn (-7.5%). Europe (NF) net sales were EUR 678 mn versus EUR 696 mn (-2.5%) and operating profit was EUR 12.9 mn versus EUR 20.7 mn (-38.0%).
FY2026 Forecast
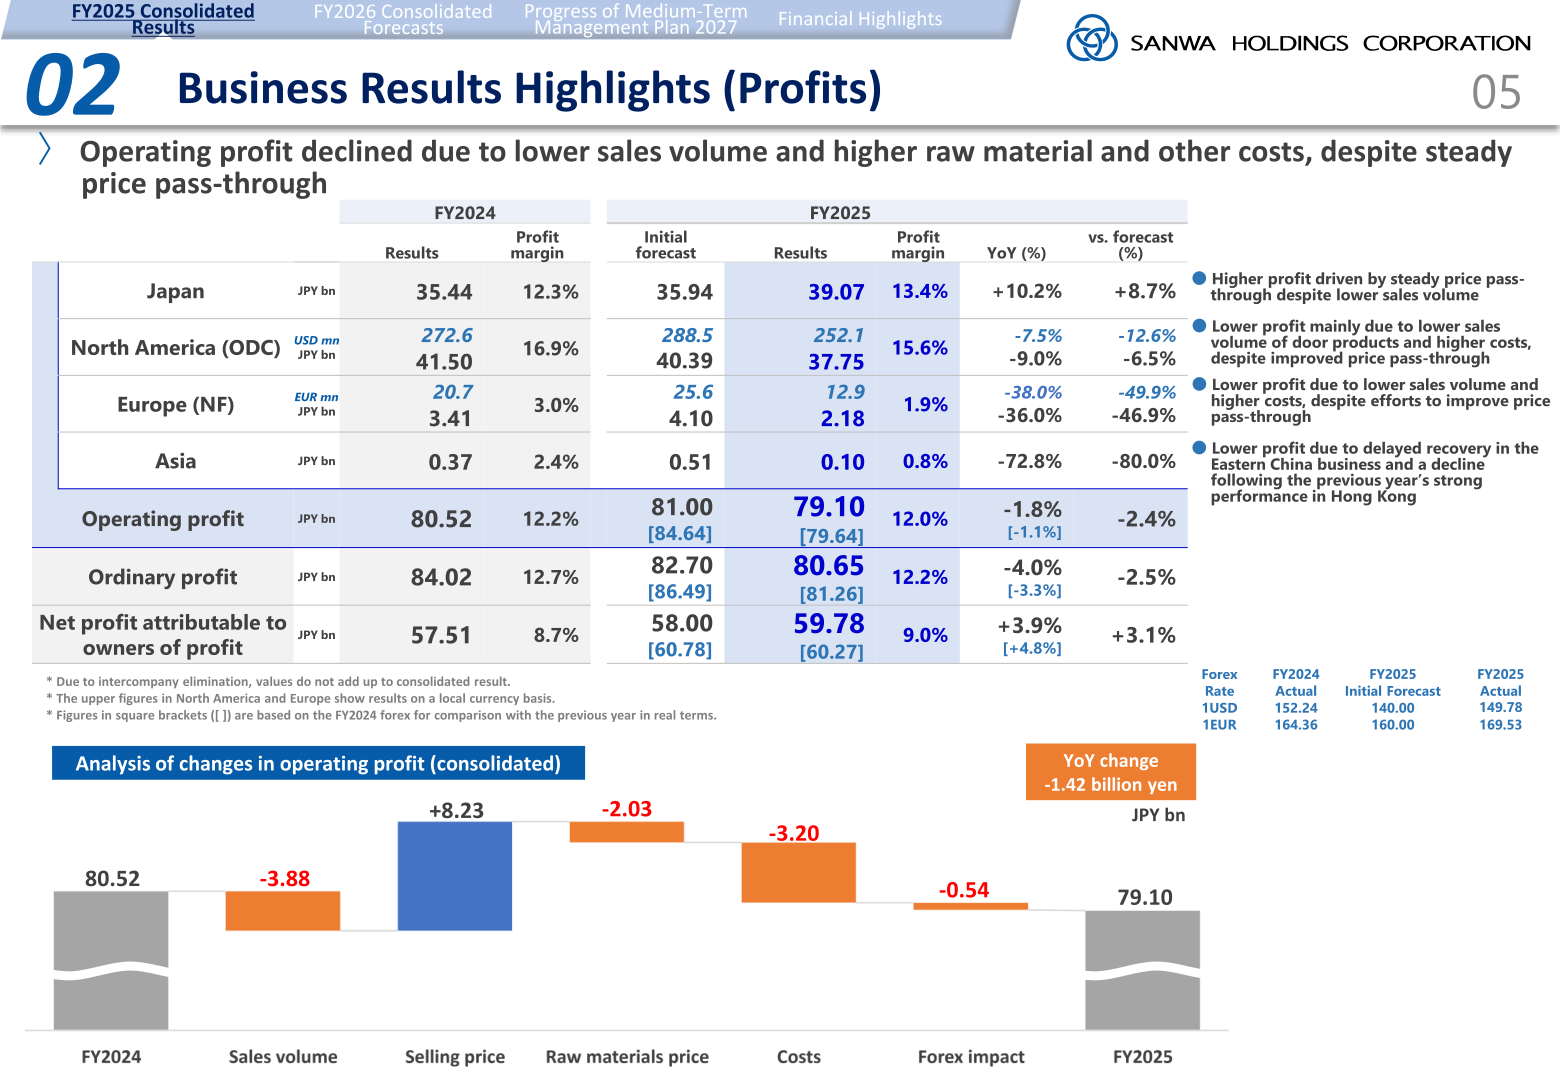
Sales are expected to rise due to efforts to achieve price pass-through despite the delayed recovery in the market environment across all regions, and record-high profit is expected as price pass-through in each region absorbs high raw material and other costs. Net sales are forecast to increase 16.3 billion yen year on year and operating profit 1.90 billion yen year on year. Assumed forex rates are 1USD = 150.00 yen and 1EUR = 180.00 yen. The company states that, as the impact of the situation in the Middle East remains uncertain and difficult to forecast, it has not been factored into the earnings forecast for the fiscal year ending March 2027.
| Item | FY2026 Forecast | FY2025 Results | YoY (%) |
|---|---|---|---|
| Net sales (JPY bn) | 677.0 | 660.7 | +2.5% |
| Operating profit (JPY bn) | 81.00 | 79.10 | +2.4% |
| Operating profit margin | 12.0% | 12.0% | — |
| Ordinary profit (JPY bn) | 82.50 | 80.65 | +2.3% |
| Net profit attributable to owners of parent (JPY bn) | 60.00 | 59.78 | +0.4% |
| Segment | Net sales FY2026 (JPY bn) | YoY (%) | Operating profit FY2026 (JPY bn) | YoY (%) |
|---|---|---|---|---|
| Japan | 294.6 | +1.1% | 39.10 | +0.1% |
| North America (ODC) | 244.2 | +1.0% | 39.40 | +4.4% |
| Europe (NF) | 124.4 | +8.2% | 2.86 | +31.3% |
| Asia | 14.3 | +10.2% | 0.15 | +46.1% |
Shareholder Returns
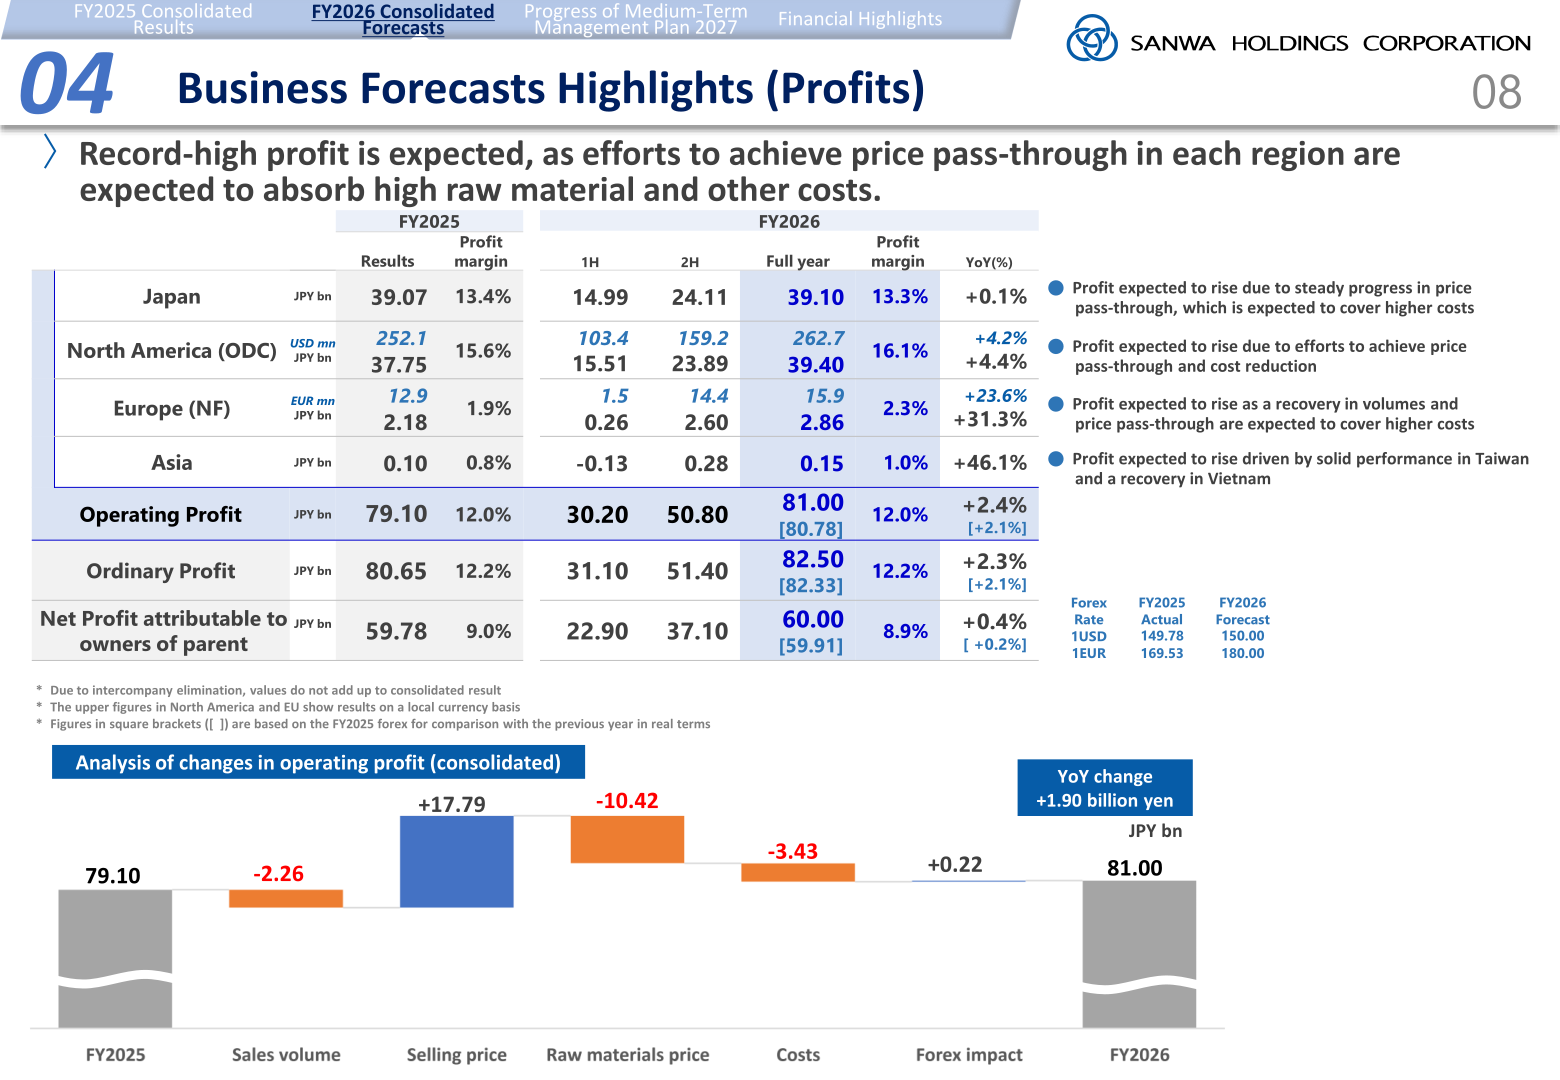
The dividend policy has been revised. Before the revision, the company aimed to provide stable dividends based on a dividend on equity (DOE) of 8% using shareholders’ equity including accumulated other comprehensive income as the base. After the revision, it aims to provide stable dividends based on a DOE of 10% using shareholders’ equity only as the base, equivalent to a dividend payment ratio of approximately 45%. The base was changed from total equity to shareholders’ equity, excluding items with high volatility such as foreign currency translation adjustments, and the DOE target was revised from 8.0% to 10.0% to maintain the dividend level.
For FY2025 the year-end dividend is planned at 68 yen, 6 yen above the forecast, for an annual dividend of 130 yen, up 24 yen year on year. For FY2026 the company forecasts an annual dividend of 146 yen, up 16 yen year on year, consisting of an ordinary dividend of 132 yen and a 70th anniversary commemorative dividend of 14 yen. A new share repurchase program of 10.0 billion yen was announced, for up to 3.65 million shares, to be completed by September 30, 2026.
| Item | FY2025 | FY2026 (Forecast) |
|---|---|---|
| Annual dividend per share (JPY) | 130 | 146 |
| Interim dividend per share (JPY) | 62 | 73 |
| Year-end dividend per share (JPY) | 68 | 73 |
| Ordinary dividend per share (JPY) | — | 132 |
| Commemorative dividend per share (JPY) | — | 14 |
| Total dividends (JPY bn) | 27.4 | 30.3 |
| Share buybacks (JPY bn) | 20.0 | 10.0 |
Financial Position and Cash Flow
Total assets stood at 547.8 billion yen, up 13.2 billion yen from FY2024, with net assets of 351.0 billion yen, up 26.8 billion yen, and interest-bearing debt of 44.6 billion yen, down 0.5 billion yen. Cash and cash equivalents were 91.6 billion yen, down 11.5 billion yen, equivalent to 1.7 months, against the company’s stated policy of maintaining a level equivalent to approximately 1.5 to 2.0 months of sales. Cash flow from operating activities was 61.4 billion yen and free cash flow was 43.5 billion yen, while cash flow from financing activities was -52.7 billion yen, including dividends of -25.8 billion yen and stock buybacks of -21.9 billion yen. Major extraordinary income in FY2025 includes income on sale of land, and major extraordinary losses include business restructuring expenses in Europe and North America.
Medium-Term Management Plan 2027 and Topics
Under Medium-Term Management Plan 2027, the company targets ROIC at a 17%-19% level and ROE at a 17%-19% level, against a WACC of 7.0% and a cost of equity of 8.0%. The cumulative 2025-2027 plan assumes operating cash flow of 210.0 billion yen, total investment of 225.0 billion yen comprising growth investments of 100.0 billion yen (M&A investments of 50.0 billion yen and capital investments of 50.0 billion yen), and shareholder returns of 125.0 billion yen (dividends of 85.0 billion yen and stock buybacks of 40.0 billion yen). Capital investments were 12.0 billion yen and IT investments 2.2 billion yen in FY2025, planned at 15.6 billion yen and 3.1 billion yen respectively in FY2026, against cumulative targets of 40.0 billion yen and 10.0 billion yen.
In Asia, net sales were 13.0 billion yen with operating profit of 0.10 billion yen in FY2025, forecast at 14.3 billion yen and 0.15 billion yen in FY2026, against FY2027 targets of 19.6 billion yen and 1.25 billion yen. Sales of products for disaster preparedness and climate change response totalled 218.8 billion yen in FY2025, a 33.1% sales ratio, versus 213.3 billion yen and 32.2% in FY2024, with an FY2027 target of 230.0 billion yen. Smart products and services rose to 16.2 billion yen from 13.0 billion yen. The company acquired all shares of two U.S. companies engaged in automatic door services and installation, Pasco Doors in May 2025 and Your Automatic Door Company in February 2026, and was selected for the CDP 2025 Climate Change A List, the highest rating, for the first time.
Key ratios for FY2025 were earnings per share of 281.6 yen, ROE of 17.8%, ROIC of 17.3%, a shareholders’ equity ratio of 63.6% and a debt-to-equity ratio of 0.13 times. For FY2026 the company shows forecast EPS of 288.1 yen, ROE of 17.0%, ROIC of 17.3% and a shareholders’ equity ratio of 65.7%.
This article is an analysis based on publicly available information and is not a recommendation to buy or sell any specific securities. Investment decisions are your own responsibility.
![[Obayashi] Investors’ Guide 2026 — The Complete 24-Article Breakdown](https://japan-equity.com/wp-content/uploads/2026/07/hub_cover-1024x1024.png)
![[Obayashi] IR & SR Policy — Feeding Dialogue Back into Management](https://japan-equity.com/wp-content/uploads/2026/07/p32_sq-1024x1024.jpg)
![[Obayashi] Real Estate Development — 18.7% Margin, ¥287.7bn Unrealized Gains](https://japan-equity.com/wp-content/uploads/2026/07/p20_sq-1024x1024.jpg)
![[Obayashi] Domestic Civil Engineering — Resilience Spending Supports 9.6% Margin](https://japan-equity.com/wp-content/uploads/2026/07/p11_sq-1024x1024.jpg)
![[Obayashi] Share Price & External Ratings — vs TOPIX, ESG Index Inclusion](https://japan-equity.com/wp-content/uploads/2026/07/p40_sq-1024x1024.jpg)
![[Construction] ¥75.5tn Investment, Shrinking Workforce — Big-5 Market Share](https://japan-equity.com/wp-content/uploads/2026/07/p12_sq-1024x1024.jpg)



![[Obayashi] Capital Policy & Shareholder Returns — ROE 10%+, DOE ~5%, ¥100bn Buyback](https://japan-equity.com/wp-content/uploads/2026/07/p27_sq-1024x1024.jpg)
![[Obayashi] Reducing Cross-Shareholdings — ¥285.2bn Sold in Five Years](https://japan-equity.com/wp-content/uploads/2026/07/p29_sq-1024x1024.jpg)
![[Obayashi] ¥750bn Investment Plan — ¥300bn to Development, ¥190bn to Tech/DX](https://japan-equity.com/wp-content/uploads/2026/07/p30_sq-1024x1024.jpg)
![[Obayashi] MTP2022 KPIs — Operating Profit ~2x Target, ROE 14.4%](https://japan-equity.com/wp-content/uploads/2026/07/p25_sq-1024x1024.jpg)
![[Obayashi] Cash Allocation — ¥420bn Investment CF Over Five Years](https://japan-equity.com/wp-content/uploads/2026/07/p26_sq-1024x1024.jpg)
![[Obayashi] Green Energy — 44 Plants, 344MW, and the Green Hydrogen Challenge](https://japan-equity.com/wp-content/uploads/2026/07/p21_sq-1024x1024.jpg)
![[Obayashi] Tackling the Labor Shortage — Robotics Construction®](https://japan-equity.com/wp-content/uploads/2026/07/p14_sq-1024x1024.jpg)
