
This article is based on publicly available IR materials and is not a recommendation to buy or sell any specific securities.
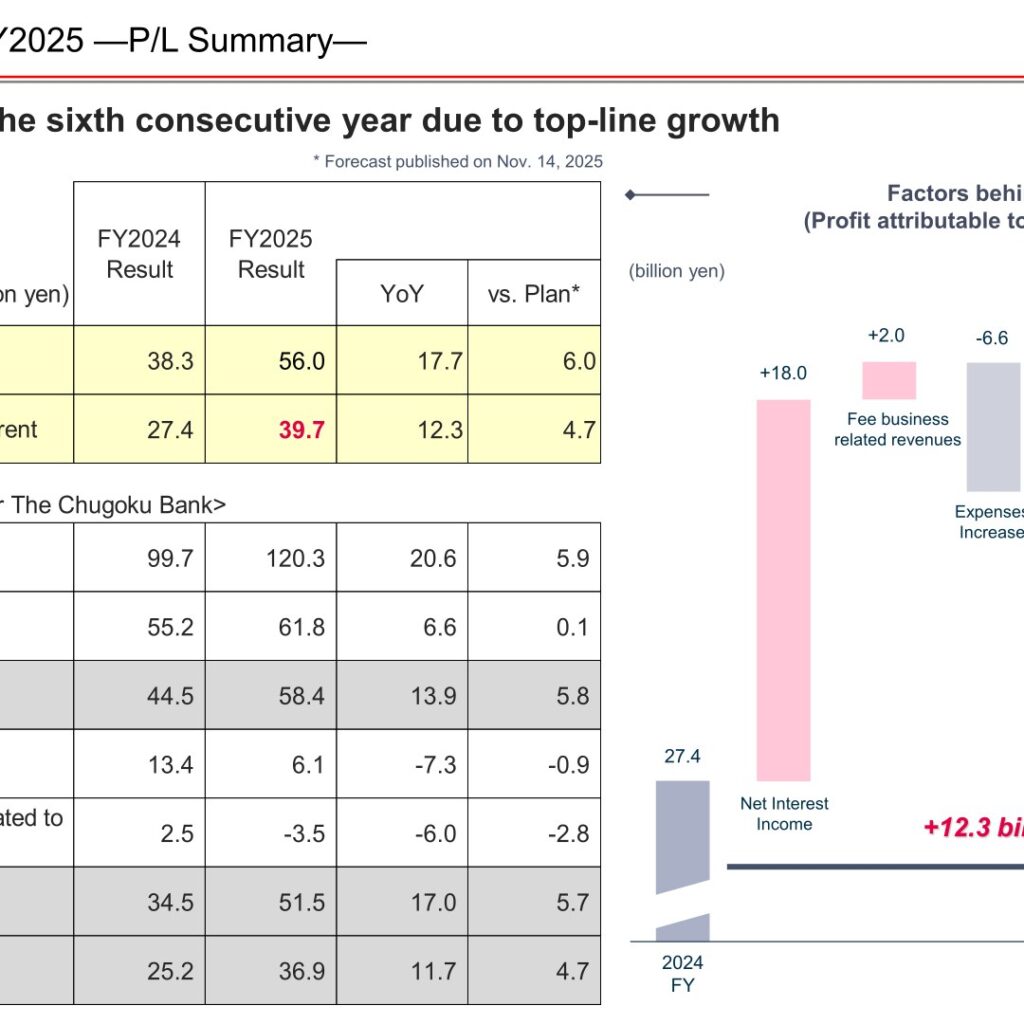
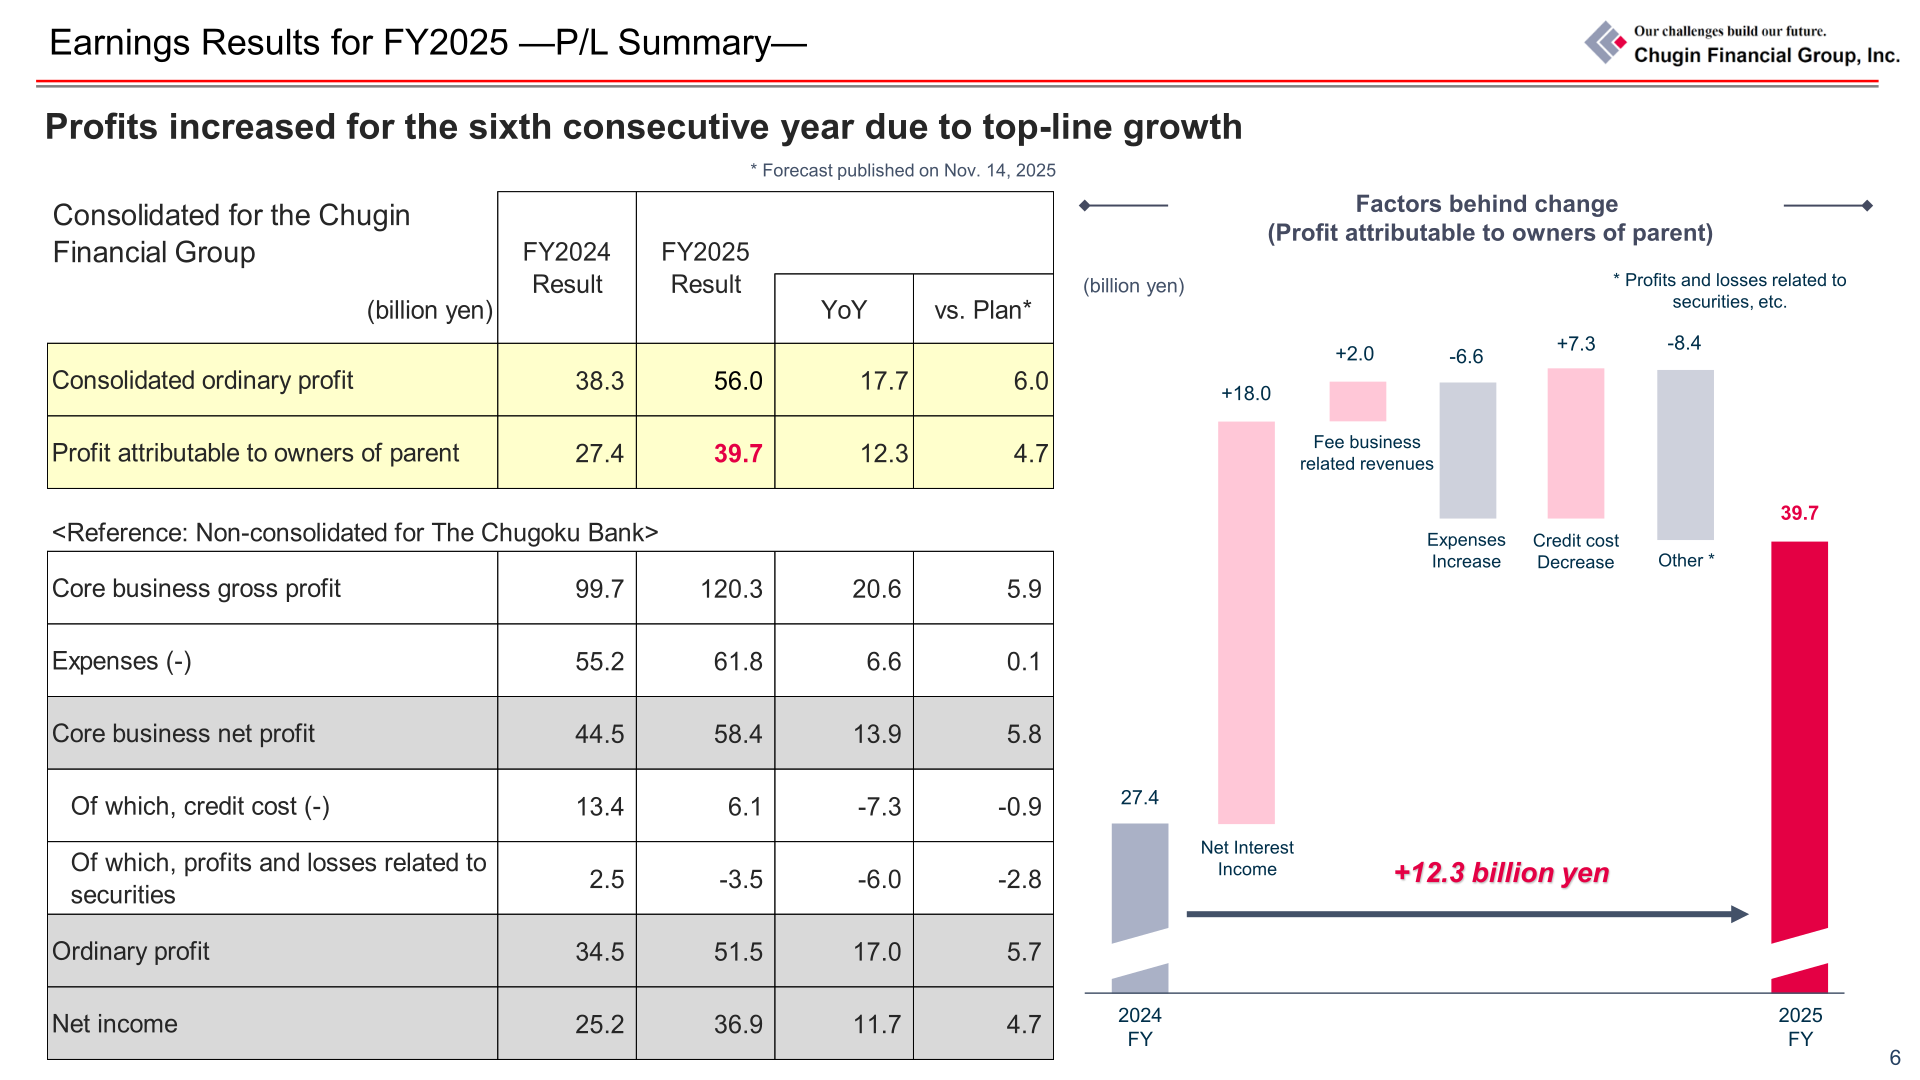
Chugin Financial Group, Inc. (5832), the holding company of The Chugoku Bank, reported FY2025 (the fiscal year ended March 31, 2026) consolidated ordinary profit of 56.0 billion yen and profit attributable to owners of parent of 39.7 billion yen, an increase of 12.3 billion yen year on year and 4.7 billion yen above the plan published on November 14, 2025. The company describes this as the sixth consecutive year of profit growth, driven by top-line expansion centred on net interest income together with a decline in credit costs. ROE on the TSE basis was 6.8%. For FY2026 the Group forecasts profit attributable to owners of parent of 45.0 billion yen and ROE of 7% or more.
Consolidated Results (Full-Year Actual)
Consolidated gross profit rose to 111.3 billion yen from 105.2 billion yen, while consolidated gross profit excluding profits and losses related to bonds rose to 129.5 billion yen from 108.0 billion yen, the gap reflecting bond-related losses of -18.2 billion yen booked as part of the securities portfolio replacement. Net interest income advanced 18.3 billion yen to 93.6 billion yen and fees and commissions income rose 1.5 billion yen to 21.7 billion yen. Expenses increased 7.0 billion yen to 66.5 billion yen, while credit costs fell 7.2 billion yen to 6.8 billion yen and profits and losses related to equity improved 9.2 billion yen to 14.5 billion yen.
| Item (billion yen) | FY2025 | FY2024 | YoY |
|---|---|---|---|
| Consolidated gross profit | 111.3 | 105.2 | 6.1 |
| Consolidated gross profit (excluding profits and losses related to bonds) | 129.5 | 108.0 | 21.5 |
| Net interest income | 93.6 | 75.3 | 18.3 |
| Fees and commissions income | 21.7 | 20.2 | 1.5 |
| Net other operating profits | -4.0 | 9.5 | -13.5 |
| Of which, profits and losses related to bonds | -18.2 | -2.8 | -15.4 |
| Expenses (-) | 66.5 | 59.5 | 7.0 |
| Credit cost (-) | 6.8 | 14.0 | -7.2 |
| Profits and losses related to equity | 14.5 | 5.3 | 9.2 |
| Other | 3.5 | 1.3 | 2.2 |
| Ordinary profit | 56.0 | 38.3 | 17.7 |
| Extraordinary profits and losses | -0.3 | -0.0 | -0.3 |
| Profit attributable to owners of parent | 39.7 | 27.4 | 12.3 |
The Chugoku Bank (Non-consolidated)
At the banking subsidiary, core business gross profit rose 20.6 billion yen to 120.3 billion yen and core business net profit rose 13.9 billion yen to 58.4 billion yen. OHR improved 3.9 pt to 51.4%. Yen-denominated net interest income was 80.9 billion yen, up 15.7 billion yen year on year, with the yen loan yield rising to 1.15% from 0.90% and the yen deposit yield rising to 0.21% from 0.06%; foreign currency net interest income was 13.4 billion yen, up 2.3 billion yen. Expenses rose 6.6 billion yen to 61.8 billion yen, reflecting base pay increases, higher bonuses and strategic investments, with personnel expenses at 30.3 billion yen and system expenses at 8.9 billion yen. Credit costs fell 7.3 billion yen to 6.1 billion yen as the previous year included multiple large-scale provisions.
| Item (billion yen) | FY2025 | FY2024 | YoY |
|---|---|---|---|
| Core business gross profit | 120.3 | 99.7 | 20.6 |
| Net interest income | 94.3 | 76.3 | 18.0 |
| Net fee income | 23.4 | 21.6 | 1.8 |
| Net other operating profits | 2.4 | 1.7 | 0.7 |
| Expenses (-) | 61.8 | 55.2 | 6.6 |
| OHR | 51.4% | 55.3% | -3.9pt |
| Core business net profit | 58.4 | 44.5 | 13.9 |
| Credit cost (-) | 6.1 | 13.4 | -7.3 |
| Profits and losses related to securities | -3.5 | 2.5 | -6.0 |
| Ordinary profit | 51.5 | 34.5 | 17.0 |
| Net income | 36.9 | 25.2 | 11.7 |
Fee business-related revenues on a Group total basis expanded to 32.4 billion yen from 30.4 billion yen, an increase of 2.0 billion yen, with growth across the investment banking business, assets in custody and other net fee income.
Group Company Results
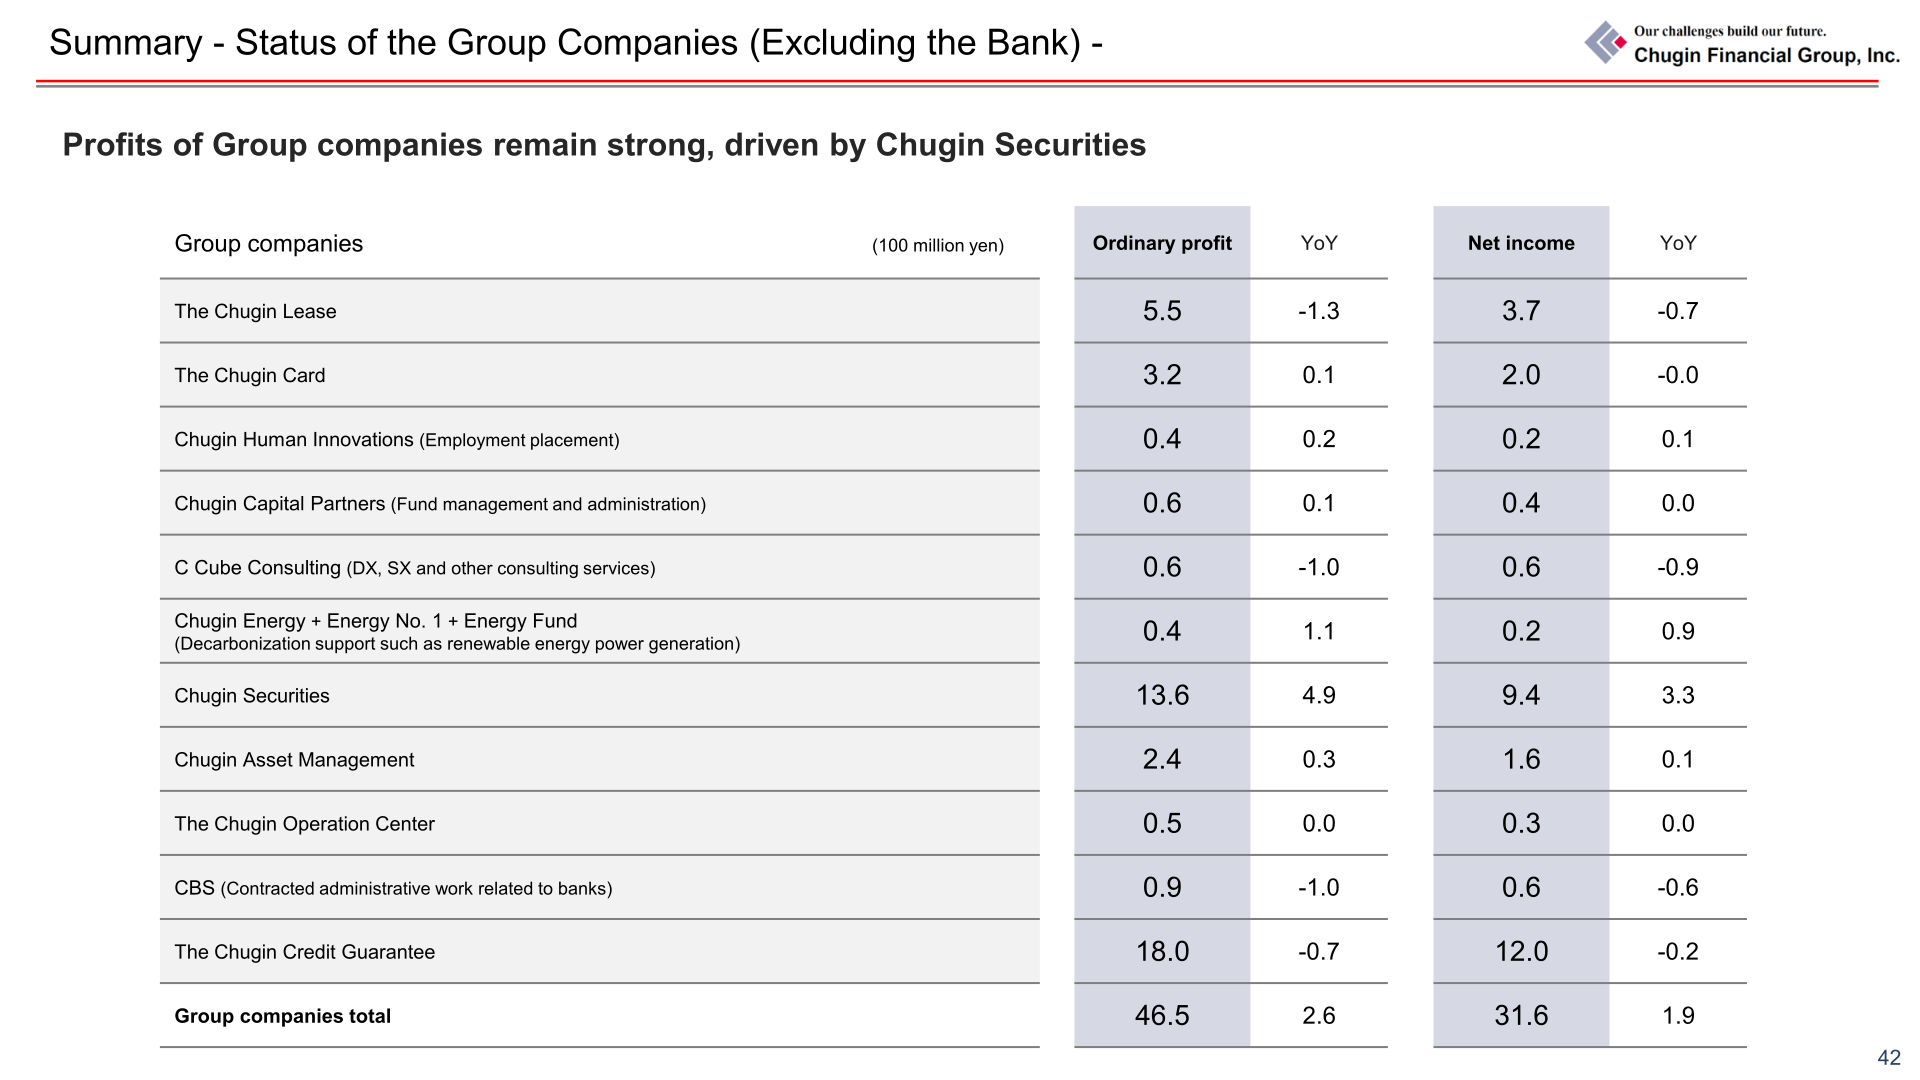
Profits at Group companies other than the Bank remained strong, led by Chugin Securities. Combined ordinary profit for the Group companies was 46.5 (100 million yen), up 2.6 year on year, and combined net income was 31.6, up 1.9.
| Group company (100 million yen) | Ordinary profit | YoY | Net income | YoY |
|---|---|---|---|---|
| The Chugin Lease | 5.5 | -1.3 | 3.7 | -0.7 |
| The Chugin Card | 3.2 | 0.1 | 2.0 | -0.0 |
| Chugin Human Innovations (Employment placement) | 0.4 | 0.2 | 0.2 | 0.1 |
| Chugin Capital Partners (Fund management and administration) | 0.6 | 0.1 | 0.4 | 0.0 |
| C Cube Consulting (DX, SX and other consulting services) | 0.6 | -1.0 | 0.6 | -0.9 |
| Chugin Energy + Energy No. 1 + Energy Fund | 0.4 | 1.1 | 0.2 | 0.9 |
| Chugin Securities | 13.6 | 4.9 | 9.4 | 3.3 |
| Chugin Asset Management | 2.4 | 0.3 | 1.6 | 0.1 |
| The Chugin Operation Center | 0.5 | 0.0 | 0.3 | 0.0 |
| CBS (Contracted administrative work related to banks) | 0.9 | -1.0 | 0.6 | -0.6 |
| The Chugin Credit Guarantee | 18.0 | -0.7 | 12.0 | -0.2 |
| Group companies total | 46.5 | 2.6 | 31.6 | 1.9 |
Balance Sheet and Capital
On a consolidated basis at the end of March 2026, assets stood at 11.3 trillion yen (+0.3 trillion yen), liabilities at 10.7 trillion yen (+0.2 trillion yen) and net assets at 0.6 trillion yen (+0.1 trillion yen). Loans reached 6.7 trillion yen (YoY +0.2 trillion yen, +3.4%), of which business loans were 4.8 trillion yen (YoY +125.8 billion yen, +2.7%) and personal loans 1.4 trillion yen (YoY +78.1 billion yen, +5.7%). Securities were 3.1 trillion yen (YoY +0.3 trillion yen) and deposits 8.5 trillion yen (YoY +0.1 trillion yen, +1.6%).
| Item | Mar. 31, 2026 | Mar. 31, 2025 | Change |
|---|---|---|---|
| Total capital (billion yen) | 640.6 | 564.9 | 75.7 |
| Of which, common equity Tier 1 (billion yen) | 583.9 | 519.9 | 64.0 |
| Of which, valuation difference on available for sale securities, etc. (billion yen) | 56.5 | 12.4 | 44.1 |
| Risk assets, etc. (billion yen) | 4,797.5 | 4,380.1 | 417.4 |
| Ratio of common equity Tier 1 (excluding the valuation difference on available-for-sale securities, etc.) | 11.0 | 11.6 | – |
| Total capital adequacy ratio | 13.4 | 12.9 | – |
| Consolidated leverage ratio | 5.57% | 5.20% | – |
| Consolidated liquidity coverage ratio (LCR) | 145.8% | 132.6% | – |
Cross-shareholdings continued to be reduced. On a book value basis the balance fell to 26.0 billion yen at March 31, 2026 from 28.0 billion yen a year earlier, a reduction of 48% compared with March 31, 2022 against a reduction plan of 50% by March 31, 2027. Fair value was 97.7 billion yen, equivalent to a consolidated net asset ratio of 15.7% on a fair value basis and 4.2% on a book value basis.
FY2026 Forecast
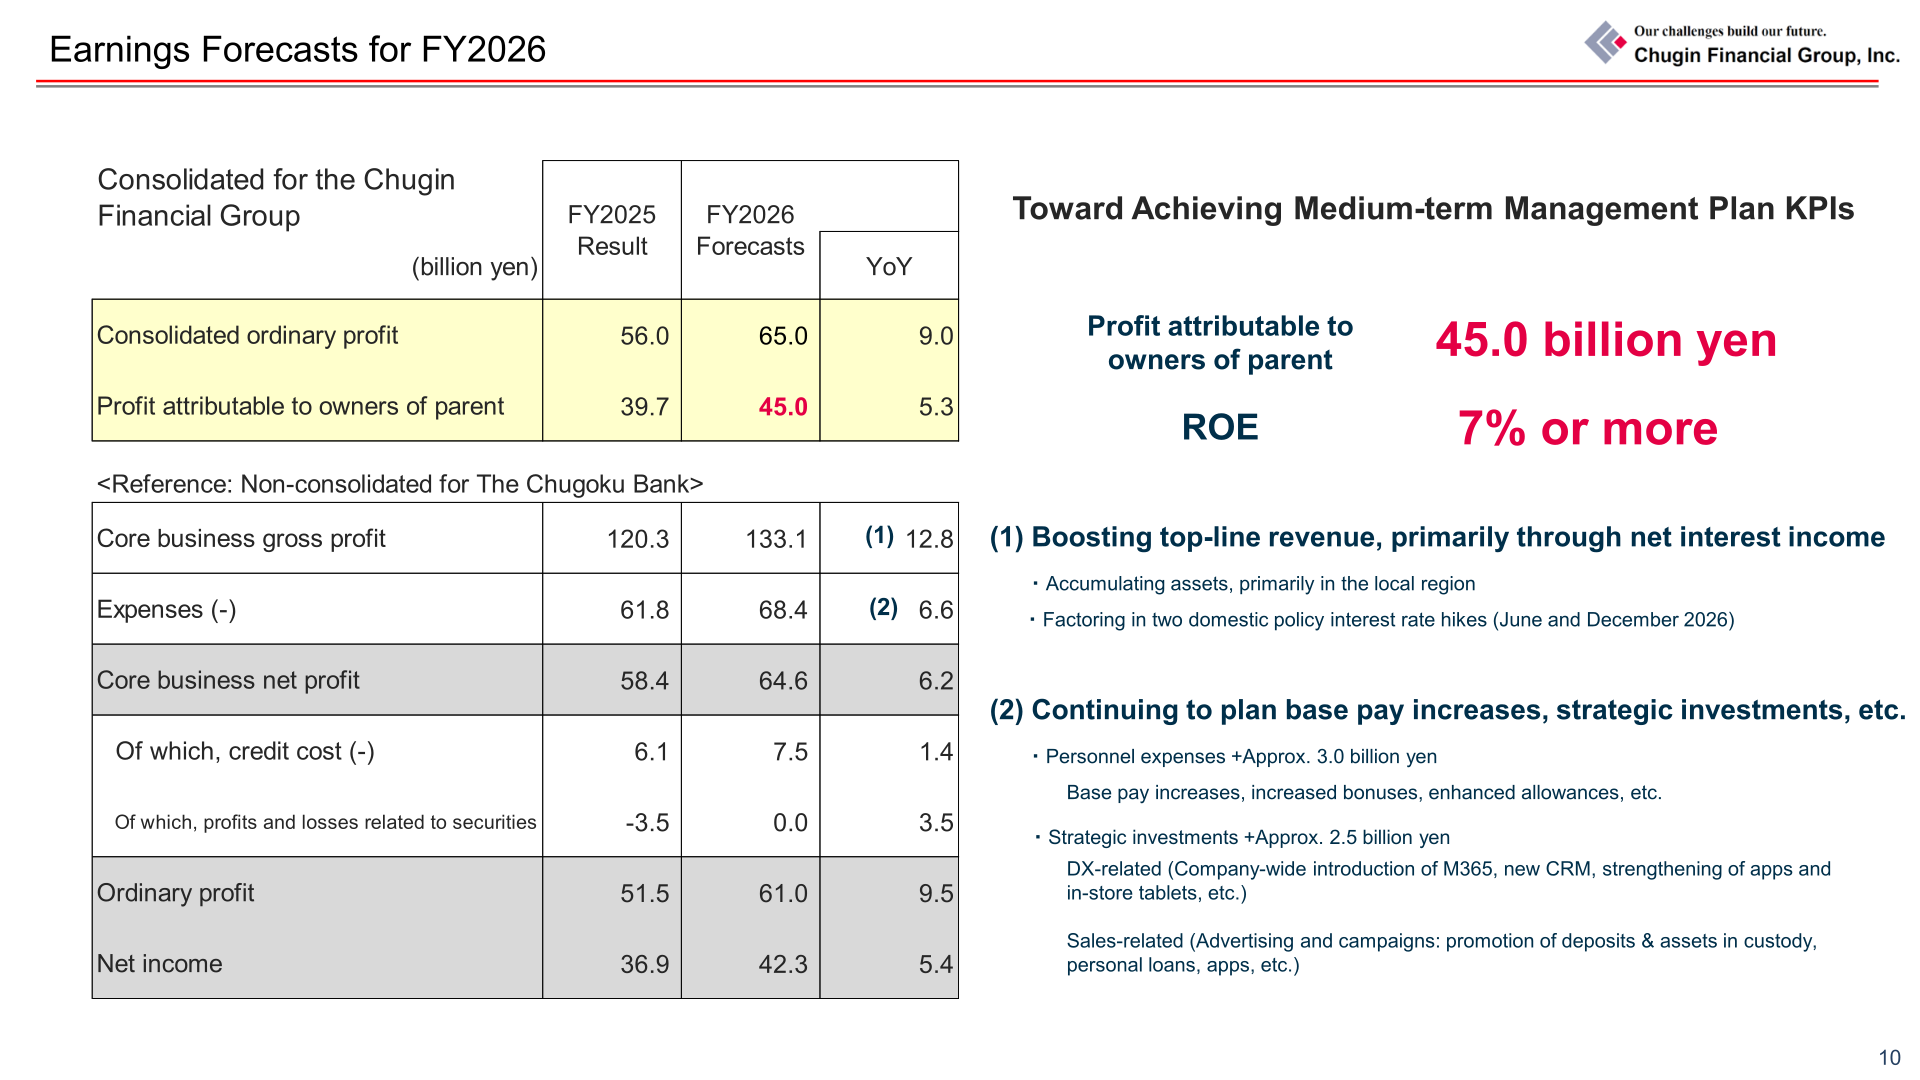
For FY2026 the Group forecasts consolidated ordinary profit of 65.0 billion yen and profit attributable to owners of parent of 45.0 billion yen, with ROE of 7% or more. The plan assumes continued top-line growth centred on net interest income, accumulating assets primarily in the local region and factoring in two domestic policy interest rate hikes (June and December 2026). It also assumes continued base pay increases and strategic investments, with personnel expenses up approximately 3.0 billion yen and strategic investments up approximately 2.5 billion yen.
| Item (billion yen) | FY2026 Forecast | FY2025 Result | YoY |
|---|---|---|---|
| Consolidated ordinary profit | 65.0 | 56.0 | 9.0 |
| Profit attributable to owners of parent | 45.0 | 39.7 | 5.3 |
| The Chugoku Bank: Core business gross profit | 133.1 | 120.3 | 12.8 |
| The Chugoku Bank: Expenses (-) | 68.4 | 61.8 | 6.6 |
| The Chugoku Bank: Core business net profit | 64.6 | 58.4 | 6.2 |
| The Chugoku Bank: Credit cost (-) | 7.5 | 6.1 | 1.4 |
| The Chugoku Bank: Profits and losses related to securities | 0.0 | -3.5 | 3.5 |
| The Chugoku Bank: Ordinary profit | 61.0 | 51.5 | 9.5 |
| The Chugoku Bank: Net income | 42.3 | 36.9 | 5.4 |
Shareholder Returns
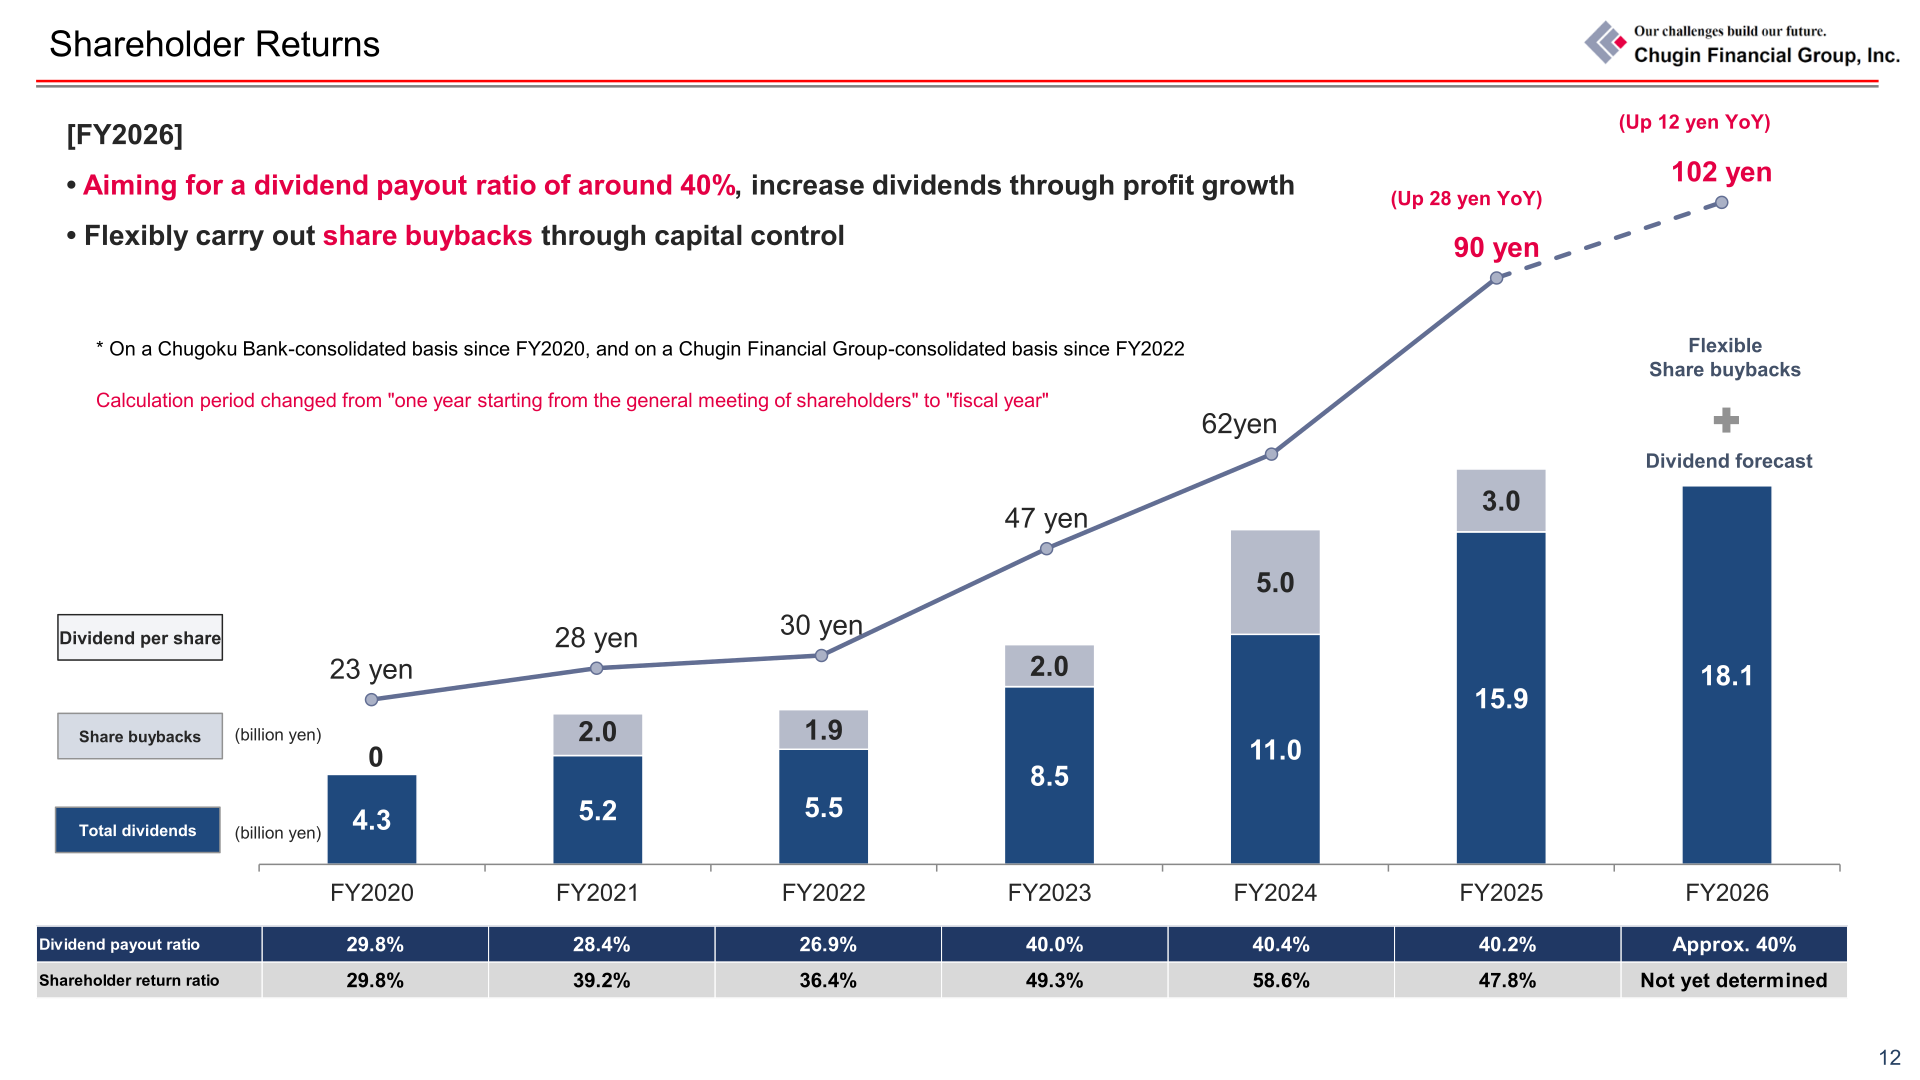
The dividend per share for FY2025 was 90 yen, up 28 yen year on year, with total dividends of 15.9 billion yen and share buybacks of 3.0 billion yen, giving a dividend payout ratio of 40.2% and a shareholder return ratio of 47.8%. For FY2026 the Group forecasts a dividend per share of 102 yen, up 12 yen year on year, aiming for a dividend payout ratio of around 40% and increasing dividends through profit growth, while flexibly carrying out share buybacks through capital control. The shareholder return ratio for FY2026 is not yet determined.
| Item | FY2024 | FY2025 | FY2026 |
|---|---|---|---|
| Dividend per share | 62yen | 90 yen | 102 yen |
| Total dividends (billion yen) | 11.0 | 15.9 | 18.1 |
| Share buybacks (billion yen) | 5.0 | 3.0 | Flexible |
| Dividend payout ratio | 40.4% | 40.2% | Approx. 40% |
| Shareholder return ratio | 58.6% | 47.8% | Not yet determined |
Medium-term Management Plan and Outlook
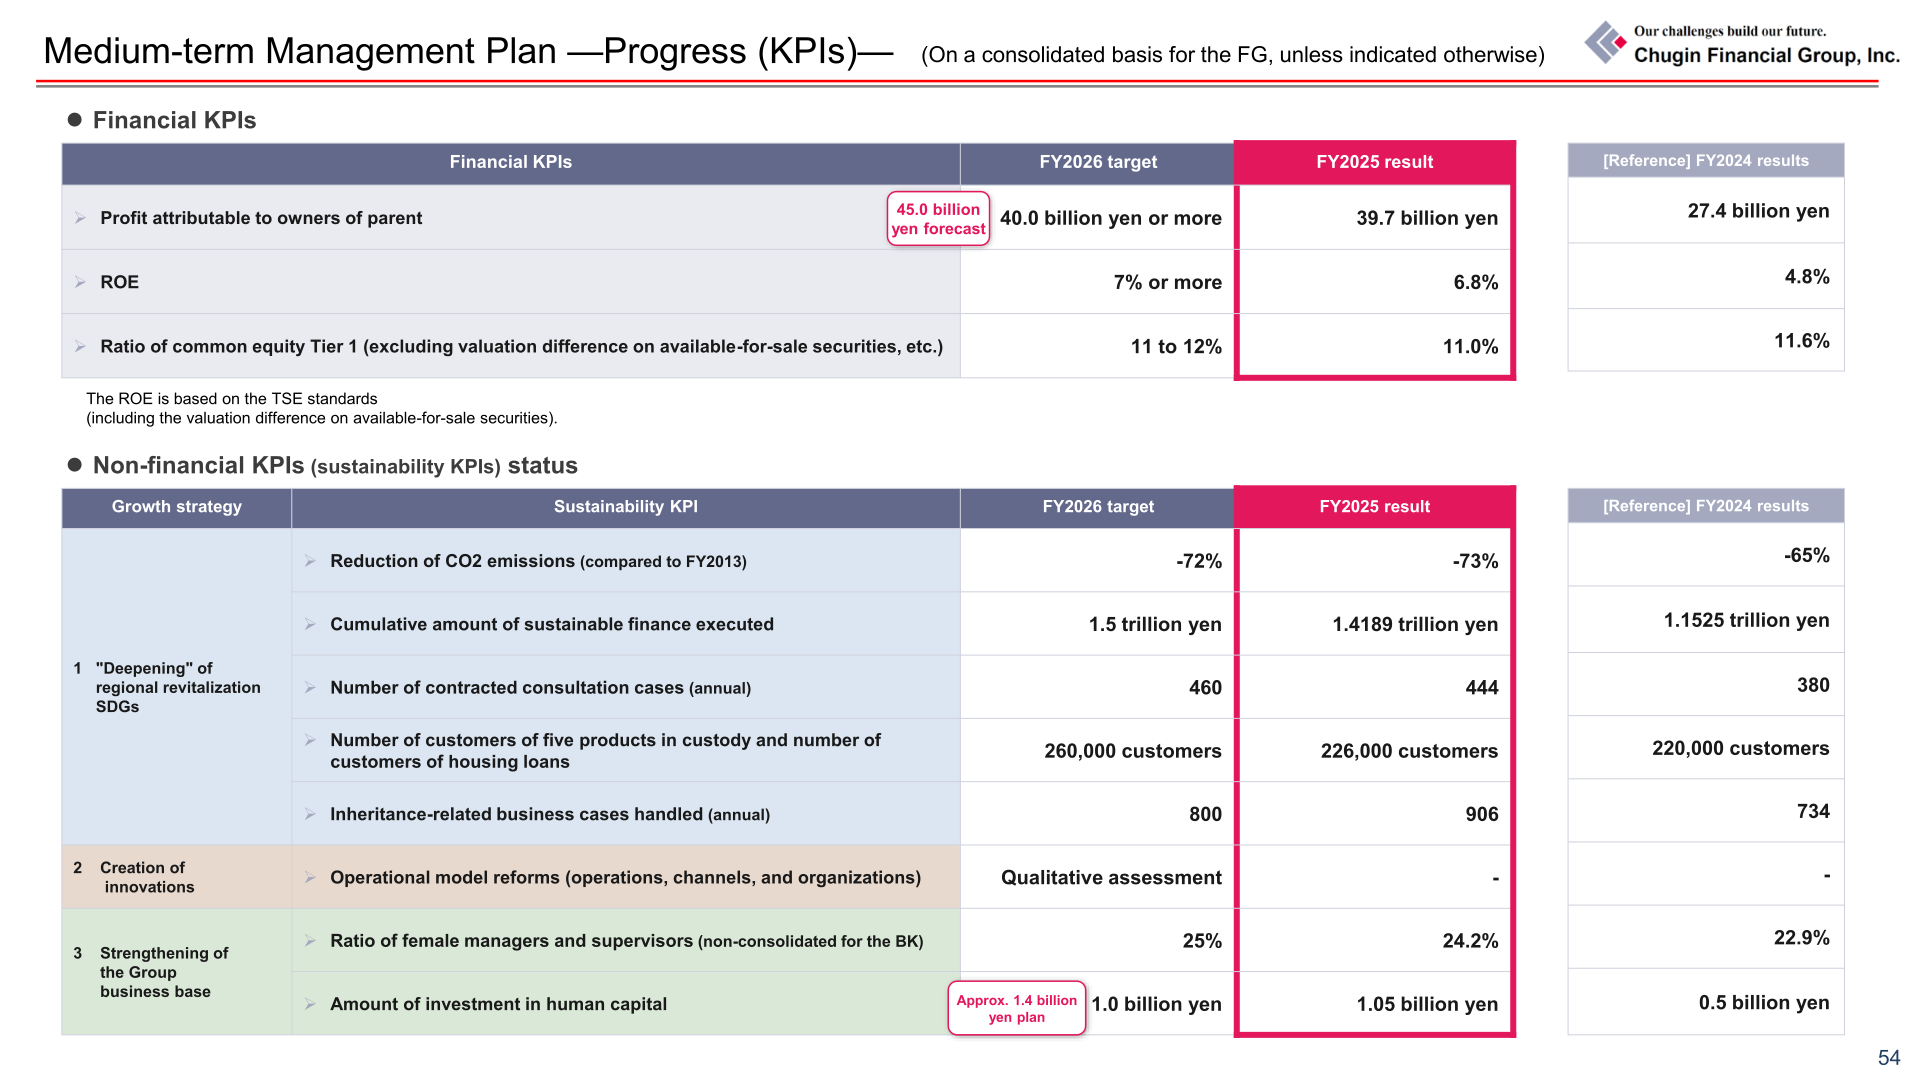
Against the FY2026 financial KPIs of the medium-term management plan “Future Co-Creation Plan Stage III” (April 2023 to March 2027) — profit attributable to owners of parent of 40.0 billion yen or more, ROE of 7% or more, and a common equity Tier 1 ratio (excluding the valuation difference on available-for-sale securities, etc.) of 11 to 12% — the FY2025 results were 39.7 billion yen, 6.8% and 11.0% respectively. Among the sustainability KPIs, the cumulative amount of sustainable finance executed reached 1.4189 trillion yen against a FY2026 target of 1.5 trillion yen, CO2 emissions were reduced 73% compared with FY2013 against a target of -72%, and inheritance-related business cases handled were 906 against a target of 800. The ratio of female managers and supervisors at the Bank was 24.2% against a 25% target, and investment in human capital was 1.05 billion yen against a 1.0 billion yen target.
The company has begun considering its next medium-term management plan covering FY2027 to FY2030, with a target profit level of 80 billion yen or more for profit attributable to owners of parent and ROE of 10% or more, and states that early achievement of an ROE of at least 10% is under consideration. On the enhancement of ROE, FY2025 metrics disclosed were financial leverage of 8.2 times, RORA of 0.83%, PER of 11.6 times and PBR of 0.79 times, with the company presenting a cost of capital of around 9% on a calculated basis from PBR/ROE results and around 6-7% on a CAPM-estimated basis.
This article is an analysis based on publicly available information and is not a recommendation to buy or sell any specific securities. Investment decisions are your own responsibility.
![[Obayashi] Investors’ Guide 2026 — The Complete 24-Article Breakdown](https://japan-equity.com/wp-content/uploads/2026/07/hub_cover-1024x1024.png)
![[Obayashi] IR & SR Policy — Feeding Dialogue Back into Management](https://japan-equity.com/wp-content/uploads/2026/07/p32_sq-1024x1024.jpg)
![[Obayashi] Real Estate Development — 18.7% Margin, ¥287.7bn Unrealized Gains](https://japan-equity.com/wp-content/uploads/2026/07/p20_sq-1024x1024.jpg)
![[Obayashi] Domestic Civil Engineering — Resilience Spending Supports 9.6% Margin](https://japan-equity.com/wp-content/uploads/2026/07/p11_sq-1024x1024.jpg)
![[Obayashi] Share Price & External Ratings — vs TOPIX, ESG Index Inclusion](https://japan-equity.com/wp-content/uploads/2026/07/p40_sq-1024x1024.jpg)
![[Construction] ¥75.5tn Investment, Shrinking Workforce — Big-5 Market Share](https://japan-equity.com/wp-content/uploads/2026/07/p12_sq-1024x1024.jpg)



![[Obayashi] Capital Policy & Shareholder Returns — ROE 10%+, DOE ~5%, ¥100bn Buyback](https://japan-equity.com/wp-content/uploads/2026/07/p27_sq-1024x1024.jpg)
![[Obayashi] Reducing Cross-Shareholdings — ¥285.2bn Sold in Five Years](https://japan-equity.com/wp-content/uploads/2026/07/p29_sq-1024x1024.jpg)
![[Obayashi] ¥750bn Investment Plan — ¥300bn to Development, ¥190bn to Tech/DX](https://japan-equity.com/wp-content/uploads/2026/07/p30_sq-1024x1024.jpg)
![[Obayashi] MTP2022 KPIs — Operating Profit ~2x Target, ROE 14.4%](https://japan-equity.com/wp-content/uploads/2026/07/p25_sq-1024x1024.jpg)
![[Obayashi] Cash Allocation — ¥420bn Investment CF Over Five Years](https://japan-equity.com/wp-content/uploads/2026/07/p26_sq-1024x1024.jpg)
![[Obayashi] Green Energy — 44 Plants, 344MW, and the Green Hydrogen Challenge](https://japan-equity.com/wp-content/uploads/2026/07/p21_sq-1024x1024.jpg)
![[Obayashi] Tackling the Labor Shortage — Robotics Construction®](https://japan-equity.com/wp-content/uploads/2026/07/p14_sq-1024x1024.jpg)
