
This article is based on publicly available IR materials and is not a recommendation to buy or sell any specific securities.
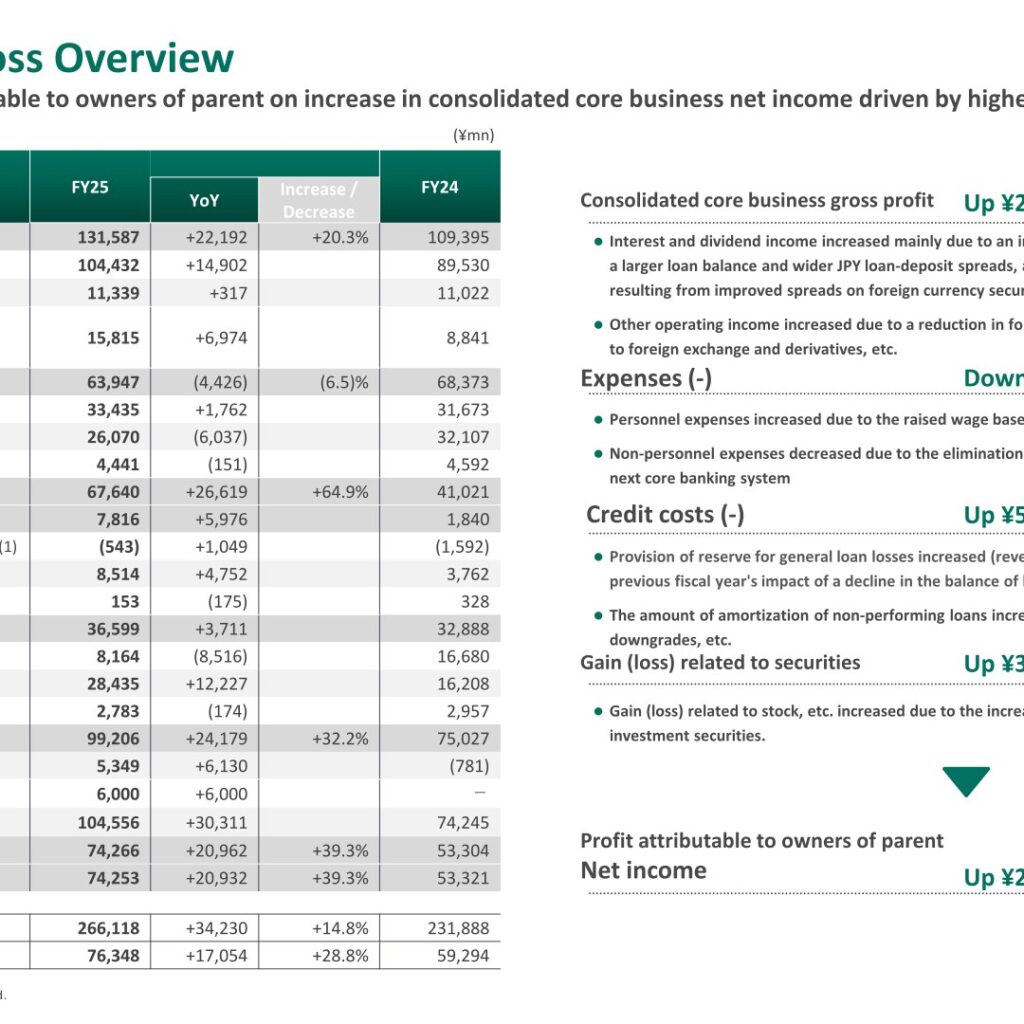
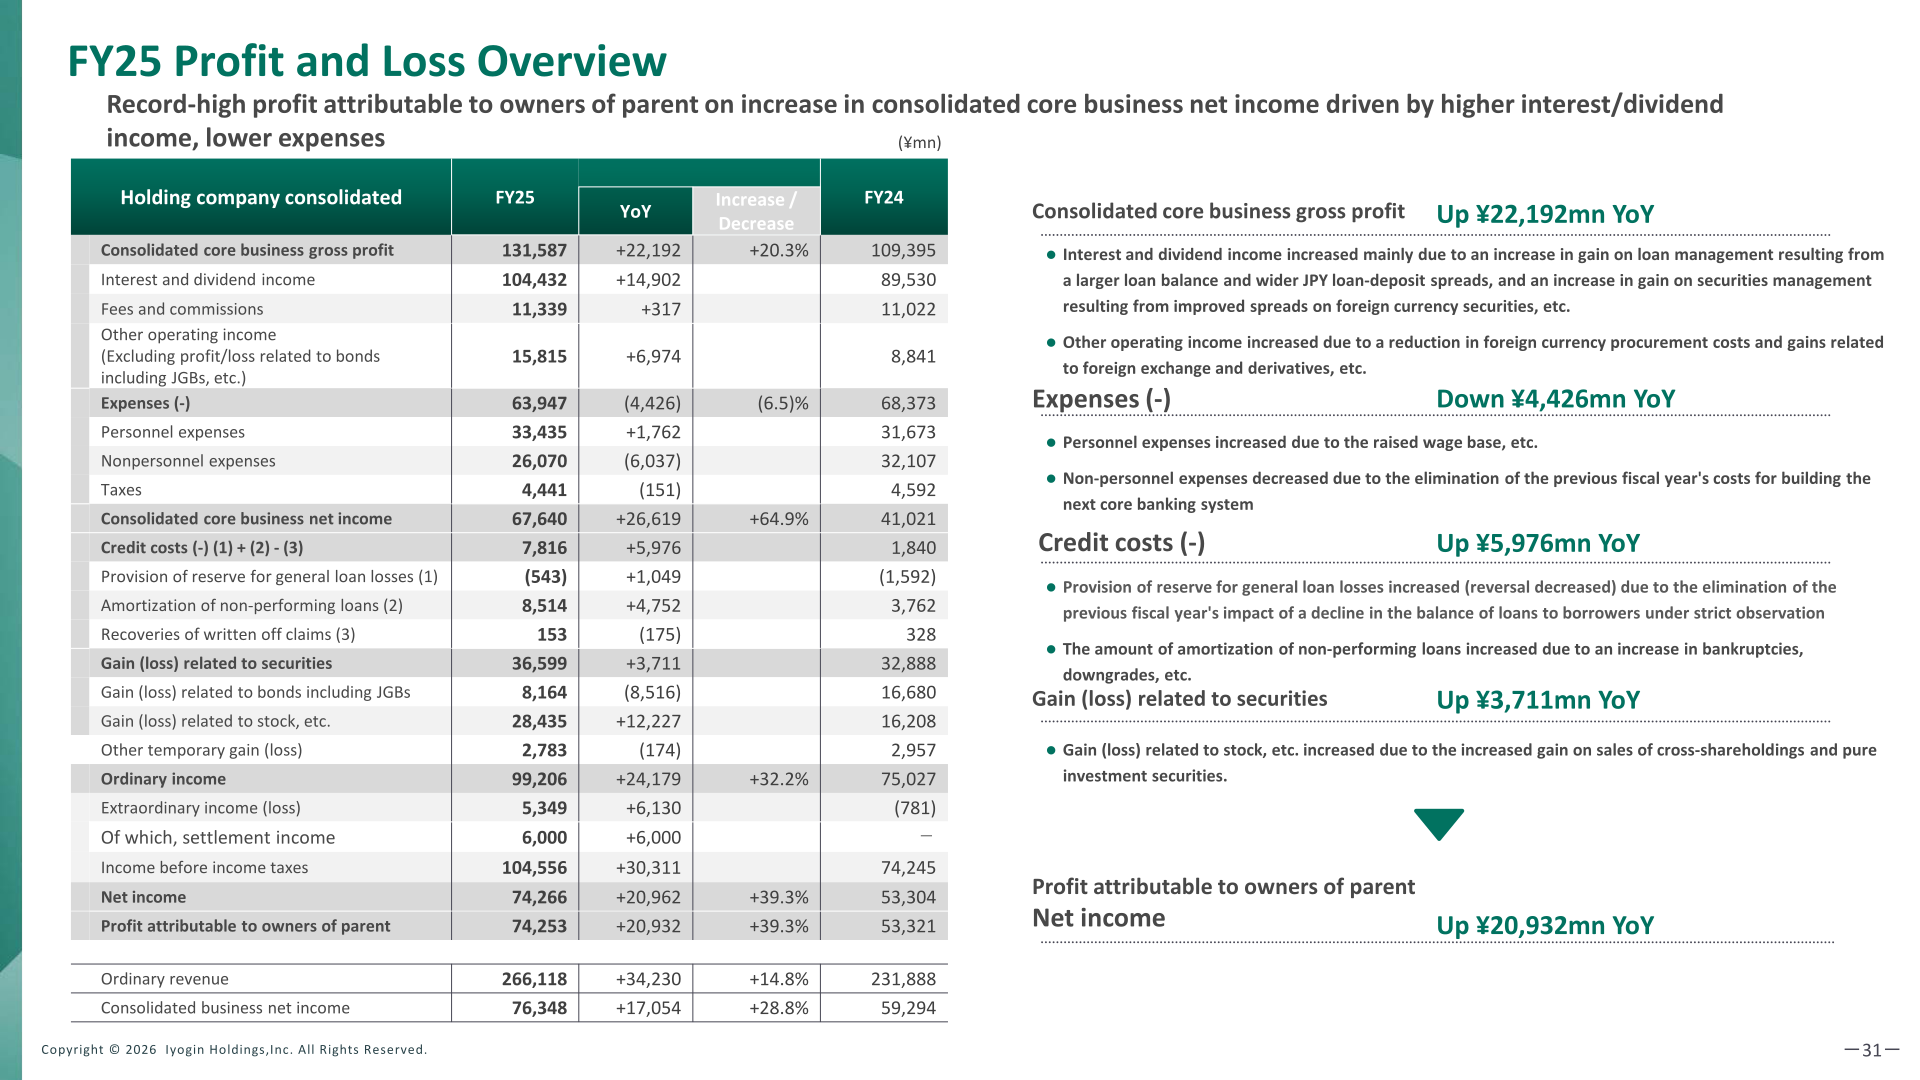
Iyogin Holdings, Inc. reported record-high earnings for fiscal 2025. Profit attributable to owners of parent came to ¥74,253mn, up ¥20,932mn or 39.3% year on year, marking the fifth consecutive fiscal year of higher net income. Consolidated core business gross profit rose 20.3% to ¥131,587mn on higher interest and dividend income, while expenses fell 6.5% to ¥63,947mn following the elimination of the previous fiscal year’s costs for building the next core banking system. For fiscal 2026 the company forecasts profit attributable to owners of parent of ¥77.0bn.
Consolidated Results (Full-Year Actual)
Consolidated core business net income increased 64.9% to ¥67,640mn, driven by a ¥14,902mn rise in interest and dividend income. The company attributes this to an increase in gain on loan management resulting from a larger loan balance and wider JPY loan-deposit spreads, and to an increase in gain on securities management resulting from improved spreads on foreign currency securities. Other operating income rose ¥6,974mn on a reduction in foreign currency procurement costs and gains related to foreign exchange and derivatives. Credit costs increased ¥5,976mn to ¥7,816mn, as the provision of reserve for general loan losses rose (reversal decreased) and the amount of amortization of non-performing loans increased due to bankruptcies and downgrades. Extraordinary income (loss) turned positive at ¥5,349mn, of which ¥6,000mn was settlement income.
| Item (¥mn, holding company consolidated) | FY25 | YoY | FY24 |
|---|---|---|---|
| Consolidated core business gross profit | 131,587 | +22,192 (+20.3%) | 109,395 |
| Interest and dividend income | 104,432 | +14,902 | 89,530 |
| Fees and commissions | 11,339 | +317 | 11,022 |
| Other operating income (excluding profit/loss related to bonds including JGBs, etc.) | 15,815 | +6,974 | 8,841 |
| Expenses (-) | 63,947 | (4,426) ((6.5)%) | 68,373 |
| Personnel expenses | 33,435 | +1,762 | 31,673 |
| Nonpersonnel expenses | 26,070 | (6,037) | 32,107 |
| Consolidated core business net income | 67,640 | +26,619 (+64.9%) | 41,021 |
| Credit costs (-) | 7,816 | +5,976 | 1,840 |
| Gain (loss) related to securities | 36,599 | +3,711 | 32,888 |
| Gain (loss) related to bonds including JGBs | 8,164 | (8,516) | 16,680 |
| Gain (loss) related to stock, etc. | 28,435 | +12,227 | 16,208 |
| Ordinary income | 99,206 | +24,179 (+32.2%) | 75,027 |
| Extraordinary income (loss) | 5,349 | +6,130 | (781) |
| Income before income taxes | 104,556 | +30,311 | 74,245 |
| Net income | 74,266 | +20,962 (+39.3%) | 53,304 |
| Profit attributable to owners of parent | 74,253 | +20,932 (+39.3%) | 53,321 |
| Ordinary revenue | 266,118 | +34,230 (+14.8%) | 231,888 |
| Consolidated business net income | 76,348 | +17,054 (+28.8%) | 59,294 |
Key management indicators moved in line with the plan. Consolidated ROE (TSE standard) improved to 8.83% from 6.48% in FY24, the consolidated core OHR improved to 48.5% from 62.5%, and EPS reached ¥253.9 against ¥178 in FY24. ROA rose to 0.78% from 0.58% in FY24, a level the company describes as among the highest of regional banks. Growth investment amounted to ¥3.5bn in FY25, including ¥2.0bn in funds established.
Profit and Loss of Major Group Companies
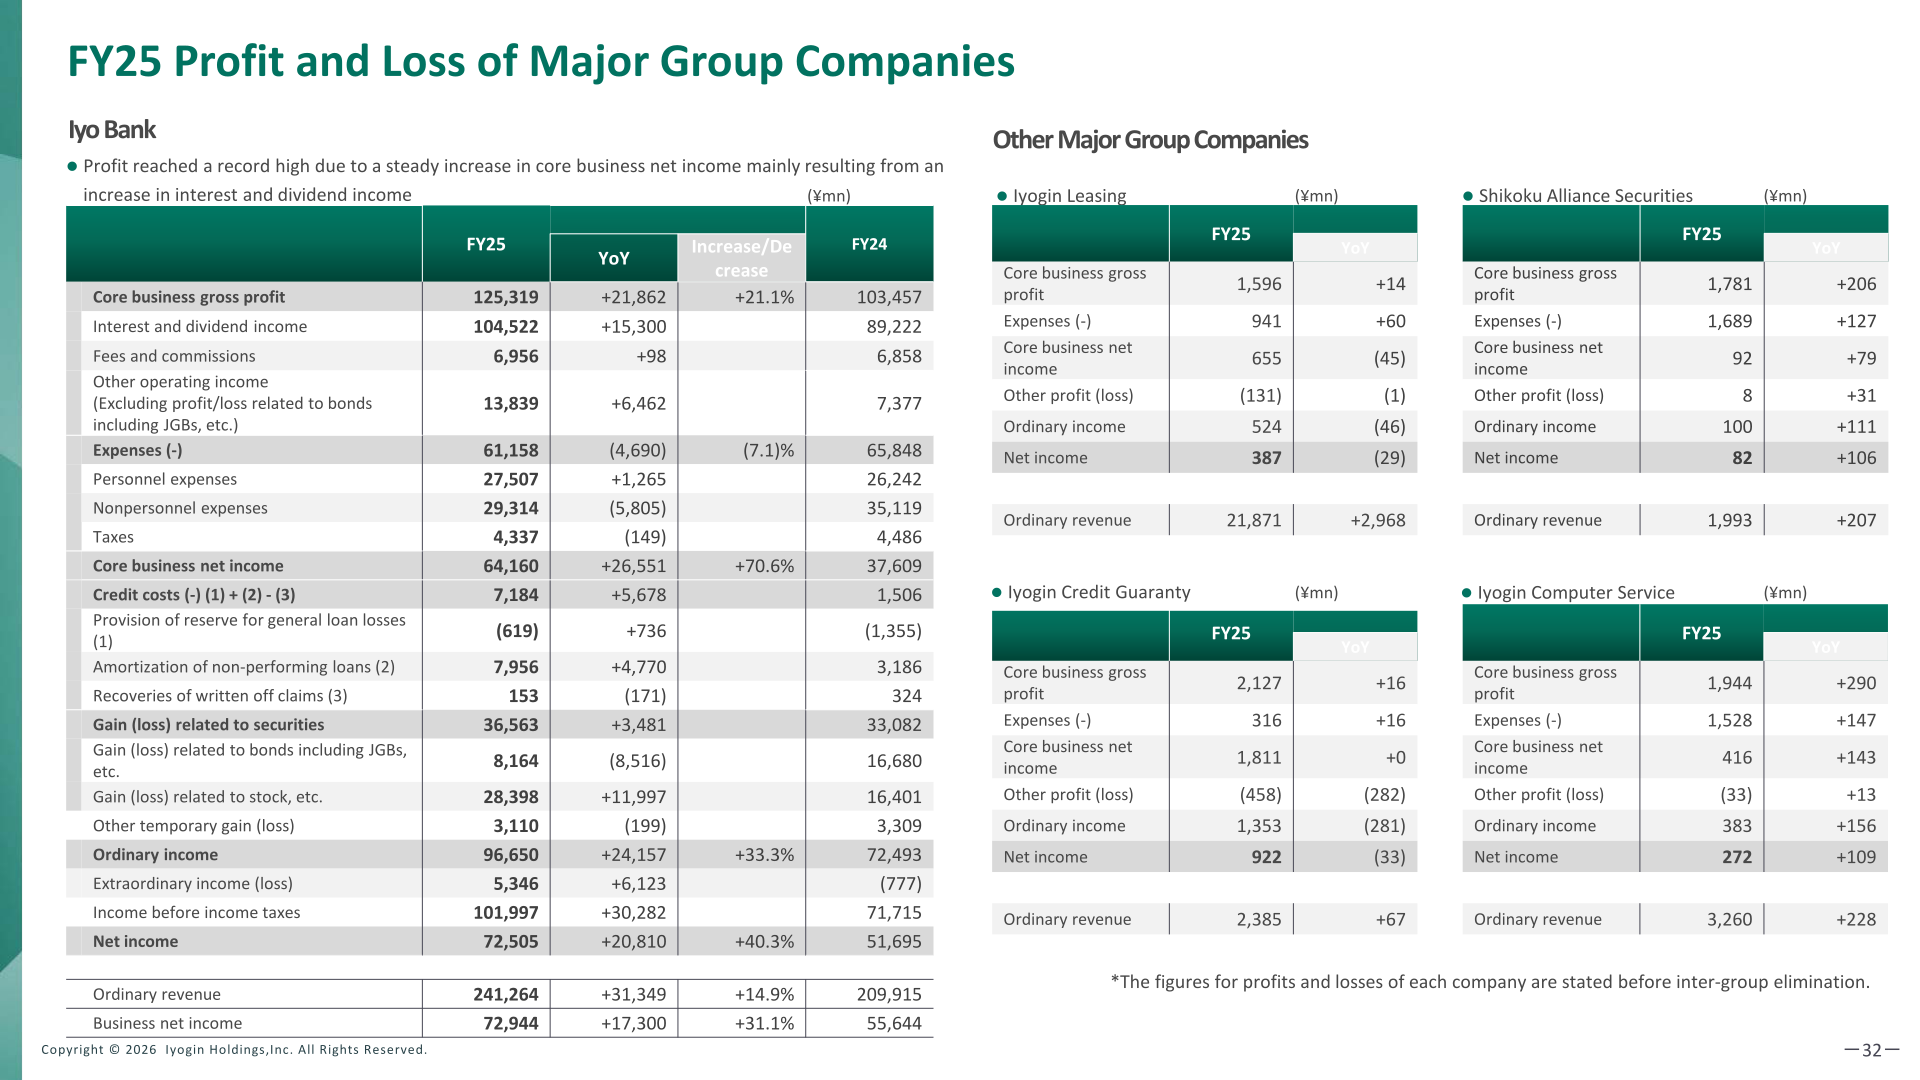
At Iyo Bank on a nonconsolidated basis, profit reached a record high on a steady increase in core business net income, mainly from an increase in interest and dividend income. Core business gross profit rose 21.1% to ¥125,319mn, expenses declined 7.1% to ¥61,158mn, core business net income rose 70.6% to ¥64,160mn, and net income rose 40.3% to ¥72,505mn. Figures for each group company are stated before inter-group elimination.
| Company (FY25, ¥mn) | Core business gross profit | Expenses (-) | Core business net income | Ordinary income | Net income | Ordinary revenue |
|---|---|---|---|---|---|---|
| Iyo Bank (nonconsolidated) | 125,319 | 61,158 | 64,160 | 96,650 | 72,505 | 241,264 |
| Iyogin Leasing | 1,596 | 941 | 655 | 524 | 387 | 21,871 |
| Shikoku Alliance Securities | 1,781 | 1,689 | 92 | 100 | 82 | 1,993 |
| Iyogin Credit Guaranty | 2,127 | 316 | 1,811 | 1,353 | 922 | 2,385 |
| Iyogin Computer Service | 1,944 | 1,528 | 416 | 383 | 272 | 3,260 |
Balances, Credit Costs and Soundness
Total loans stood at ¥6,164.4bn, up ¥284.4bn or 4.8% year on year, with loans within Ehime Prefecture at ¥3,114.1bn (up 6.3%) and loans in Tokyo and Nagoya at ¥855.6bn (up 1.5%). Deposits, etc. rose ¥165.3bn or 2.3% to ¥7,298.3bn, the 29th consecutive year of increase, and assets in custody rose 24.5% to ¥1,008.3bn, of which Iyo Bank accounted for ¥520.8bn and Shikoku Alliance Securities for ¥487.5bn. Total credit costs were ¥7.8bn against ¥1.8bn in FY24, and total disclosed non-performing loans under the Financial Reconstruction Act rose ¥7.2bn to ¥102.0bn, lifting the ratio of disclosed non-performing loans to 1.58% from 1.54%. Valuation gain on securities was ¥293.0bn and the gross equity ratio was 15.53%, while the consolidated CET1 ratio on a fully loaded Basel III basis was 14.97%, up from 14.17% in FY24.
FY2026 Forecast
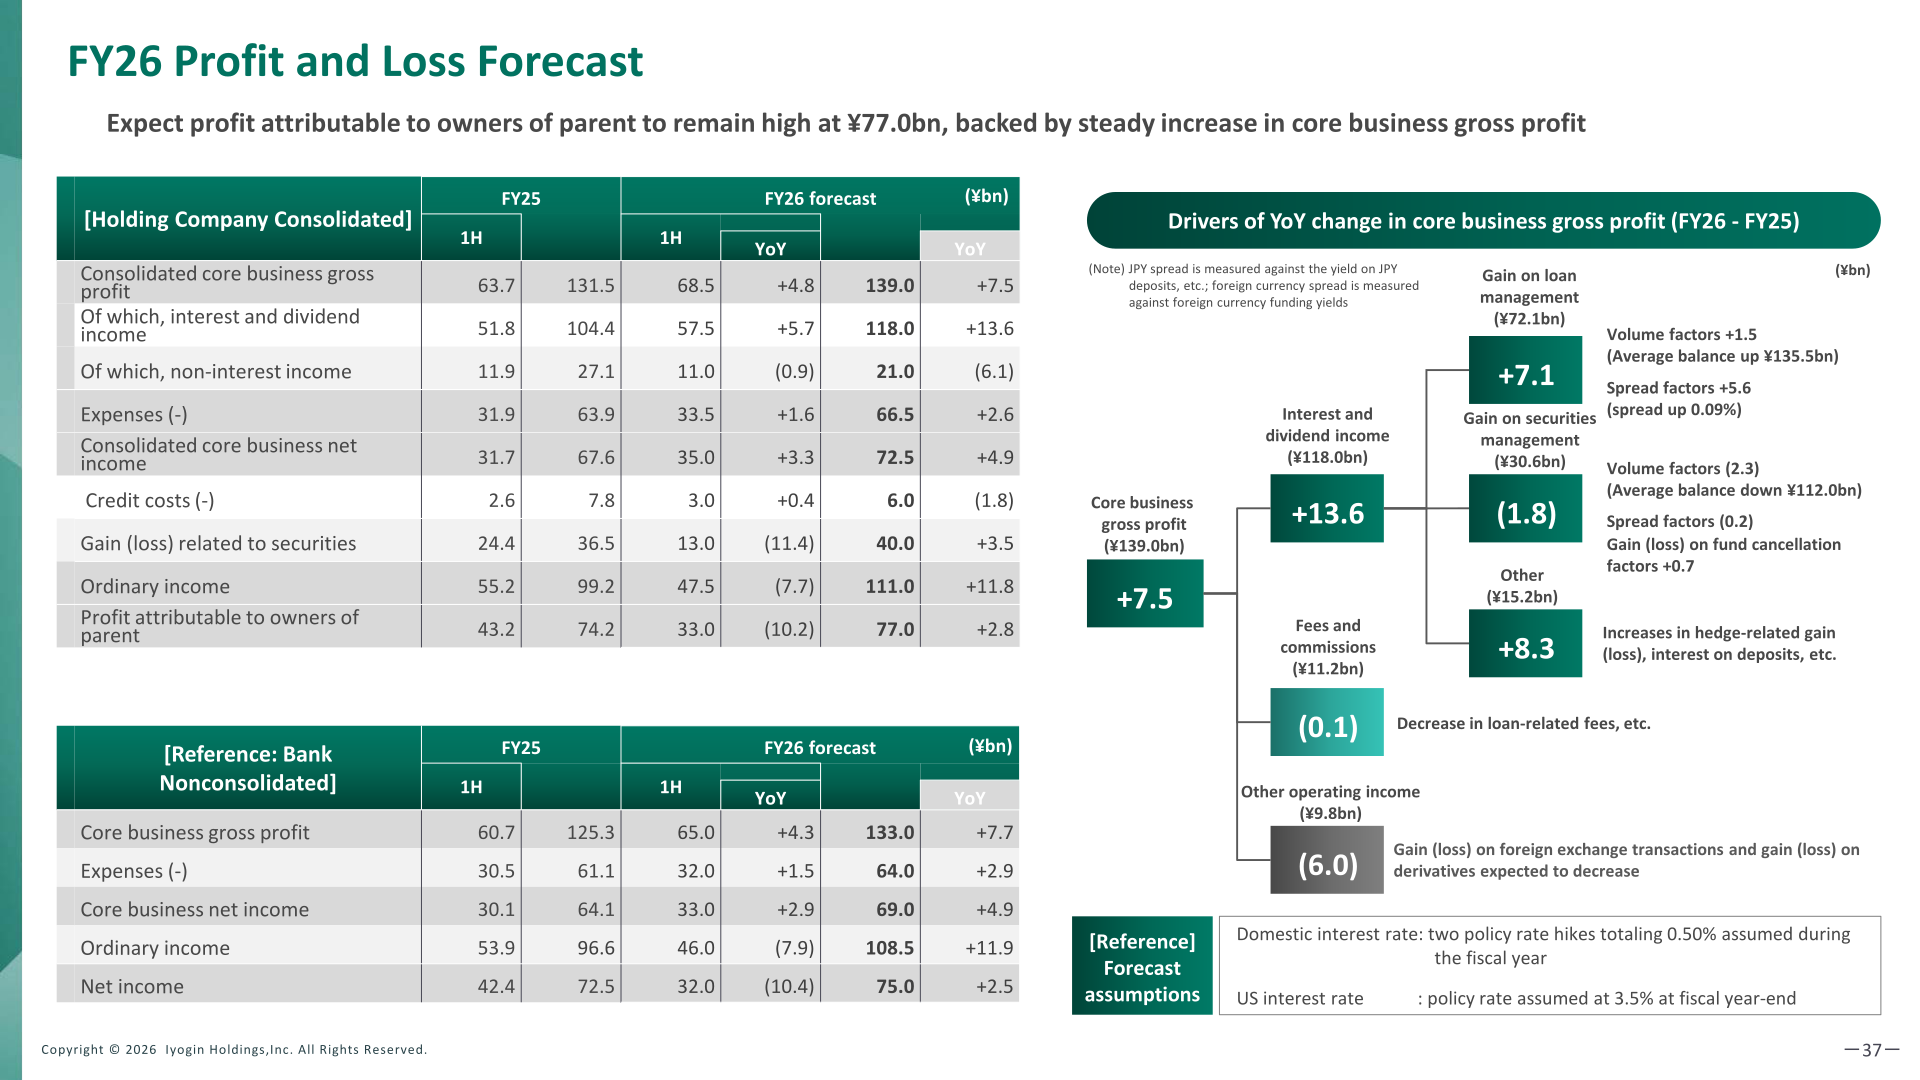
For fiscal 2026 the company expects profit attributable to owners of parent to remain high at ¥77.0bn, backed by a steady increase in core business gross profit. Interest and dividend income is projected to rise ¥13.6bn to ¥118.0bn, while non-interest income is expected to decline ¥6.1bn to ¥21.0bn. Forecast assumptions are two policy rate hikes totaling 0.50% during the fiscal year for domestic interest rates, and a US policy rate of 3.5% at fiscal year-end. On a bank nonconsolidated basis, core business gross profit is forecast at ¥133.0bn, core business net income at ¥69.0bn, ordinary income at ¥108.5bn and net income at ¥75.0bn.
| Item (¥bn, holding company consolidated) | FY26 Forecast | YoY | FY25 (Actual) |
|---|---|---|---|
| Consolidated core business gross profit | 139.0 | +7.5 | 131.5 |
| Of which, interest and dividend income | 118.0 | +13.6 | 104.4 |
| Of which, non-interest income | 21.0 | (6.1) | 27.1 |
| Expenses (-) | 66.5 | +2.6 | 63.9 |
| Consolidated core business net income | 72.5 | +4.9 | 67.6 |
| Credit costs (-) | 6.0 | (1.8) | 7.8 |
| Gain (loss) related to securities | 40.0 | +3.5 | 36.5 |
| Ordinary income | 111.0 | +11.8 | 99.2 |
| Profit attributable to owners of parent | 77.0 | +2.8 | 74.2 |
Shareholder Returns
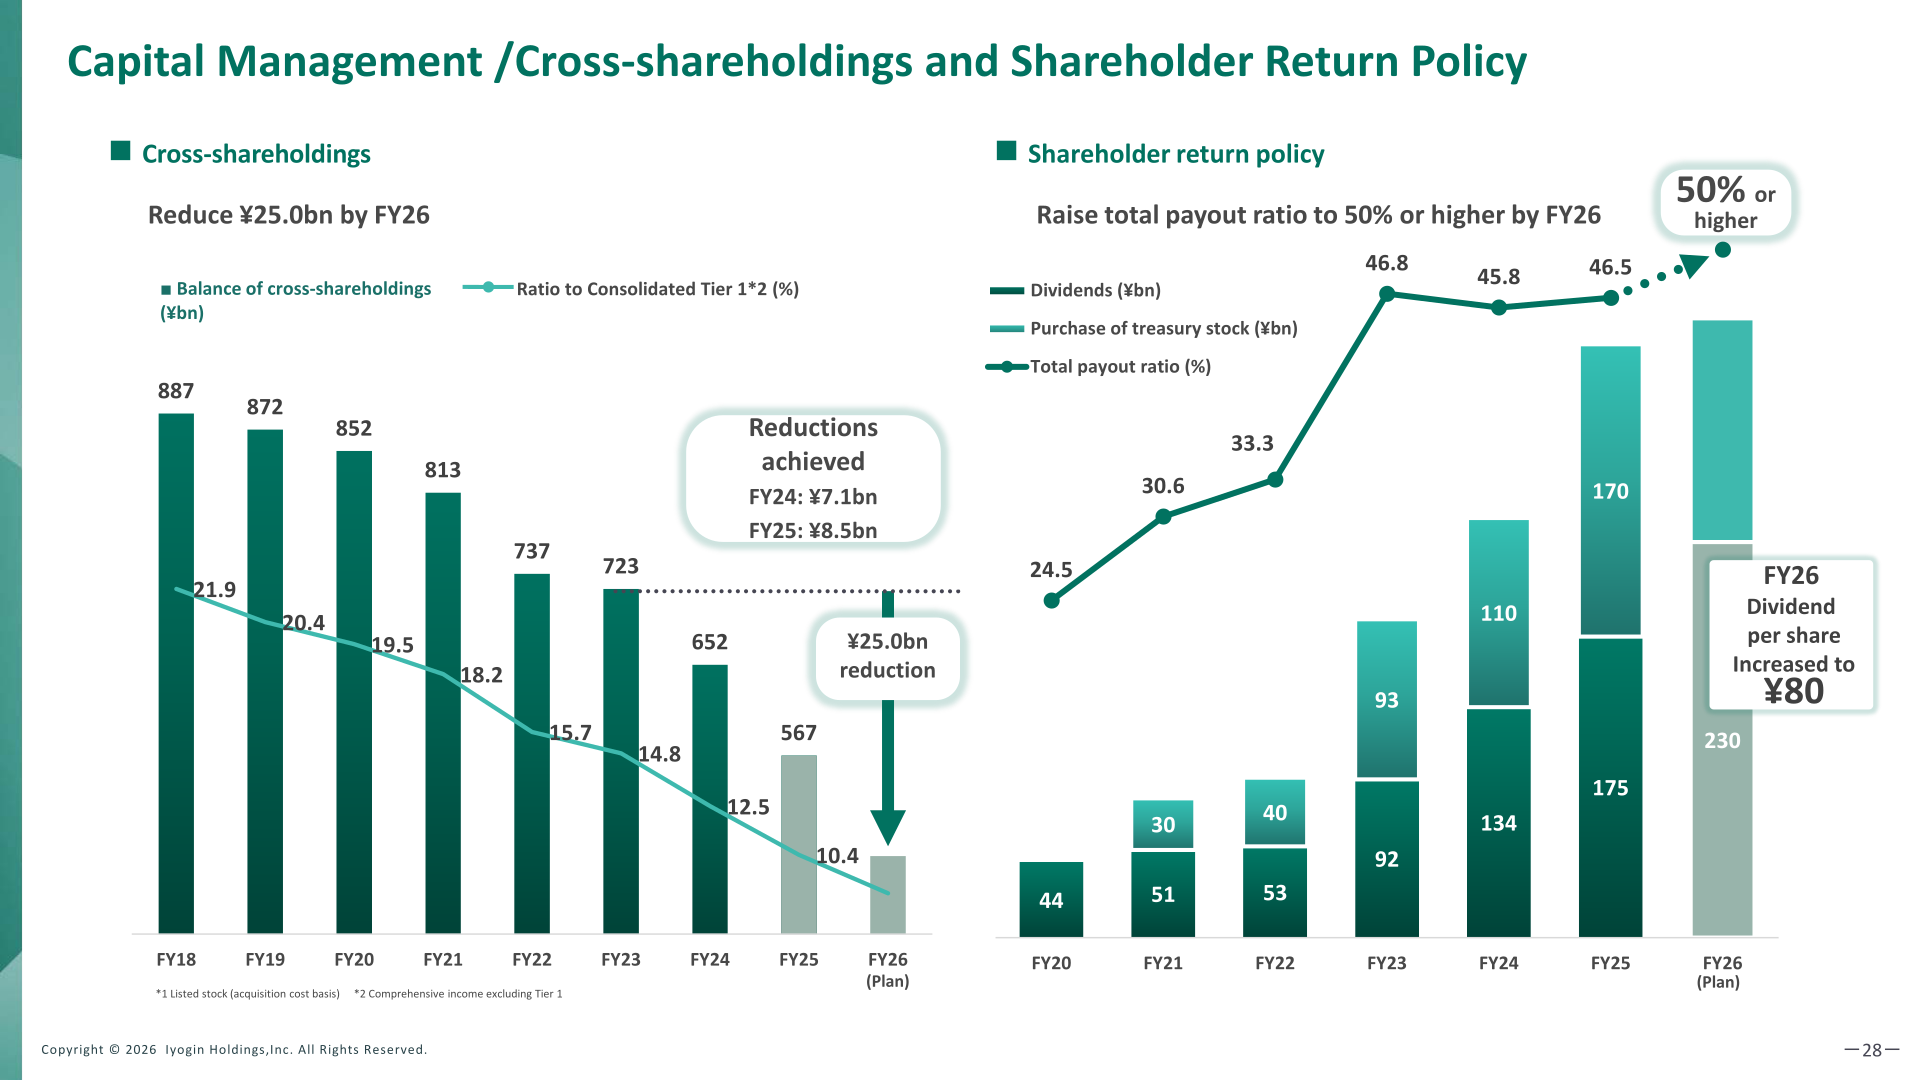
The dividend per share for FY25 was raised to ¥60 a year, up ¥15 from FY24, and the company plans ¥80 a year for FY26. Treasury stock purchases totaled ¥17.0bn in FY25. The total payout ratio was 46.5% in FY25 against 45.8% in FY24, and the shareholder return policy is to raise the total payout ratio to 50% or higher by FY26. Cross-shareholdings were reduced by ¥8.5bn on an acquisition cost basis in FY25 following a ¥7.1bn reduction in FY24, against a target of a ¥25.0bn reduction by FY26.
| Item | FY24 | FY25 | FY26 |
|---|---|---|---|
| Dividend per share (annual) | — | ¥60 (up ¥15 YoY) | ¥80 (planned) |
| Purchase of treasury stock | — | ¥17.0bn | — |
| Total payout ratio | 45.8% | 46.5% | 50% or higher |
| Reduction of cross-shareholdings (acquisition cost basis) | ¥7.1bn | ¥8.5bn | Down ¥25.0bn (cumulative under the Medium-Term Management Plan) |
| Consolidated CET1 ratio (fully loaded Basel III basis) | 14.17% | 14.97% | Approx. 14.0% |
Medium-Term Management Plan and Topics
FY25 was covered by the Fiscal 2024 Medium-Term Management Plan, positioned as Phase 1 (building a foundation) of a plan sequence running through Fiscal 2030. FY26 targets were revised upward considering steady business progress and rising market interest rates: profit attributable to owners of parent to ¥77.0bn from ¥58.0bn before revision, consolidated ROE (TSE standard) to 8.5% or more from 7% before revision, and consolidated core OHR to approximately 48% from around 50% before revision. Growth investment of ¥10.0bn is planned for FY26.
On interest rates, the company estimates an accretive effect on profit of ¥5.0bn in FY26 and ¥21.0bn in the future under its main scenario, with an additional ¥11.0bn if interest rates rise more than expected. A 0.25% rate hike is expected to raise core business gross profit by approximately ¥6.0bn in a single fiscal year and to lower valuation gains on yen bonds by approximately ¥1.2bn after considering hedge effects. Around 60% of JPY loans are variable rate.
Business initiatives cited include the ship division, where Iyo Bank has the No. 1 loan balance among regional banks (No. 3 in Japan); the DHD model, under which the share of procedures via the AGENT app exceeded 50% as of March 31, 2026 and the number of registered accounts exceeded 280,000; and portfolio restructuring, under which 35 businesses were evaluated and classified into 16 businesses to be strengthened, 14 to be improved and 5 to be maintained. New business development includes the establishment of Ishizuchi Turnaround Servicer Co., Ltd., described as the first servicer headquartered in Shikoku, and the ¥2.0bn IHD STRATEGY FUND, whose investees are GEOFLA CORPORATION, ATOMica Inc. and JPYC Inc. As of the end of May 2026, P/B stood at 1.00x, with net assets per share of ¥3,046 and a May 29, 2026 closing price of ¥3,054.
This article is an analysis based on publicly available information and is not a recommendation to buy or sell any specific securities. Investment decisions are your own responsibility.
![[Obayashi] Investors’ Guide 2026 — The Complete 24-Article Breakdown](https://japan-equity.com/wp-content/uploads/2026/07/hub_cover-1024x1024.png)
![[Obayashi] IR & SR Policy — Feeding Dialogue Back into Management](https://japan-equity.com/wp-content/uploads/2026/07/p32_sq-1024x1024.jpg)
![[Obayashi] Real Estate Development — 18.7% Margin, ¥287.7bn Unrealized Gains](https://japan-equity.com/wp-content/uploads/2026/07/p20_sq-1024x1024.jpg)
![[Obayashi] Domestic Civil Engineering — Resilience Spending Supports 9.6% Margin](https://japan-equity.com/wp-content/uploads/2026/07/p11_sq-1024x1024.jpg)
![[Obayashi] Share Price & External Ratings — vs TOPIX, ESG Index Inclusion](https://japan-equity.com/wp-content/uploads/2026/07/p40_sq-1024x1024.jpg)
![[Construction] ¥75.5tn Investment, Shrinking Workforce — Big-5 Market Share](https://japan-equity.com/wp-content/uploads/2026/07/p12_sq-1024x1024.jpg)



![[Obayashi] Capital Policy & Shareholder Returns — ROE 10%+, DOE ~5%, ¥100bn Buyback](https://japan-equity.com/wp-content/uploads/2026/07/p27_sq-1024x1024.jpg)
![[Obayashi] Reducing Cross-Shareholdings — ¥285.2bn Sold in Five Years](https://japan-equity.com/wp-content/uploads/2026/07/p29_sq-1024x1024.jpg)
![[Obayashi] ¥750bn Investment Plan — ¥300bn to Development, ¥190bn to Tech/DX](https://japan-equity.com/wp-content/uploads/2026/07/p30_sq-1024x1024.jpg)
![[Obayashi] MTP2022 KPIs — Operating Profit ~2x Target, ROE 14.4%](https://japan-equity.com/wp-content/uploads/2026/07/p25_sq-1024x1024.jpg)
![[Obayashi] Cash Allocation — ¥420bn Investment CF Over Five Years](https://japan-equity.com/wp-content/uploads/2026/07/p26_sq-1024x1024.jpg)
![[Obayashi] Green Energy — 44 Plants, 344MW, and the Green Hydrogen Challenge](https://japan-equity.com/wp-content/uploads/2026/07/p21_sq-1024x1024.jpg)
![[Obayashi] Tackling the Labor Shortage — Robotics Construction®](https://japan-equity.com/wp-content/uploads/2026/07/p14_sq-1024x1024.jpg)
