
This article is based on publicly available IR materials and is not a recommendation to buy or sell any specific securities.
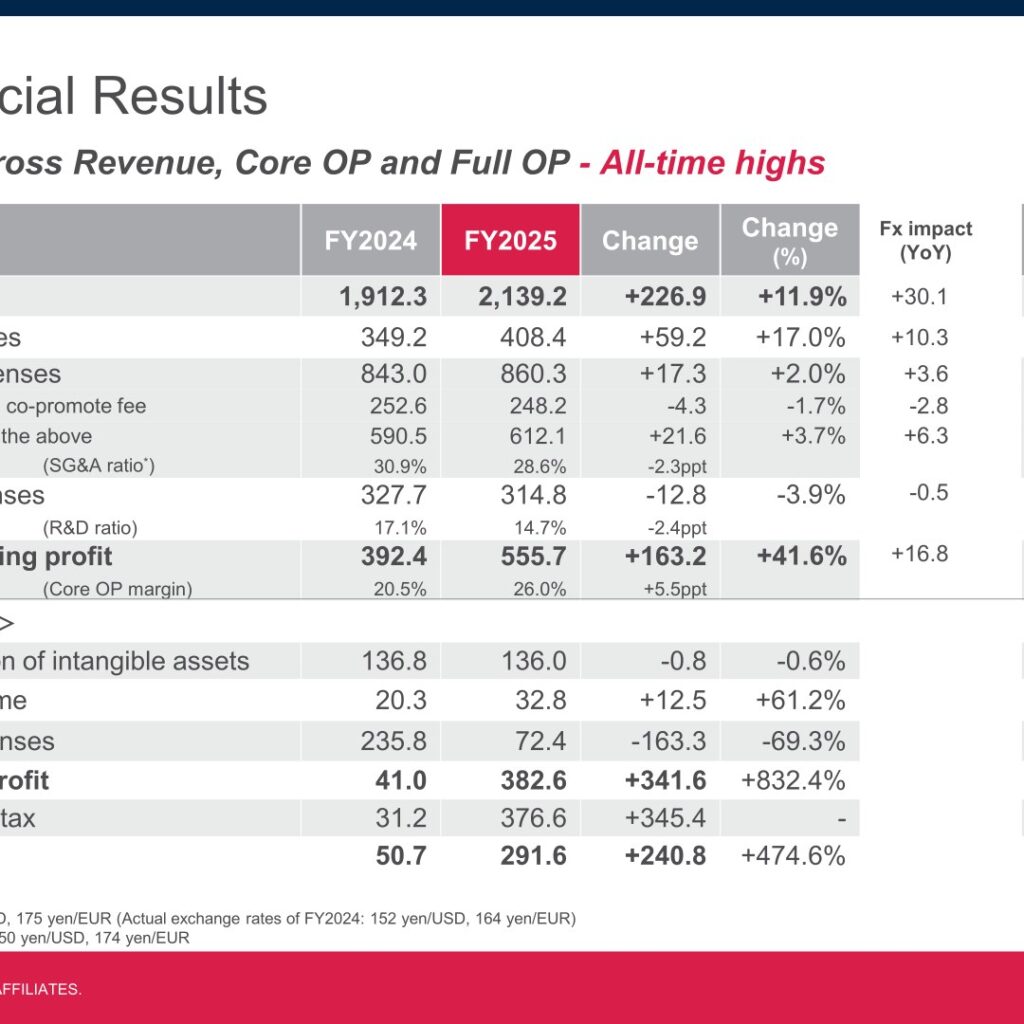
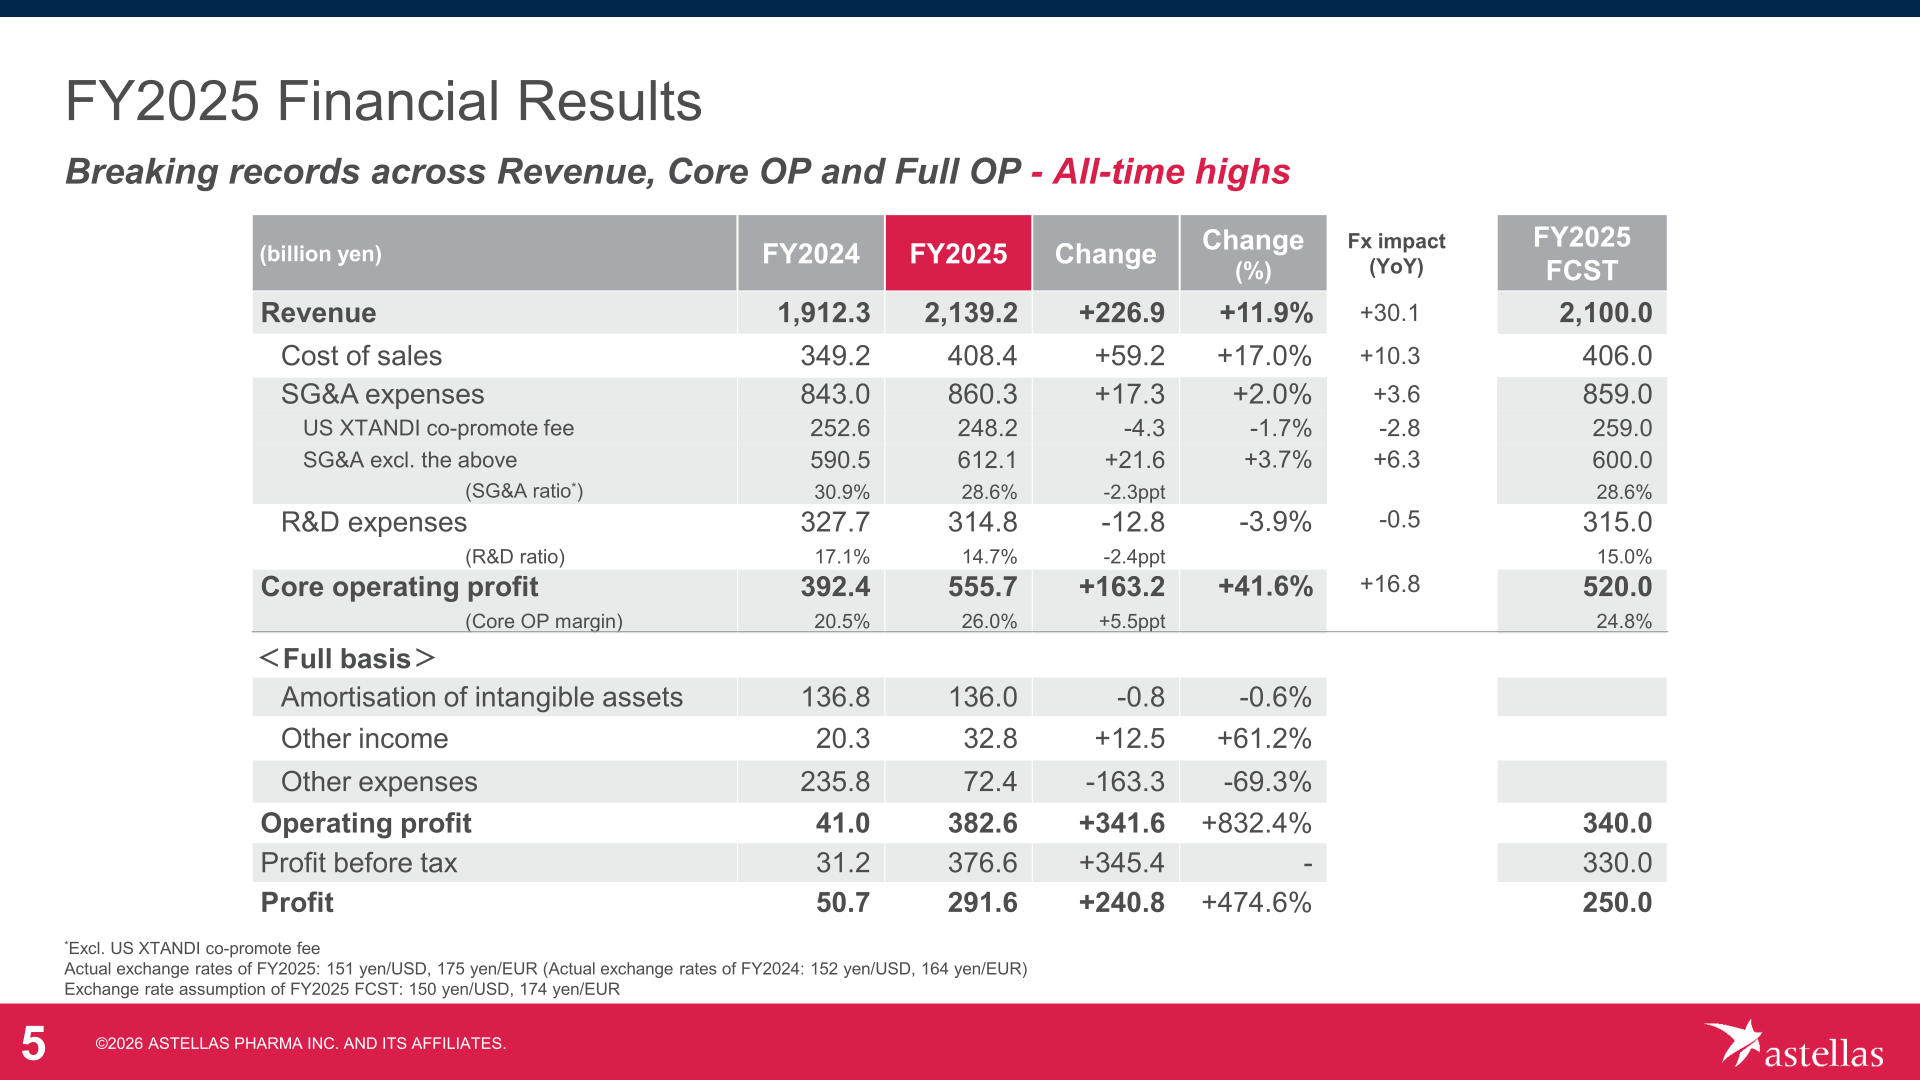
Astellas Pharma Inc. reported FY2025 consolidated results (Full basis) with revenue of 2,139.2 billion yen, up 11.9% year-on-year, and core operating profit of 555.7 billion yen, up 41.6% year-on-year — both record highs. Growth was driven by the company’s Strategic Brands (PADCEV, IZERVAY, VYLOY, VEOZAH, XOSPATA), which grew by over 140.0 billion yen year-on-year in total, together with robust progress in the Sustainable Margin Transformation (SMT) cost optimization program, which improved the SG&A ratio by 2.3 percentage points. Profit for the period was 291.6 billion yen, up 474.6% year-on-year. For FY2026, the company forecasts revenue of over 2.2 trillion yen (+4% YoY) and core operating profit of over 600.0 billion yen (+12% YoY), with core OP margin reaching 27.9%.
Consolidated Results (Full-Year Actual)
Actual average exchange rates for FY2025 were 151 yen/USD and 175 yen/EUR (versus 152 yen/USD and 164 yen/EUR in FY2024). Astellas states the exchange rate impact added 30.1 billion yen to revenue and 16.8 billion yen to core operating profit in FY2025. The FY2025 FCST column below shows the forecast figures previously disclosed by the company for comparison.
| Item (billion yen) | FY2025 Actual | FY2024 Actual | Change (YoY) | FY2025 Forecast (prior guidance) |
|---|---|---|---|---|
| Revenue | 2,139.2 | 1,912.3 | +226.9 (+11.9%) | 2,100.0 |
| Cost of sales | 408.4 | 349.2 | +59.2 (+17.0%) | 406.0 |
| SG&A expenses | 860.3 | 843.0 | +17.3 (+2.0%) | 859.0 |
| US XTANDI co-promote fee | 248.2 | 252.6 | -4.3 (-1.7%) | 259.0 |
| SG&A expenses excl. US XTANDI co-promote fee (SG&A ratio) | 612.1 (28.6%) | 590.5 (30.9%) | +21.6 (+3.7%); ratio -2.3ppt | 600.0 (28.6%) |
| R&D expenses (R&D ratio) | 314.8 (14.7%) | 327.7 (17.1%) | -12.8 (-3.9%); ratio -2.4ppt | 315.0 (15.0%) |
| Core operating profit (Core OP margin) | 555.7 (26.0%) | 392.4 (20.5%) | +163.2 (+41.6%); margin +5.5ppt | 520.0 (24.8%) |
| Amortisation of intangible assets | 136.0 | 136.8 | -0.8 (-0.6%) | – |
| Other income | 32.8 | 20.3 | +12.5 (+61.2%) | – |
| Other expenses | 72.4 | 235.8 | -163.3 (-69.3%) | – |
| Operating profit | 382.6 | 41.0 | +341.6 (+832.4%) | 340.0 |
| Profit before tax | 376.6 | 31.2 | +345.4 | 330.0 |
| Profit | 291.6 | 50.7 | +240.8 (+474.6%) | 250.0 |
Main Brand Performance
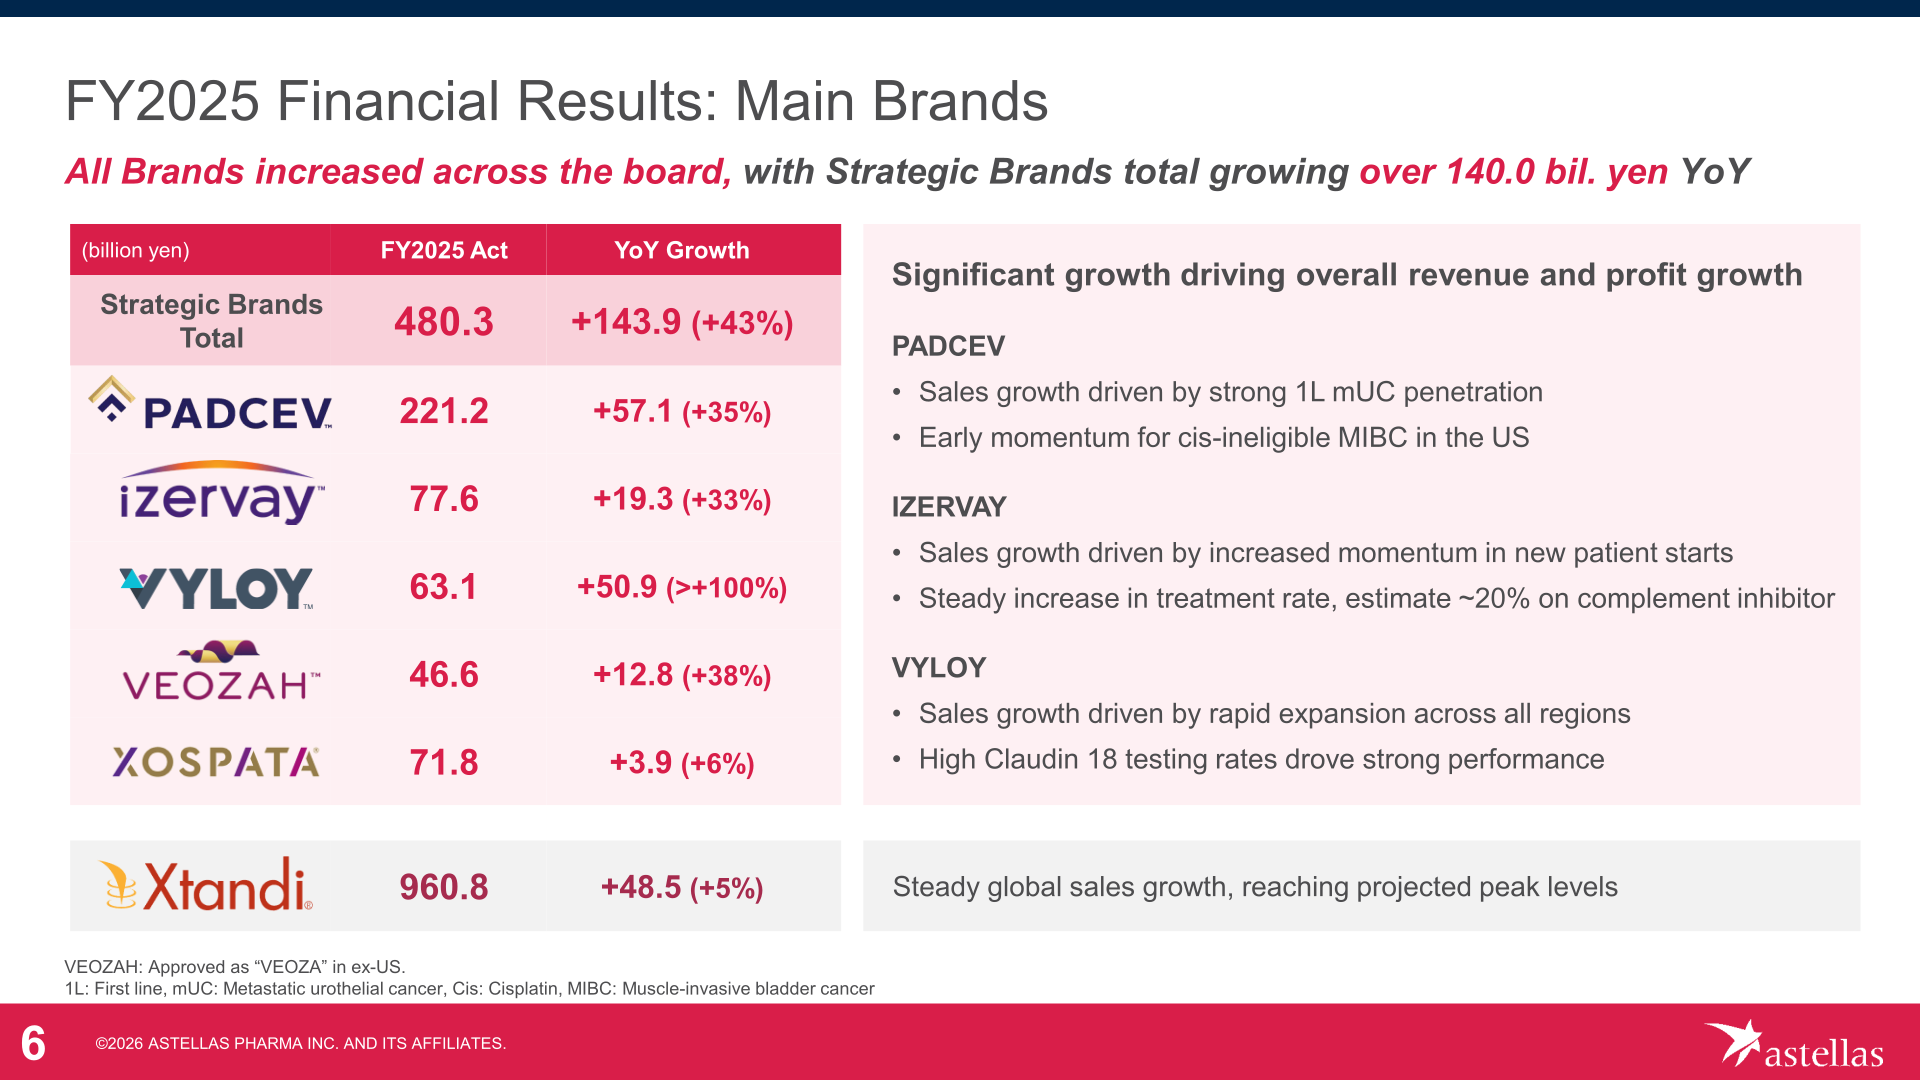
Astellas discloses results by main brand rather than by business segment. In FY2025, all main brands increased revenue. XTANDI (Total) generated 960.8 billion yen, up 48.5 billion yen (+5%) year-on-year. The Strategic Brands (PADCEV, IZERVAY, VYLOY, VEOZAH, XOSPATA) totaled 480.3 billion yen, up 143.9 billion yen (+43%) year-on-year. Per the source, sales growth for PADCEV was driven by strong first-line metastatic urothelial cancer (mUC) penetration and early momentum in cisplatin-ineligible muscle-invasive bladder cancer (MIBC) in the US; IZERVAY grew on increased momentum in new patient starts; and VYLOY grew on rapid expansion across all regions supported by high Claudin 18 testing rates.
| Brand | FY2025 Actual (billion yen) | YoY Change |
|---|---|---|
| XTANDI (Total) | 960.8 | +48.5 (+5%) |
| Strategic Brands (Total) | 480.3 | +143.9 (+43%) |
| PADCEV | 221.2 | +57.1 (+35%) |
| IZERVAY | 77.6 | +19.3 (+33%) |
| VYLOY | 63.1 | +50.9 (>+100%) |
| VEOZAH | 46.6 | +12.8 (+38%) |
| XOSPATA | 71.8 | +3.9 (+6%) |
FY2026 Forecast
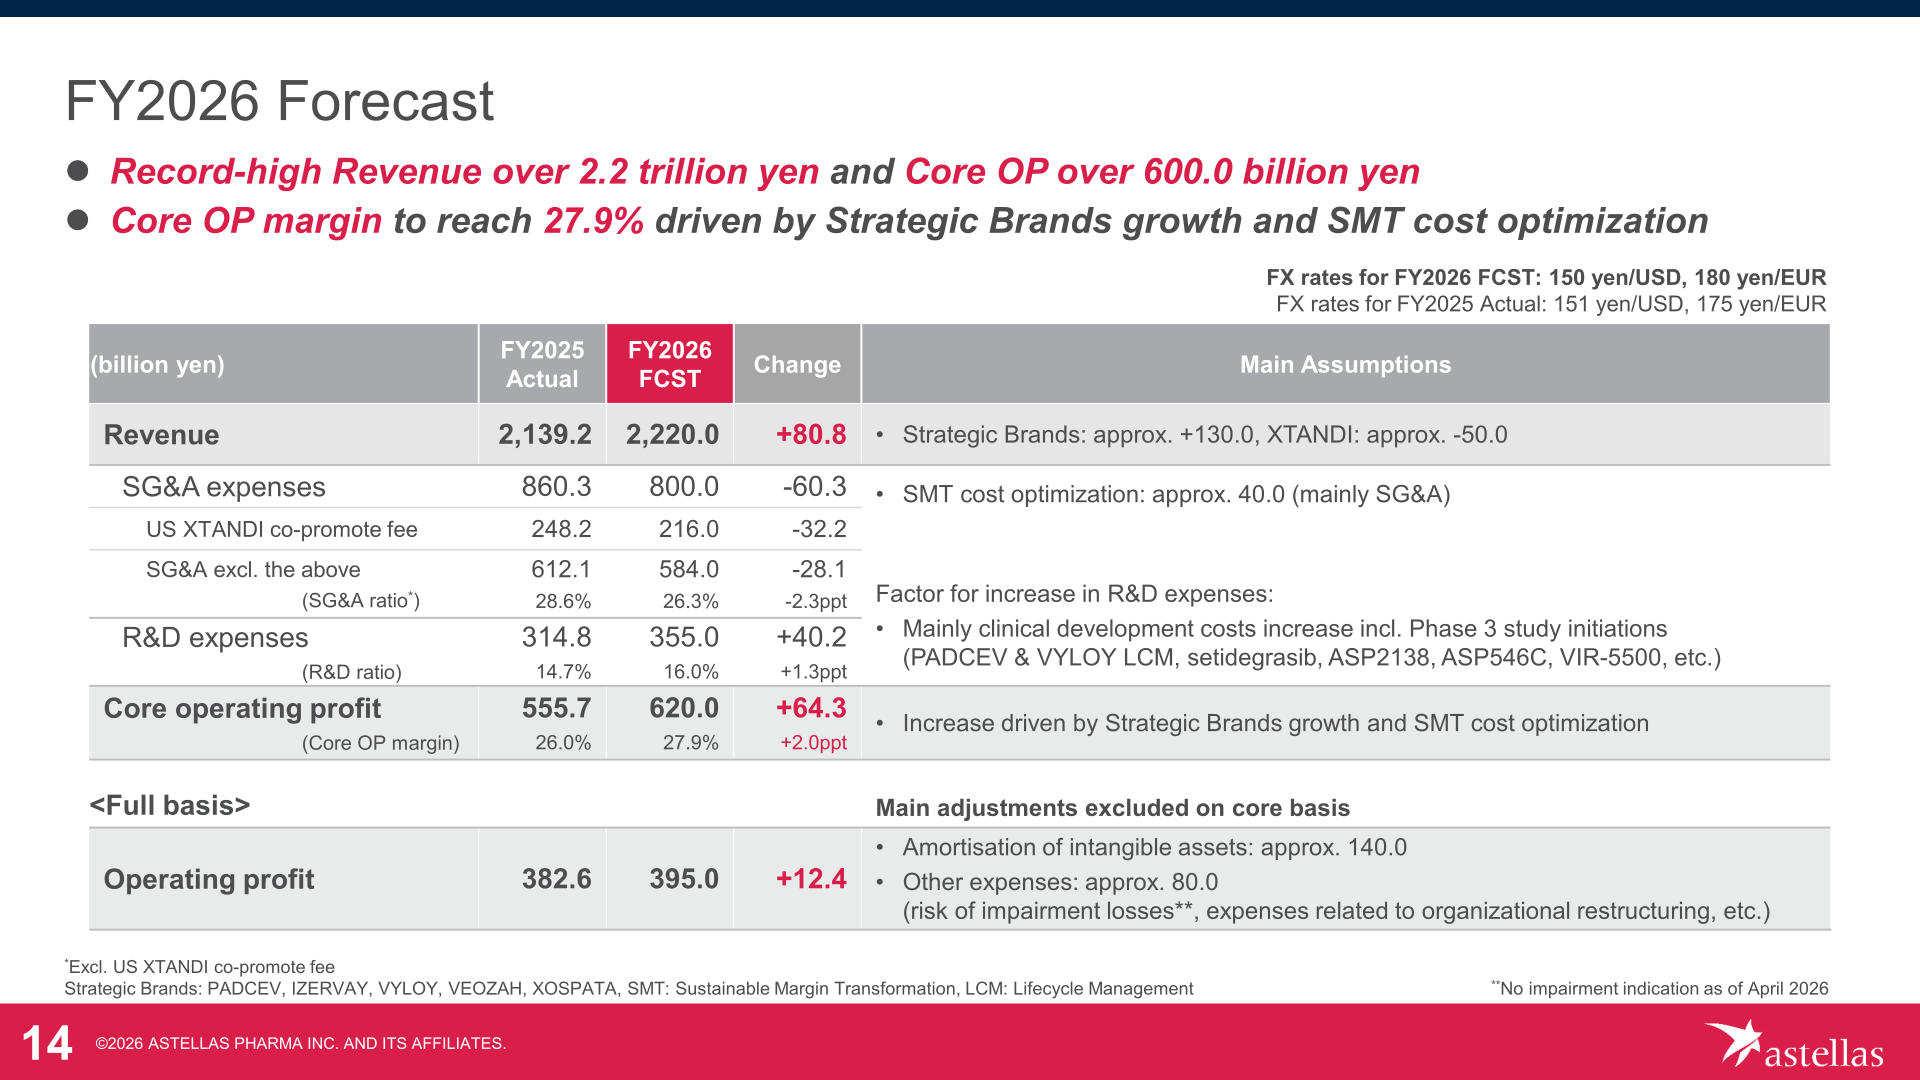
For FY2026, Astellas forecasts revenue of over 2.2 trillion yen (+4% YoY), driven by significant growth in Strategic Brands (+130.0 billion yen, +27% YoY), while continuing cost optimization through SMT (approximately 40.0 billion yen). Core operating profit is forecast at over 600.0 billion yen (+12% YoY), with core OP margin improving to 27.9% (+2.0ppt YoY). R&D expenses are expected to expand from FY2026 onward in line with Phase 3 study initiations. FX rate assumptions for the FY2026 forecast are 150 yen/USD and 180 yen/EUR (versus 151 yen/USD and 175 yen/EUR actual in FY2025).
| Item (billion yen) | FY2026 Forecast | FY2025 Actual | Change (YoY) | Main Assumptions (per source) |
|---|---|---|---|---|
| Revenue | 2,220.0 | 2,139.2 | +80.8 | Strategic Brands: approx. +130.0; XTANDI: approx. -50.0 |
| SG&A expenses | 800.0 | 860.3 | -60.3 | SMT cost optimization: approx. 40.0 (mainly SG&A) |
| US XTANDI co-promote fee | 216.0 | 248.2 | -32.2 | – |
| SG&A expenses excl. US XTANDI co-promote fee (SG&A ratio) | 584.0 (26.3%) | 612.1 (28.6%) | -28.1; ratio -2.3ppt | – |
| R&D expenses (R&D ratio) | 355.0 (16.0%) | 314.8 (14.7%) | +40.2; ratio +1.3ppt | Mainly clinical development cost increase incl. Phase 3 study initiations (PADCEV & VYLOY LCM, setidegrasib, ASP2138, ASP546C, VIR-5500, etc.) |
| Core operating profit (Core OP margin) | 620.0 (27.9%) | 555.7 (26.0%) | +64.3; margin +2.0ppt | Increase driven by Strategic Brands growth and SMT cost optimization |
| Operating profit (Full basis) | 395.0 | 382.6 | +12.4 | Amortisation of intangible assets: approx. 140.0; Other expenses: approx. 80.0 (risk of impairment losses, expenses related to organizational restructuring, etc.; no impairment indication as of April 2026) |
By brand, Strategic Brands (Total) are forecast to grow to 610.0 billion yen in FY2026, up 130.0 billion yen (+27%) from an FY2025 actual of approximately 480.0 billion yen, led by continued growth in PADCEV, IZERVAY and VYLOY. XTANDI (Total) is forecast to decline to 910.0 billion yen, which the company attributes primarily to the negative impact of the US Inflation Reduction Act (IRA), effective from January 2027.
Shareholder Returns
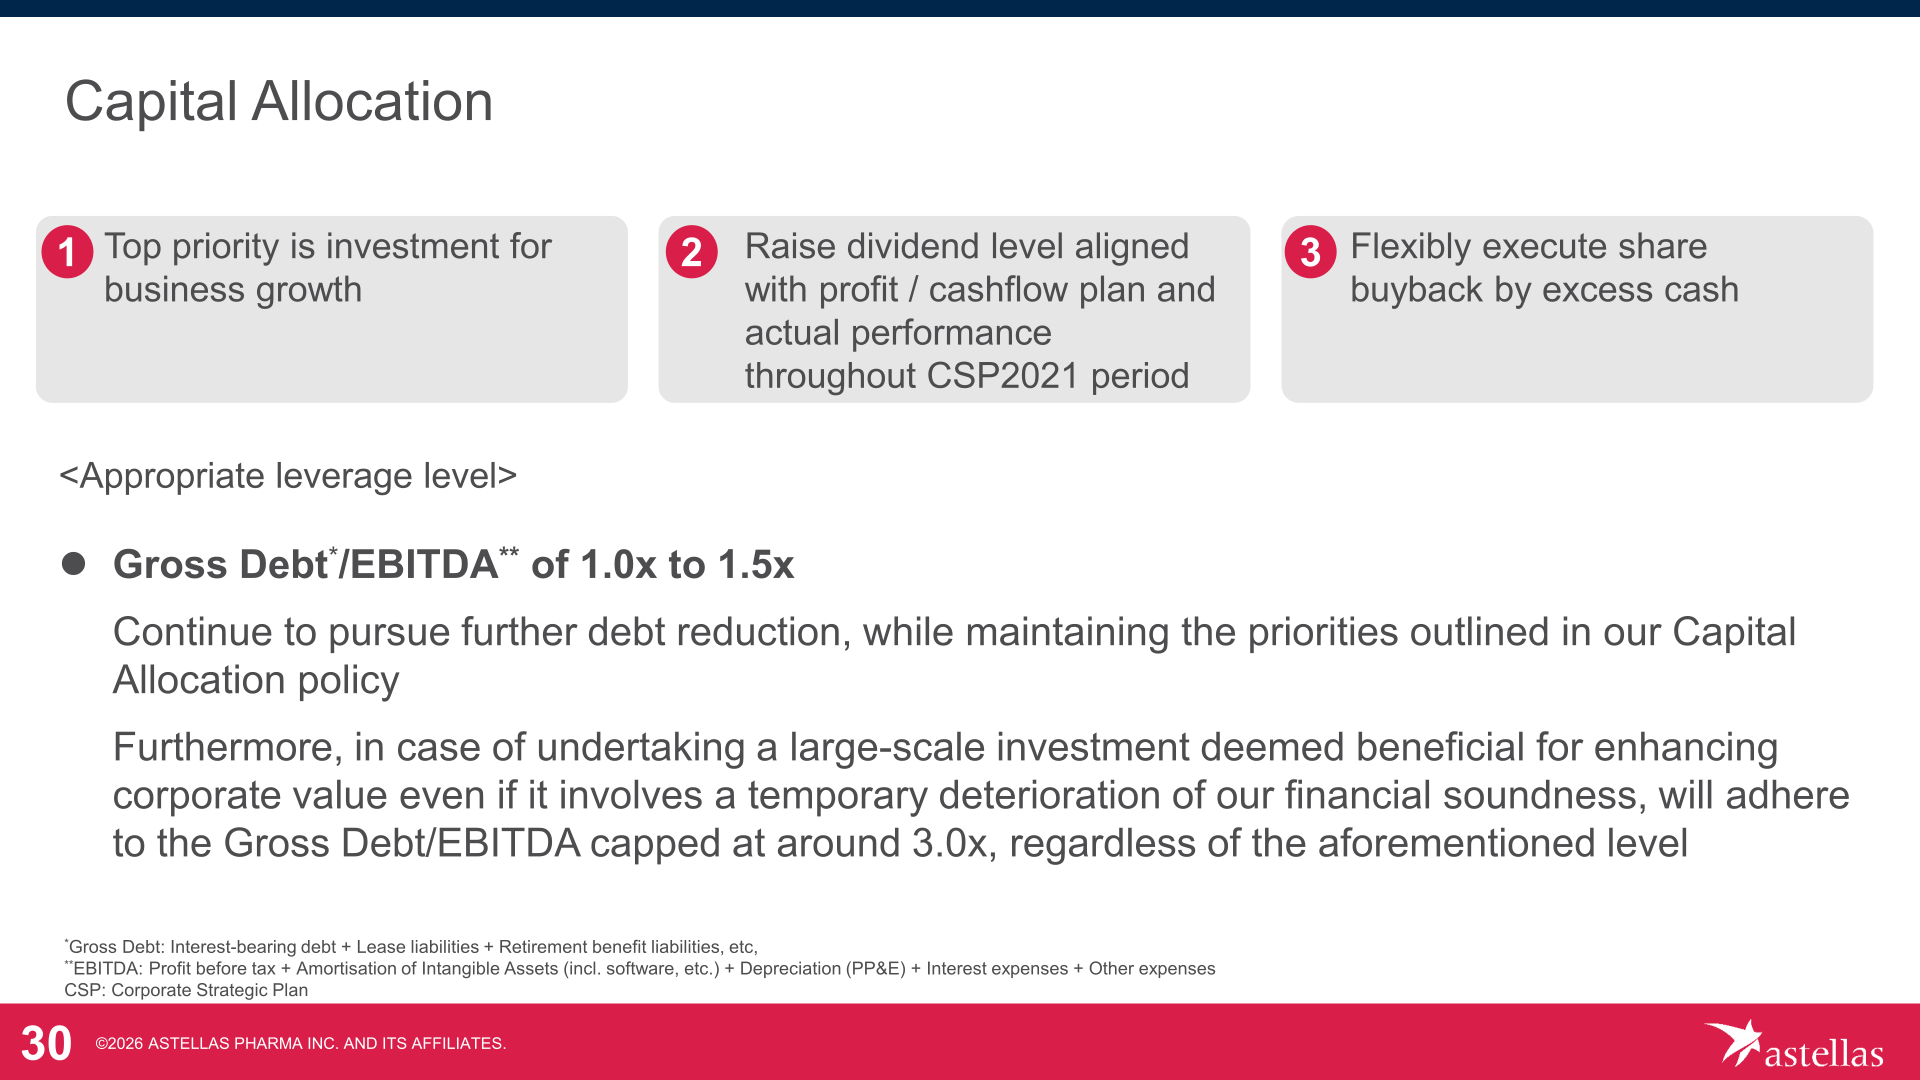
Astellas forecasts a dividend per share of 80 yen for FY2026, an increase of 2 yen, as stated in its FY2026 Outlook. Under its Capital Allocation policy, the company’s stated priorities are: (1) top priority on investment for business growth; (2) raising the dividend level aligned with its profit/cash flow plan and actual performance throughout the CSP2021 period; and (3) flexible execution of share buybacks using excess cash. Astellas targets an appropriate leverage level of Gross Debt/EBITDA of 1.0x to 1.5x, and states that in the case of a large-scale investment deemed beneficial for enhancing corporate value, it will adhere to a Gross Debt/EBITDA cap of around 3.0x, even if this involves a temporary deterioration of financial soundness.
Medium-Term Plan / Topics
Astellas reviewed the performance goals of its Corporate Strategic Plan 2021 (CSP2021), covering FY2021 through FY2025. Over this five-year period, the company reports revenue and core operating profit increased by 1.7x and 2.2x, respectively, with core OP margin rising from 19.2% (FY2021) to 26.0% (FY2025). Strategic Brands revenue grew from approximately 50 billion yen to over 480 billion yen over the same period. Under the Sustainable Margin Transformation (SMT) program, the company achieved cumulative cost optimization of 65.0 billion yen over FY2024-FY2025 (recurring annual benefit), against a total target of 150.0 billion yen through FY2027. Astellas plans to announce its new Corporate Strategic Plan 2026 on May 26 (4:00 pm – 5:30 pm JST).
This article is an analysis based on publicly available information and is not a recommendation to buy or sell any specific securities. Investment decisions are your own responsibility.
![[Obayashi] Investors’ Guide 2026 — The Complete 24-Article Breakdown](https://japan-equity.com/wp-content/uploads/2026/07/hub_cover-1024x1024.png)
![[Obayashi] IR & SR Policy — Feeding Dialogue Back into Management](https://japan-equity.com/wp-content/uploads/2026/07/p32_sq-1024x1024.jpg)
![[Obayashi] Real Estate Development — 18.7% Margin, ¥287.7bn Unrealized Gains](https://japan-equity.com/wp-content/uploads/2026/07/p20_sq-1024x1024.jpg)
![[Obayashi] Domestic Civil Engineering — Resilience Spending Supports 9.6% Margin](https://japan-equity.com/wp-content/uploads/2026/07/p11_sq-1024x1024.jpg)
![[Obayashi] Share Price & External Ratings — vs TOPIX, ESG Index Inclusion](https://japan-equity.com/wp-content/uploads/2026/07/p40_sq-1024x1024.jpg)
![[Construction] ¥75.5tn Investment, Shrinking Workforce — Big-5 Market Share](https://japan-equity.com/wp-content/uploads/2026/07/p12_sq-1024x1024.jpg)



![[Obayashi] Capital Policy & Shareholder Returns — ROE 10%+, DOE ~5%, ¥100bn Buyback](https://japan-equity.com/wp-content/uploads/2026/07/p27_sq-1024x1024.jpg)
![[Obayashi] Reducing Cross-Shareholdings — ¥285.2bn Sold in Five Years](https://japan-equity.com/wp-content/uploads/2026/07/p29_sq-1024x1024.jpg)
![[Obayashi] ¥750bn Investment Plan — ¥300bn to Development, ¥190bn to Tech/DX](https://japan-equity.com/wp-content/uploads/2026/07/p30_sq-1024x1024.jpg)
![[Obayashi] MTP2022 KPIs — Operating Profit ~2x Target, ROE 14.4%](https://japan-equity.com/wp-content/uploads/2026/07/p25_sq-1024x1024.jpg)
![[Obayashi] Cash Allocation — ¥420bn Investment CF Over Five Years](https://japan-equity.com/wp-content/uploads/2026/07/p26_sq-1024x1024.jpg)
![[Obayashi] Green Energy — 44 Plants, 344MW, and the Green Hydrogen Challenge](https://japan-equity.com/wp-content/uploads/2026/07/p21_sq-1024x1024.jpg)
![[Obayashi] Tackling the Labor Shortage — Robotics Construction®](https://japan-equity.com/wp-content/uploads/2026/07/p14_sq-1024x1024.jpg)
