
This article is based on publicly available IR materials and is not a recommendation to buy or sell any specific securities.
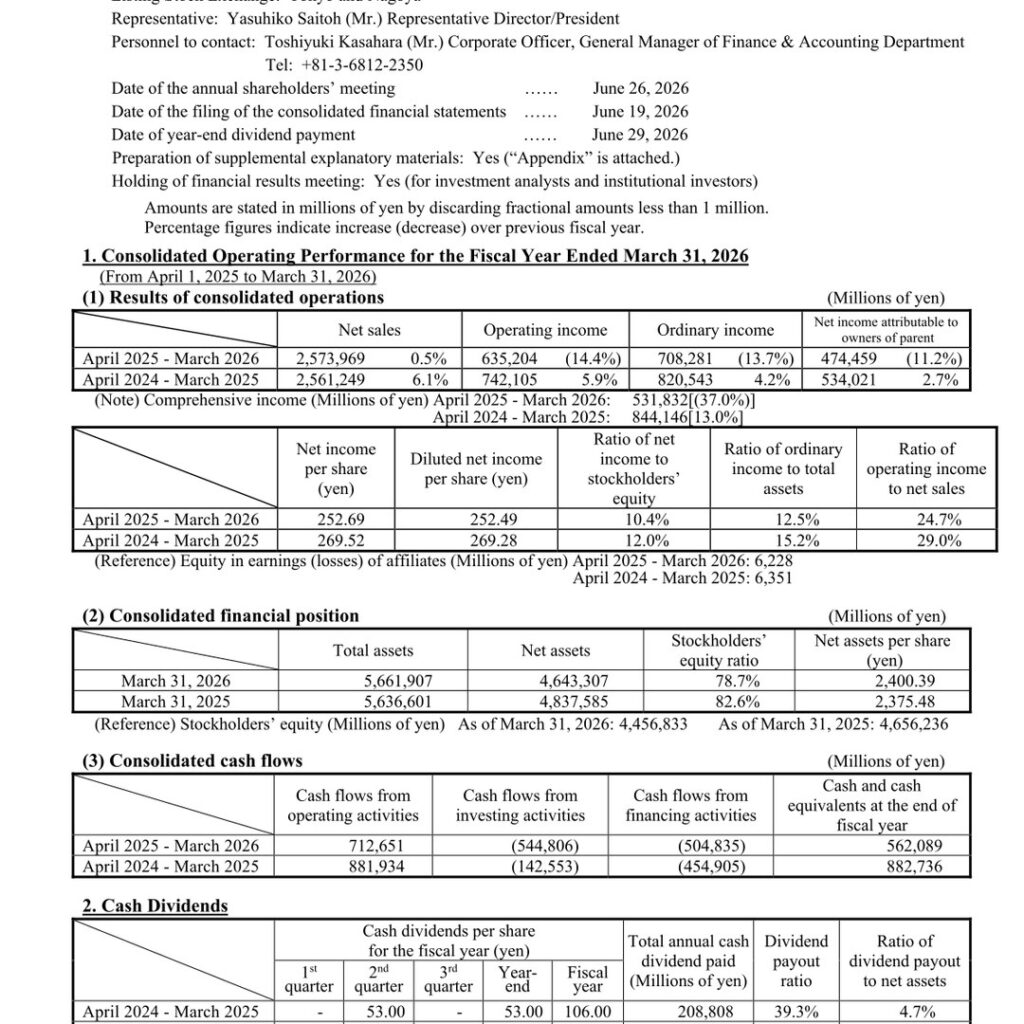
Note: Shin-Etsu Chemical does not publish an English results presentation; this article is based on the company’s English-language consolidated financial results release (kessan tanshin). For the fiscal year ended March 31, 2026 (FY2025), Shin-Etsu Chemical reported consolidated net sales of ¥2,573,969 million (+0.5% year on year), a record high, while operating income fell to ¥635,204 million (-14.4%), ordinary income fell to ¥708,281 million (-13.7%), and net income attributable to owners of parent decreased to ¥474,459 million (-11.2%). The company states that operating income, ordinary income and net income achieved results in line with the forecasts announced in July 2025. The decline in profit was led by a 43% drop in Infrastructure Materials segment operating income amid softer PVC market conditions, partly offset by growth in Electronics Materials on strong AI-related semiconductor demand. Shin-Etsu has not disclosed a consolidated business or dividend forecast for the fiscal year ending March 31, 2027, citing uncertainty over energy and raw material supply and prices linked to the situation in the Middle East.
Consolidated Results (Full-Year Actual)
Comprehensive income was ¥531,832 million (-37.0% year on year), compared with ¥844,146 million (+13.0%) in FY2024. Net income per share was ¥252.69 (FY2024: ¥269.52) and diluted net income per share was ¥252.49 (FY2024: ¥269.28). The ratio of net income to stockholders’ equity (ROE) was 10.4% (FY2024: 12.0%), the ratio of ordinary income to total assets was 12.5% (FY2024: 15.2%), and the ratio of operating income to net sales was 24.7% (FY2024: 29.0%).
| Item | FY2025 (Apr 2025-Mar 2026) | FY2024 (Apr 2024-Mar 2025) | Change (FY2025 vs FY2024) |
|---|---|---|---|
| Net sales (millions of yen) | 2,573,969 | 2,561,249 | 0.5% |
| Operating income (millions of yen) | 635,204 | 742,105 | (14.4%) |
| Ordinary income (millions of yen) | 708,281 | 820,543 | (13.7%) |
| Net income attributable to owners of parent (millions of yen) | 474,459 | 534,021 | (11.2%) |
| Comprehensive income (millions of yen) | 531,832 | 844,146 | (37.0%) |
| Item | FY2025 (Apr 2025-Mar 2026) | FY2024 (Apr 2024-Mar 2025) |
|---|---|---|
| Net income per share (yen) | 252.69 | 269.52 |
| Diluted net income per share (yen) | 252.49 | 269.28 |
| Ratio of net income to stockholders’ equity | 10.4% | 12.0% |
| Ratio of ordinary income to total assets | 12.5% | 15.2% |
| Ratio of operating income to net sales | 24.7% | 29.0% |
Financial Position
At the end of FY2025 (March 31, 2026), total assets increased by ¥25.3 billion from the previous fiscal year-end to ¥5,661.9 billion. Total liabilities increased by ¥219.6 billion to ¥1,018.6 billion, and total net assets decreased by ¥194.2 billion to ¥4,643.3 billion. The stockholders’ equity ratio fell to 78.7% (FY2024: 82.6%). The company states that cash and deposits decreased due to ¥500.0 billion for the repurchase of shares, ¥203.1 billion for cash dividend payments, income tax payments, and continued high levels of capital investment, along with an increase in fixed assets and long-term borrowings.
| Item | Mar 31, 2026 | Mar 31, 2025 |
|---|---|---|
| Total assets (millions of yen) | 5,661,907 | 5,636,601 |
| Net assets (millions of yen) | 4,643,307 | 4,837,585 |
| Stockholders’ equity (millions of yen) | 4,456,833 | 4,656,236 |
| Stockholders’ equity ratio | 78.7% | 82.6% |
| Net assets per share (yen) | 2,400.39 | 2,375.48 |
Cash Flows
Net cash provided by operating activities was ¥712.6 billion, a decrease of ¥169.3 billion from the previous fiscal year, mainly reflecting ¥708.4 billion in income before income taxes and non-controlling interests and ¥242.9 billion in depreciation and amortization, partially offset by income tax payments of ¥208.9 billion. Net cash used in investing activities increased by ¥402.3 billion to ¥544.8 billion, mainly due to ¥188.0 billion for a net increase in time deposits and ¥353.6 billion for purchases of property, plant and equipment. Net cash used in financing activities increased by ¥49.9 billion to ¥504.8 billion, as ¥230.0 billion in proceeds from long-term debt was more than offset by ¥500.0 billion for purchases of treasury stock and ¥203.1 billion in cash dividends paid. Cash and cash equivalents at the end of FY2025 decreased 36% (¥320.6 billion) year on year to ¥562.0 billion.
| Item | FY2025 (Apr 2025-Mar 2026) | FY2024 (Apr 2024-Mar 2025) |
|---|---|---|
| Cash flows from operating activities (millions of yen) | 712,651 | 881,934 |
| Cash flows from investing activities (millions of yen) | (544,806) | (142,553) |
| Cash flows from financing activities (millions of yen) | (504,835) | (454,905) |
| Cash and cash equivalents at end of fiscal year (millions of yen) | 562,089 | 882,736 |
Segment Results
By segment, Electronics Materials net sales rose 9% to ¥1,015.7 billion with operating income up 6% to ¥344.5 billion, as strong AI-related semiconductor demand and a pickup in other sectors lifted sales of silicon wafer, photoresist and photomask blanks. Infrastructure Materials net sales fell 6% to ¥981.3 billion and operating income fell 43% to ¥164.8 billion, as PVC prices softened in Asian and other overseas markets even as the company pushed forward price increases in response to rising raw material and energy costs linked to the war in the Middle East. Functional Materials net sales declined 2% to ¥440.8 billion while operating income rose 1% to ¥100.9 billion, supported by increased sales of highly functional product groups centered on silicones. Processing & Specialized Services net sales fell 1% to ¥135.9 billion and operating income fell 5% to ¥27.3 billion, with strong demand for semiconductor-related containers partly offsetting the decline.
| Segment | Metric | FY2025 (Apr 2025-Mar 2026) | FY2024 (Apr 2024-Mar 2025) | Change |
|---|---|---|---|---|
| Electronics Materials | Net sales (billions of yen) | 1,015.7 | 934.3 | 9% |
| Electronics Materials | Operating income (billions of yen) | 344.5 | 324.7 | 6% |
| Infrastructure Materials | Net sales (billions of yen) | 981.3 | 1,041.5 | (6%) |
| Infrastructure Materials | Operating income (billions of yen) | 164.8 | 291.4 | (43%) |
| Functional Materials | Net sales (billions of yen) | 440.8 | 448.6 | (2%) |
| Functional Materials | Operating income (billions of yen) | 100.9 | 100.0 | 1% |
| Processing & Specialized Services | Net sales (billions of yen) | 135.9 | 136.7 | (1%) |
| Processing & Specialized Services | Operating income (billions of yen) | 27.3 | 28.7 | (5%) |
| Total | Net sales (billions of yen) | 2,573.9 | 2,561.2 | |
| Total | Operating income (billions of yen) | 635.2 | 742.1 |
FY2026 Forecast
Shin-Etsu Chemical has not disclosed a consolidated business or cash dividend forecast for the fiscal year ending March 31, 2027 (FY2026). The company cites the difficulty of reasonably predicting performance given supply constraints and price fluctuations for energy and raw materials linked to the situation in the Middle East, and states it will announce the forecast once disclosure becomes possible. The company has, however, disclosed a plan for capital investment and depreciation and amortization for FY2026, shown below.
| Item | FY2026 Plan (billions of yen) |
|---|---|
| Investments | 350.0 |
| Depreciation and Amortization | 240.0 |
Shareholder Returns
Shin-Etsu’s basic policy is to expand profitability while exercising fiscal restraint and to return the fruits of management efforts to shareholders in a proper and stable manner, with a medium-to-long-term target dividend payout ratio of around 40%. The year-end dividend for FY2025 is planned at ¥53 per share, the same as the interim dividend of ¥53 per share, for an annual dividend of ¥106 per share, unchanged from the previous period. The FY2025 dividend payout ratio was 41.9% (FY2024: 39.3%) and the ratio of dividend payout to net assets was 4.4% (FY2024: 4.7%). Total annual cash dividends paid were ¥197,681 million (FY2024: ¥208,808 million). On share buybacks, the Board of Directors resolved on April 25, 2025 to repurchase up to 200 million shares (up to ¥500 billion) by April 24, 2026; the company repurchased 87,393,400 shares (¥399,999 million) in May 2025 and 17,799,900 shares (¥99,999 million) in February 2026. The company also states that, considering the total payout ratio, it has announced a treasury stock purchase of ¥250 billion.
| Item | FY2025 (Apr 2025-Mar 2026) | FY2024 (Apr 2024-Mar 2025) |
|---|---|---|
| Interim (2nd quarter) dividend per share (yen) | 53.00 | 53.00 |
| Year-end dividend per share (yen) | 53.00 | 53.00 |
| Annual dividend per share (yen) | 106.00 | 106.00 |
| Total annual cash dividend paid (millions of yen) | 197,681 | 208,808 |
| Dividend payout ratio | 41.9% | 39.3% |
| Ratio of dividend payout to net assets | 4.4% | 4.7% |
Topics and Capital Investments
Key topics disclosed for the period from April 2025 to March 2026 include: development of a lipid nanoparticle production system with Hokkaido University (April 2025); the Board’s decision to repurchase up to 200 million shares, up to ¥500 billion (April 2025); new silicone products for personal care use (May 2025); development of recyclable thermoplastic silicone (November 2025); a world-record GaN breakdown voltage exceeding 650V achieved by IMEC on Shin-Etsu’s 300-mm QST™ substrate (November 2025); and Shintech’s announcement of a $3.4 billion capital investment to bolster its PVC and caustic soda business (March 2026). The company also disclosed a list of announced capital investment projects, summarized below.
| Company | Project | Investment Amount |
|---|---|---|
| Shin-Etsu Chemical (Isesaki) | Build a new manufacturing and research-and-development base for semiconductor lithography materials | ¥83 billion |
| Shintech (USA) | Facility investment in PVC (2nd phase) | $1.25 billion |
| Shintech (USA) | Expansion of PVC feedstock production facilities | $3.4 billion |
| Shin-Etsu Chemical (Gunma, Takefu, Naoetsu) | Reinforcement of the production capacity for silicone advanced functional products line | ¥80 billion |
| Shin-Etsu Chemical and main overseas bases (Gunma, Thailand, etc.) | Expansion of silicone product applications and advanced/environmentally friendly silicone functionality | ¥100 billion |
| Shin-Etsu Silicone (Pinghu) (China) | Construct a new silicone products plant | ¥2.1 billion |
| Shin-Etsu Chemical (Naoetsu) | Capital investment in pharmaceutical cellulose products | ¥10 billion |
| Shin-Etsu Chemical (Naoetsu) / SE Tylose (Germany) | Strengthening of pharmaceutical cellulose products and warehouse storage capacity | ¥10 billion |
This article is an analysis based on publicly available information and is not a recommendation to buy or sell any specific securities. Investment decisions are your own responsibility.
![[Obayashi] Investors’ Guide 2026 — The Complete 24-Article Breakdown](https://japan-equity.com/wp-content/uploads/2026/07/hub_cover-1024x1024.png)
![[Obayashi] IR & SR Policy — Feeding Dialogue Back into Management](https://japan-equity.com/wp-content/uploads/2026/07/p32_sq-1024x1024.jpg)
![[Obayashi] Domestic Civil Engineering — Resilience Spending Supports 9.6% Margin](https://japan-equity.com/wp-content/uploads/2026/07/p11_sq-1024x1024.jpg)
![[Obayashi] Overseas Construction — Orders Reach ¥1.2tn](https://japan-equity.com/wp-content/uploads/2026/07/p15_sq-1024x1024.jpg)
![[Obayashi] Share Price & External Ratings — vs TOPIX, ESG Index Inclusion](https://japan-equity.com/wp-content/uploads/2026/07/p40_sq-1024x1024.jpg)
![[Construction] ¥75.5tn Investment, Shrinking Workforce — Big-5 Market Share](https://japan-equity.com/wp-content/uploads/2026/07/p12_sq-1024x1024.jpg)



![[Obayashi] Capital Policy & Shareholder Returns — ROE 10%+, DOE ~5%, ¥100bn Buyback](https://japan-equity.com/wp-content/uploads/2026/07/p27_sq-1024x1024.jpg)
![[Obayashi] Reducing Cross-Shareholdings — ¥285.2bn Sold in Five Years](https://japan-equity.com/wp-content/uploads/2026/07/p29_sq-1024x1024.jpg)
![[Obayashi] ¥750bn Investment Plan — ¥300bn to Development, ¥190bn to Tech/DX](https://japan-equity.com/wp-content/uploads/2026/07/p30_sq-1024x1024.jpg)
![[Obayashi] MTP2022 KPIs — Operating Profit ~2x Target, ROE 14.4%](https://japan-equity.com/wp-content/uploads/2026/07/p25_sq-1024x1024.jpg)
![[Obayashi] Cash Allocation — ¥420bn Investment CF Over Five Years](https://japan-equity.com/wp-content/uploads/2026/07/p26_sq-1024x1024.jpg)
![[Obayashi] Green Energy — 44 Plants, 344MW, and the Green Hydrogen Challenge](https://japan-equity.com/wp-content/uploads/2026/07/p21_sq-1024x1024.jpg)
![[Obayashi] Tackling the Labor Shortage — Robotics Construction®](https://japan-equity.com/wp-content/uploads/2026/07/p14_sq-1024x1024.jpg)
