
This article is based on publicly available IR materials and is not a recommendation to buy or sell any specific securities.
Note: ZIGExN Co., Ltd. has a March fiscal year-end and labels the fiscal year covered here as “FY2026/3” (fiscal year ended March 31, 2026); on this site the most recently completed fiscal year is classified as FY2025, and the labels used in the text, tables and segment data below follow the company’s own materials (FY2026/3 = fiscal year ended March 2026, FY2027/3 = the current fiscal year).
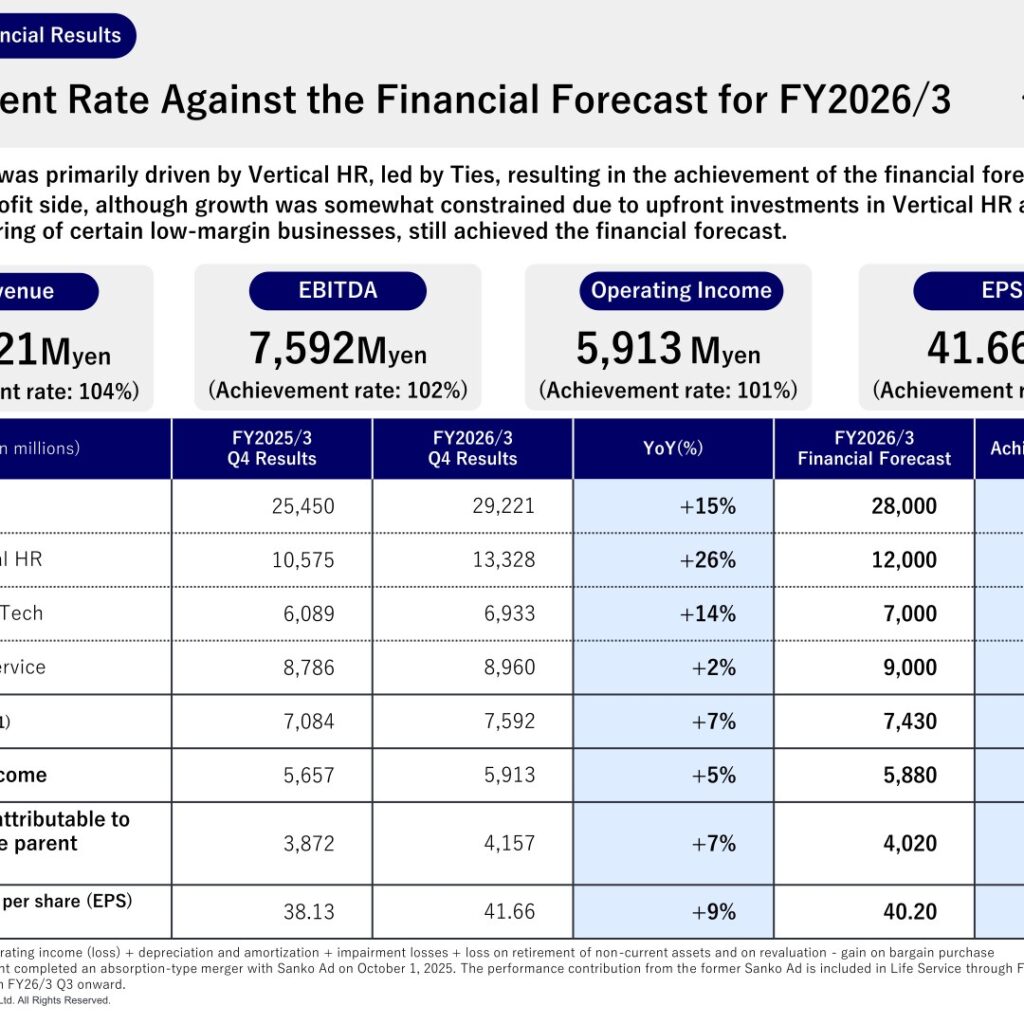
ZIGExN reported FY2026/3 revenue of 29,221 million yen (YoY +15%), EBITDA of 7,592 million yen (YoY +7%) and operating income of 5,913 million yen (YoY +5%), with revenue and all profit items meeting the initial plan and multiple indicators setting new record highs. Growth was driven by Vertical HR, led by Ties. For FY2027/3, the first year of its 3rd Medium-Term Management Plan, the company forecasts revenue of 33,500 million yen and EBITDA of 8,320 million yen, and plans to raise the dividend to 13.5 yen per share from 11.0 yen.
Consolidated Results (Full-Year Actual)
Revenue was primarily driven by Vertical HR, led by Ties, resulting in the achievement of the financial forecast (achievement rate 104%). On the profit side, the company explains that growth was somewhat constrained by upfront investments in Vertical HR and the restructuring of certain low-margin businesses, but EBITDA (102%), operating income (101%), net income attributable to owners of the parent (103%) and EPS (104%) all achieved the forecast. EBITDA and operating income reached record highs.
| Item (yen in millions) | FY2026/3 Results | FY2025/3 Results | YoY (%) | FY2026/3 Forecast | Achievement Rate (%) |
|---|---|---|---|---|---|
| Revenue | 29,221 | 25,450 | +15% | 28,000 | 104% |
| EBITDA | 7,592 | 7,084 | +7% | 7,430 | 102% |
| Operating income | 5,913 | 5,657 | +5% | 5,880 | 101% |
| Net income attributable to owners of the parent company | 4,157 | 3,872 | +7% | 4,020 | 103% |
| Basic EPS (yen) | 41.66 | 38.13 | +9% | 40.20 | 104% |
In the YoY operating income bridge, revenue contributed +3,771 million yen, offset by cost of sales (△1,106 million yen), labor costs in SG&A (△1,253 million yen), advertising and promotional expenses (△597 million yen), depreciation and amortization, etc. (△142 million yen) and other SG&A (△417 million yen). The company attributes this to workforce expansion in the job placement business, marketing investments and system-related investments such as software development. The difference between EBITDA and operating income widened from 1,427 million yen to 1,679 million yen (+252 million yen), mainly due to higher non-cash expenses such as software amortization and depreciation.
In FY2026/3 Q4, revenue was 8,331 million yen (YoY +20.5%), EBITDA was 2,198 million yen (YoY +13.3%) and operating income was 1,751 million yen (YoY +13.8%), with both operating income and EBITDA reaching record highs despite a slight downward trend in margins due to changes in the portfolio mix from new M&A and strategic upfront investments. The number of corporate clients was 23,335 (YoY +0.7%) and unit price per corporate client was 1.25 million yen (YoY +14.0%).
Operating cash flow was 5,427 million yen (previous year: 6,154 million yen), investing cash flow was -3,825 million yen (previous year: -2,449 million yen), reflecting growth investments such as M&A and software development, and financing cash flow was -2,018 million yen (previous year: -3,838 million yen). Total goodwill was 13,483 million yen against equity of 22,454 million yen and total assets of 40,554 million yen, for a goodwill-to-equity ratio of 0.6x and a ratio of equity attributable to owners of the parent to total assets of 55.5%. No goodwill impairment losses were recognized.
Segment Results
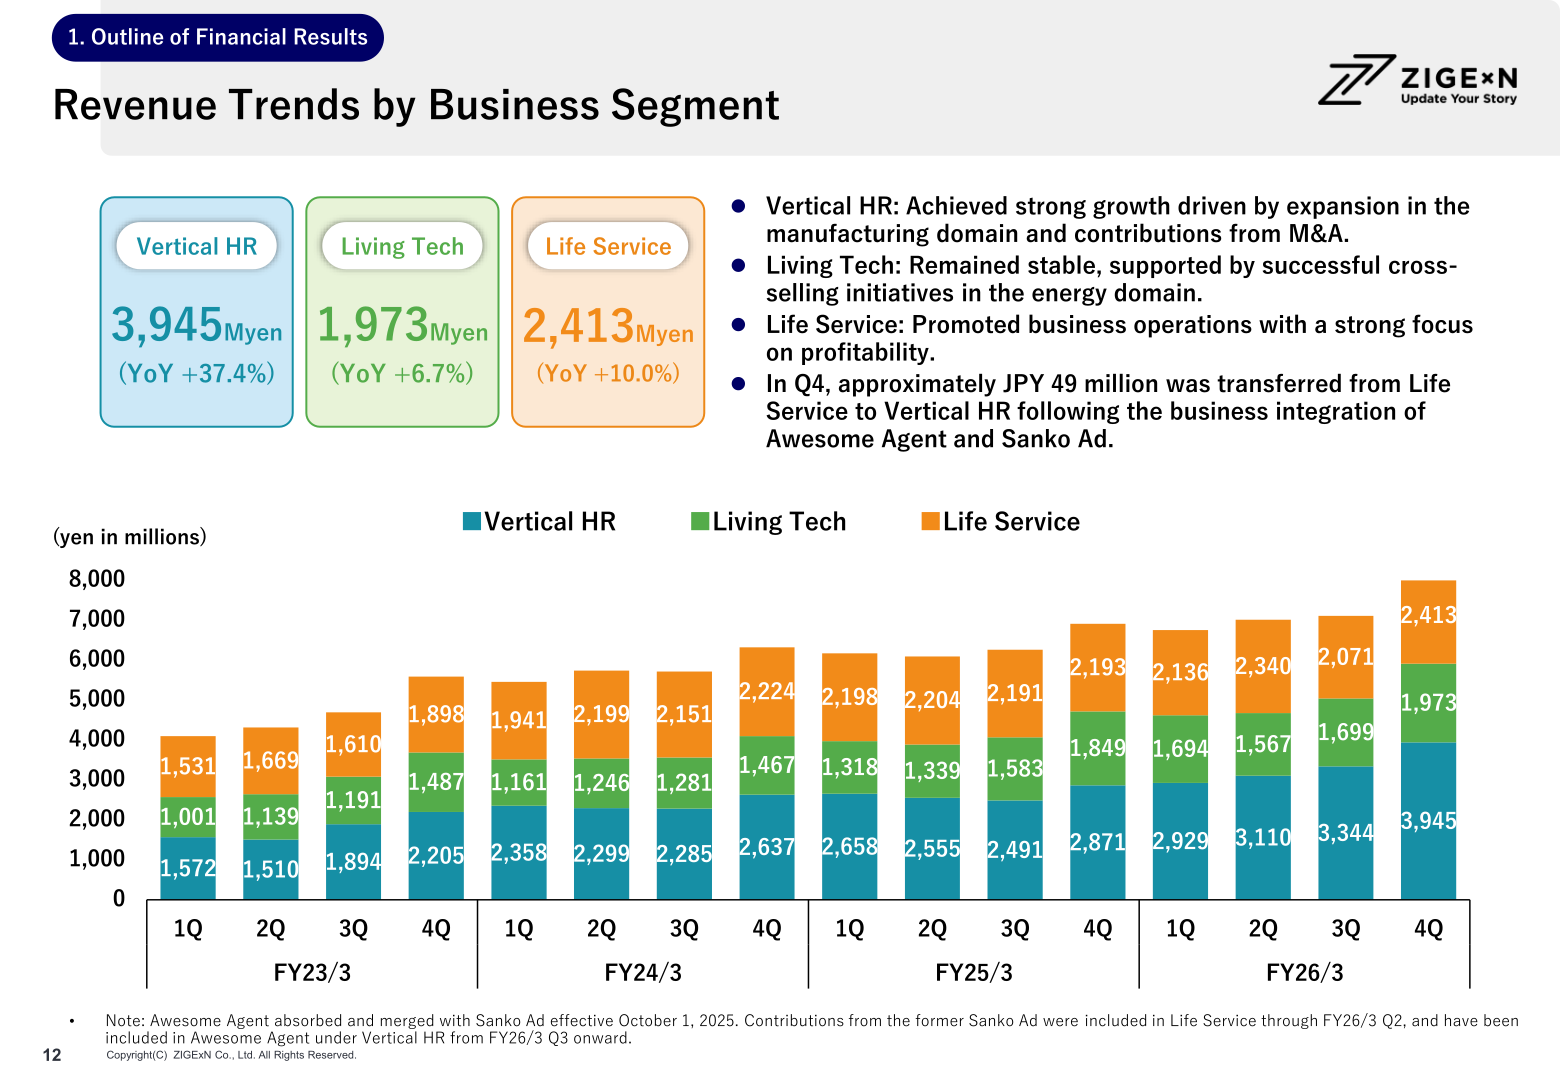
Vertical HR: revenue rose to 13,328 million yen (YoY +26%, 111% of forecast). At Ties, both employment-based and contract-based revenue continued to maintain strong growth, and the pace of new user acquisition accelerated at REJOB. In Q4, Vertical HR revenue was 3,945 million yen (YoY +37.4%), driven by expansion in the manufacturing domain and contributions from M&A. Through Ties and other acquisitions, Vertical HR became “Z CORE” (a flagship business with over JPY 10 billion in revenue) ahead of schedule.
Living Tech: revenue was 6,933 million yen (YoY +14%, 99% of forecast). Demand declined in the moving and renovation domains due to macroeconomic impacts, while cross-selling of electricity switching services was successful amid growing momentum to review household expenses. Q4 revenue was 1,973 million yen (YoY +6.7%). The company also completed the absorption-type split of Hoken Mammoth to accelerate decision-making and business growth.
Life Service: revenue was 8,960 million yen (YoY +2%, 100% of forecast). In the travel domain, leisure travel demand is moderating due to the weaker yen, while business travel demand remains robust. The segment promoted the integration of certain low-profitability businesses and business operations with a strong focus on profitability. Q4 revenue was 2,413 million yen (YoY +10.0%). Awesome Agent completed an absorption-type merger with Sanko Ad on October 1, 2025; the former Sanko Ad’s contribution is included in Life Service through FY26/3 Q2 and in Vertical HR from FY26/3 Q3 onward.
| Segment | Metric (yen in millions) | FY2026/3 | FY2025/3 | YoY (%) |
|---|---|---|---|---|
| Vertical HR | Revenue | 13,328 | 10,575 | +26% |
| Living Tech | Revenue | 6,933 | 6,089 | +14% |
| Life Service | Revenue | 8,960 | 8,786 | +2% |
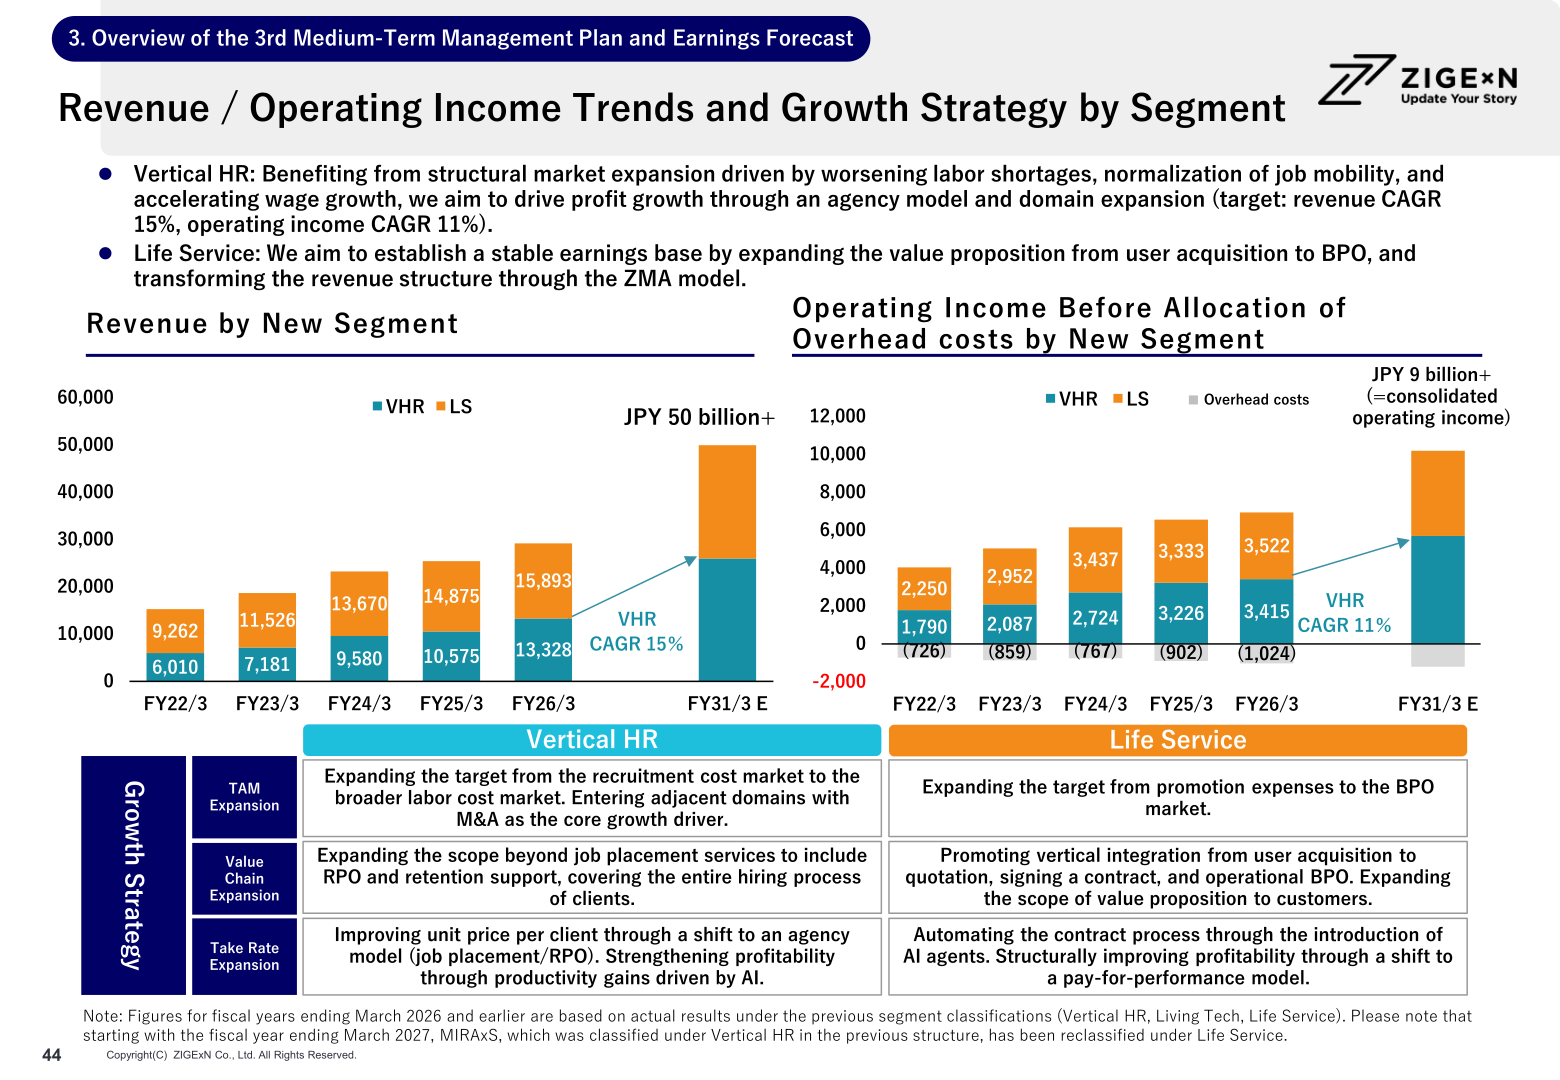
| Vertical HR (new segment basis) | Operating income before allocation of overhead costs | 3,415 | 3,226 | – |
| Life Service (new segment basis) | Operating income before allocation of overhead costs | 3,522 | 3,333 | – |
| Overhead costs | – | (1,024) | (902) | – |
The operating income figures before allocation of overhead costs are presented on the new two-segment basis (Vertical HR and Life Service, with Living Tech integrated into Life Service) using actual results under the previous segment classifications.
FY2027/3 Forecast
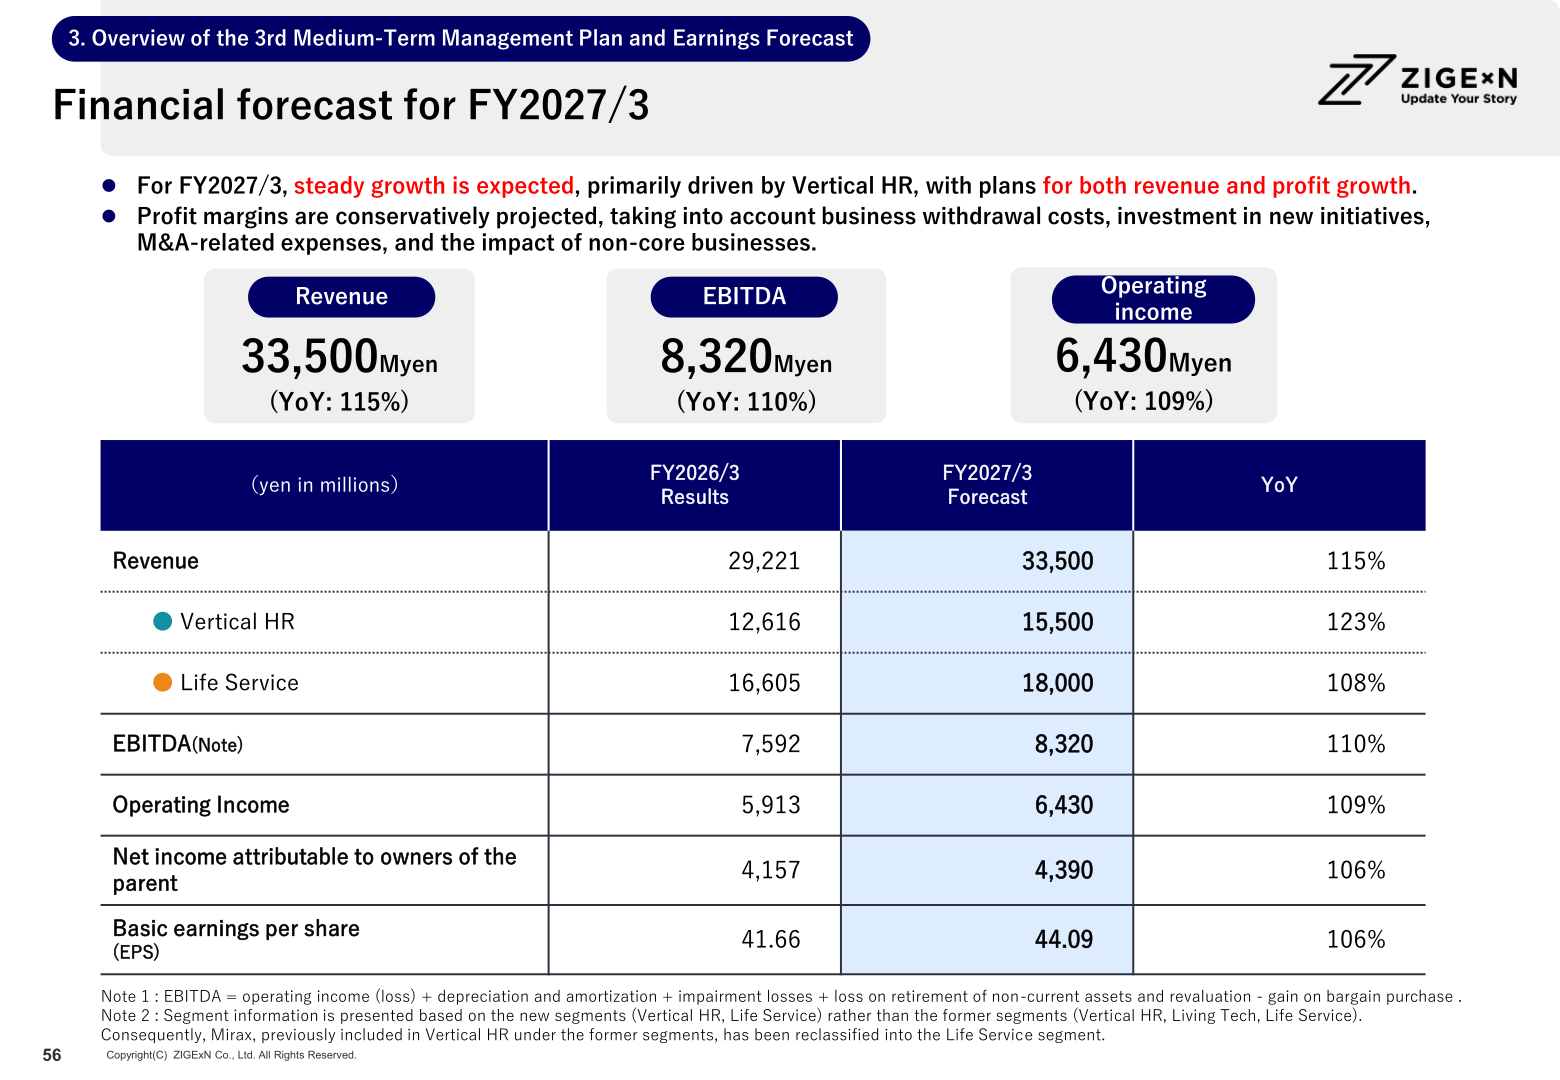
For FY2027/3, steady growth is expected, primarily driven by Vertical HR, with plans for both revenue and profit growth. The company notes that profit margins are conservatively projected, taking into account business withdrawal costs, investment in new initiatives, M&A-related expenses and the impact of non-core businesses. Segment information is presented on the new segments (Vertical HR and Life Service); MIRAxS, previously included in Vertical HR, has been reclassified into Life Service.
| Item (yen in millions) | FY2027/3 Forecast | FY2026/3 Results | YoY |
|---|---|---|---|
| Revenue | 33,500 | 29,221 | 115% |
| Vertical HR | 15,500 | 12,616 | 123% |
| Life Service | 18,000 | 16,605 | 108% |
| EBITDA | 8,320 | 7,592 | 110% |
| Operating income | 6,430 | 5,913 | 109% |
| Net income attributable to owners of the parent | 4,390 | 4,157 | 106% |
| Basic EPS (yen) | 44.09 | 41.66 | 106% |
Shareholder Returns
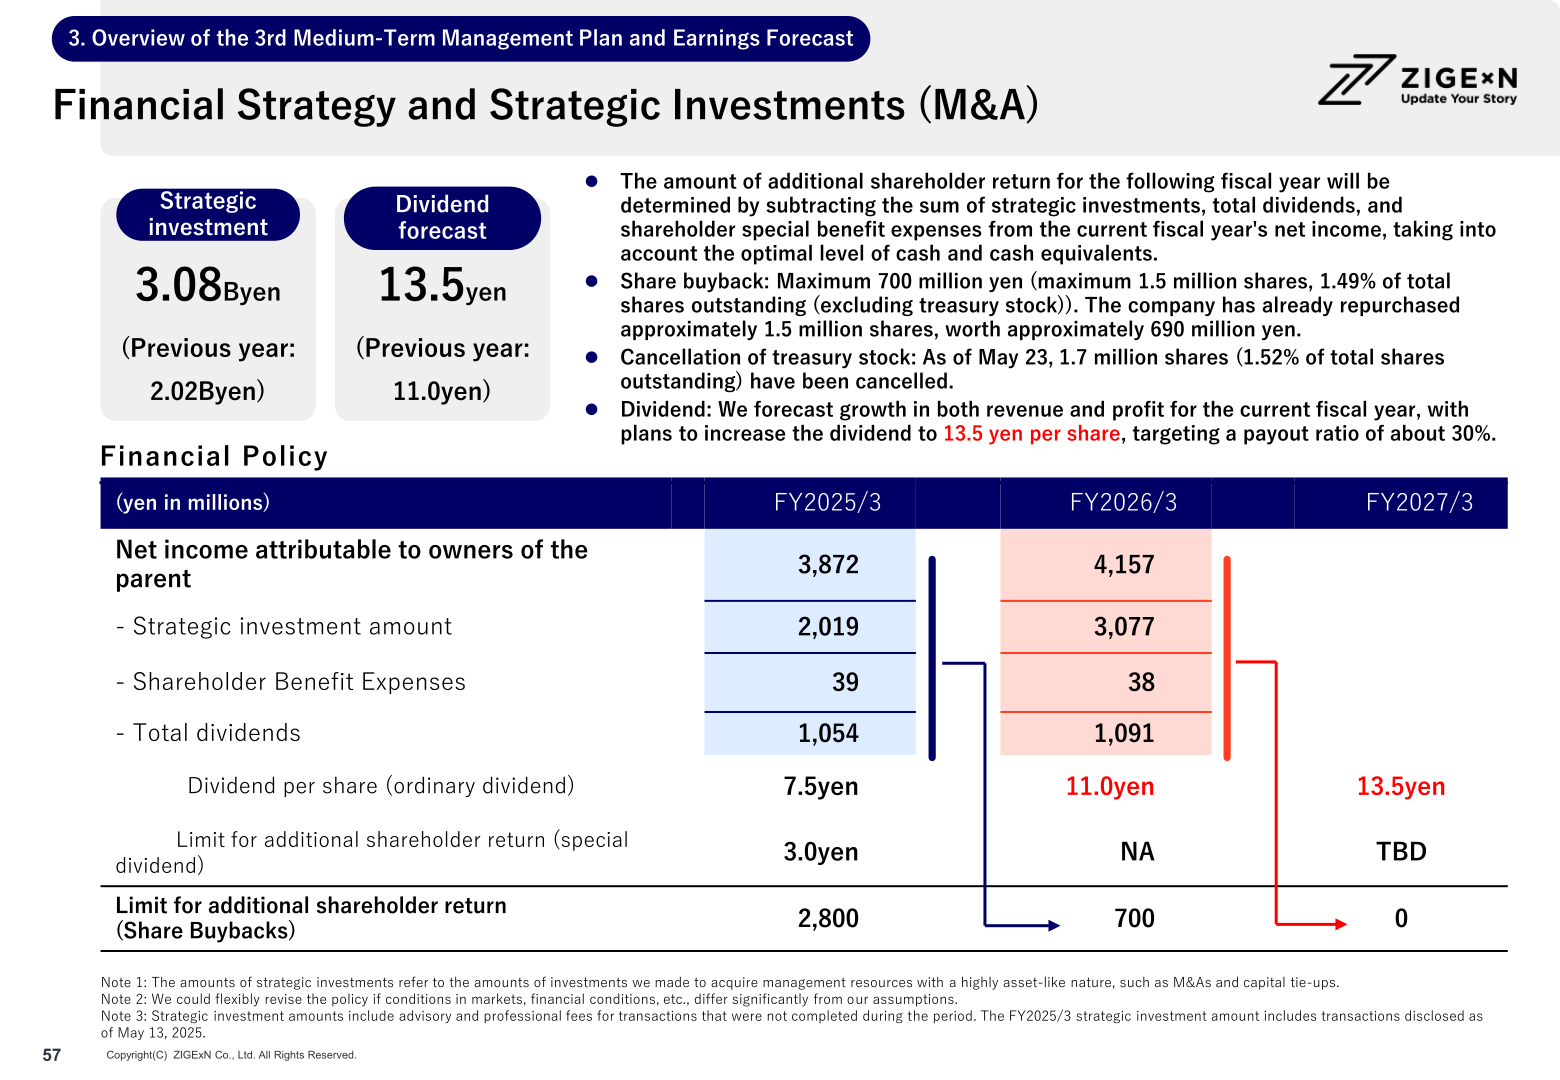
The ordinary dividend per share was 11.0 yen for FY2026/3, up from 7.5 yen for FY2025/3. For FY2027/3, the company forecasts growth in both revenue and profit and plans to increase the dividend to 13.5 yen per share, targeting a payout ratio of about 30%. The amount of additional shareholder return for the following fiscal year is determined by subtracting strategic investments, total dividends and shareholder special benefit expenses from the current fiscal year’s net income, taking into account the optimal level of cash and cash equivalents. Strategic investment amounted to 3.08 billion yen (previous year: 2.02 billion yen).
| Item (yen in millions) | FY2025/3 | FY2026/3 | FY2027/3 |
|---|---|---|---|
| Net income attributable to owners of the parent | 3,872 | 4,157 | – |
| – Strategic investment amount | 2,019 | 3,077 | – |
| – Shareholder benefit expenses | 39 | 38 | – |
| – Total dividends | 1,054 | 1,091 | – |
| Dividend per share (ordinary dividend) | 7.5 yen | 11.0 yen | 13.5 yen |
| Limit for additional shareholder return (special dividend) | 3.0 yen | NA | TBD |
| Limit for additional shareholder return (share buybacks) | 2,800 | 700 | 0 |
Regarding share buybacks, the company set a maximum of 700 million yen (maximum 1.5 million shares, 1.49% of total shares outstanding excluding treasury stock) and has already repurchased approximately 1.5 million shares worth approximately 690 million yen. The company also notes that the introduction of its shareholder benefit program has more than tripled the number of shareholders holding 10 units (1,000 shares) or more compared with the period prior to its announcement, reaching 4,657 in FY26/3.
Review of the 2nd Medium-Term Plan and the 3rd Medium-Term Management Plan
Under the 2nd Medium-Term Management Plan (FY2022/3–FY2026/3), which targeted revenue of 35,000 million yen+ and EBITDA of 10,000 million yen+, the Group-wide targets were not achieved; FY2026/3 revenue was 29,221 million yen and EBITDA was 7,592 million yen, versus 12,564 million yen and 3,808 million yen in FY2021/3. The company notes that many key management indicators nonetheless reached record highs, and that Vertical HR achieved Z CORE status while Living Tech did not.
The 3rd Medium-Term Management Plan aims to transform the company from matching technology into a “Matching Agent” (ZIGExN Matching Agent, ZMA), deeply integrating into the entire client business process from user acquisition to BPO through the optimal allocation of AI and talent. By FY3/2031, the company targets revenue of JPY 50 billion+, EBITDA of JPY 12 billion+ and ROE of approx. 20%. Vertical HR will remain the core segment (target: revenue CAGR 15%, operating income CAGR 11%), while Living Tech and Life Service are integrated into a new Life Service segment.
For capital allocation over the plan period, cumulative adjusted operating cash flow of approx. JPY 40 billion is to be allocated approximately 40% to business investment, 40% to strategic investment (M&A) and 20% to shareholder returns, with a stable dividend payout ratio of 30% or higher. The company has secured an allocation of over 16 billion JPY for strategic investments and plans to target larger M&A deals of several billion JPY or more, while using financial leverage within the bounds of financial discipline (net D/E ratio approx. 1.0x, net debt/EBITDA ratio approx. 2.0x, goodwill-to-equity ratio approx. 1.0x, and ratio of equity attributable to owners of the parent to total assets 30%+).
This article is an analysis based on publicly available information and is not a recommendation to buy or sell any specific securities. Investment decisions are your own responsibility.
















