
This article is based on publicly available IR materials and is not a recommendation to buy or sell any specific securities.
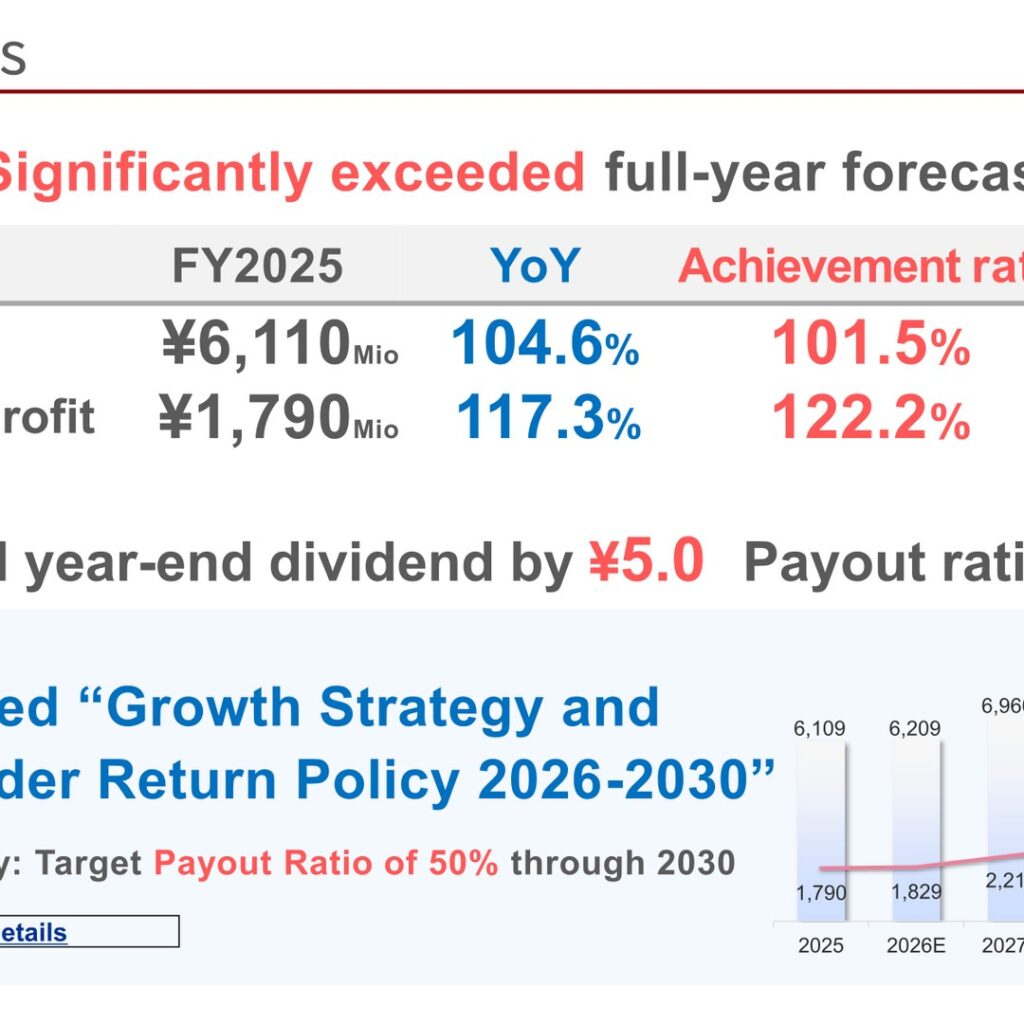
FINDEX Inc. (3649), a developer of medical software, public-sector document management systems and health tech devices, released its FY2025 Financial Results Presentation on February 12, 2026, covering the fiscal year ended December 31, 2025. Net sales rose 4.6% year on year to ¥6,110 million and operating profit rose 17.3% to ¥1,790 million, with an operating profit margin of 29.3%. The company described FY2025 as having significantly exceeded its full-year forecast, with achievement rates of 101.5% for net sales and 122.2% for operating profit. Alongside the results, it announced its “Growth Strategy and Shareholder Return Policy 2026-2030”, which targets a dividend payout ratio of 50% through 2030.
Consolidated Results (Full-Year Actual)
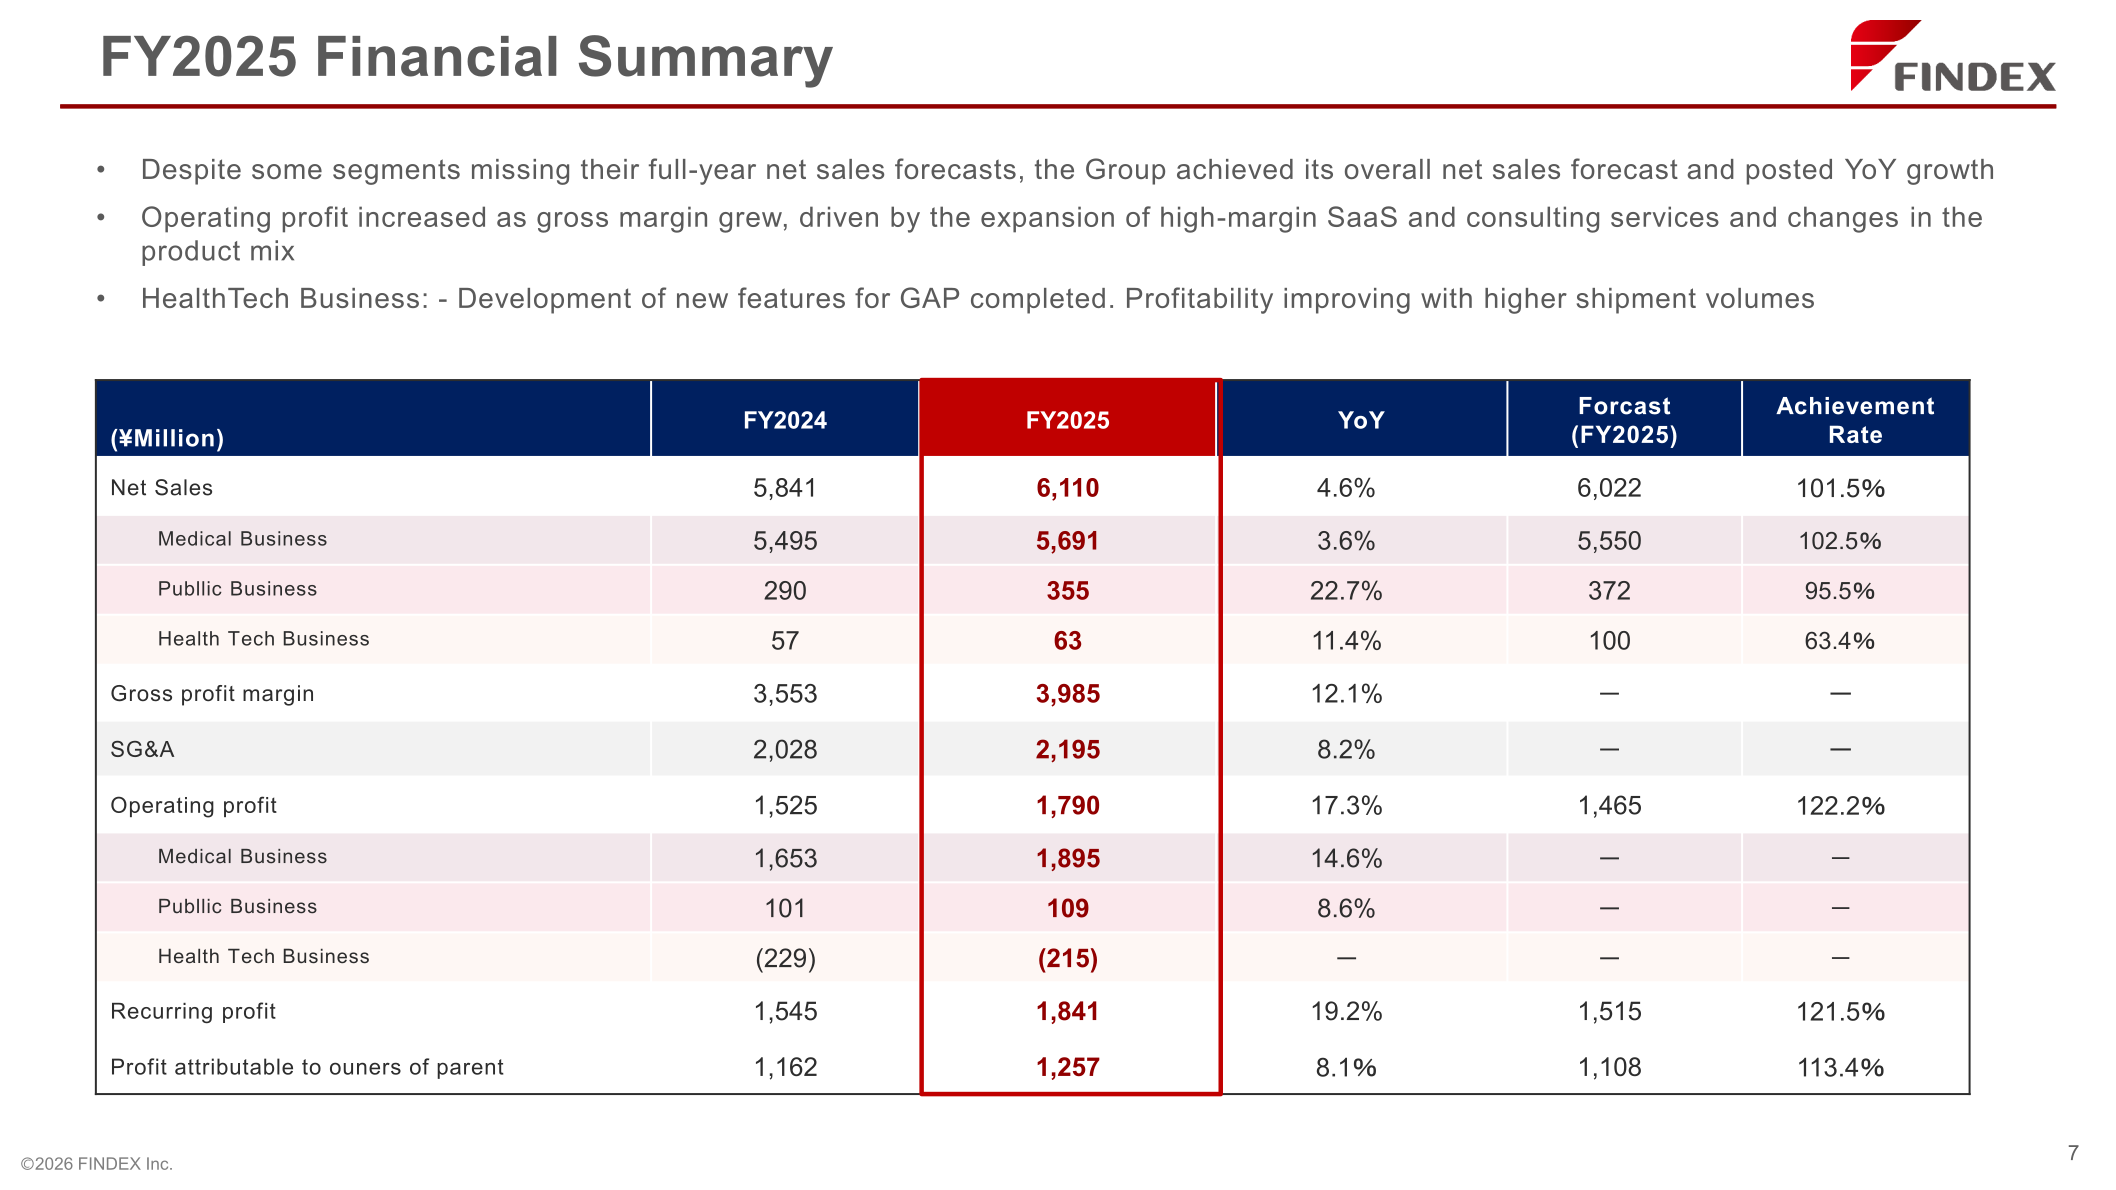
According to the company, although some segments missed their full-year net sales forecasts, the Group achieved its overall net sales forecast and posted year-on-year growth. Operating profit increased as gross margin grew, driven by the expansion of high-margin SaaS and consulting services and changes in the product mix. Gross profit was ¥3,985 million (+12.1%) and SG&A expenses were ¥2,195 million (+8.2%). Recurring profit rose 19.2% to ¥1,841 million and profit attributable to owners of parent rose 8.1% to ¥1,257 million. Net sales and profit both exceeded the initial forecast announced at the beginning of the fiscal year.
| Item (¥ million) | FY2024 | FY2025 | YoY | Forecast (FY2025) | Achievement Rate |
|---|---|---|---|---|---|
| Net sales | 5,841 | 6,110 | 4.6% | 6,022 | 101.5% |
| Gross profit | 3,553 | 3,985 | 12.1% | — | — |
| SG&A | 2,028 | 2,195 | 8.2% | — | — |
| Operating profit | 1,525 | 1,790 | 17.3% | 1,465 | 122.2% |
| Recurring profit | 1,545 | 1,841 | 19.2% | 1,515 | 121.5% |
| Profit attributable to owners of parent | 1,162 | 1,257 | 8.1% | 1,108 | 113.4% |
The company noted that quarterly results exhibit seasonality, with net sales and profit weighted toward Q1 and Q4, and that the degree of concentration varies each year depending on major customer hospitals’ capital investment environment and system go-live schedules. SG&A increased mainly due to higher personnel costs from headcount expansion; personnel, recruitment and training expenses within SG&A rose 8.8% from ¥1,387 million in FY2024 to ¥1,510 million in FY2025.
On the balance sheet, total assets were ¥6,807 million (FY2024: ¥6,684 million) and net assets ¥5,467 million (FY2024: ¥5,607 million), with treasury shares of ¥(1,752) million versus ¥(772) million a year earlier. The company stated that while treasury shares are being repurchased, the balance sheet remains largely unchanged and financial soundness is maintained, with an equity ratio of 79.9%. Interest-bearing liabilities were zero. Cash flows from operating activities were ¥1,652 million (FY2024: ¥1,899 million), cash flows from investing activities ¥(298) million, cash flows from financing activities ¥(1,410) million, and free cash flow ¥1,354 million (FY2024: ¥(536) million).
Segment Results
FINDEX reports three segments: the Medical Business, the Public Sector Business and the Health Tech Business. All three segments grew net sales year on year, and the Health Tech Business, while still loss-making, narrowed its operating loss.
| Segment | Metric (¥ million) | FY2024 | FY2025 | YoY |
|---|---|---|---|---|
| Medical Business | Net sales | 5,495 | 5,691 | 3.6% |
| Medical Business | Operating profit | 1,653 | 1,895 | 14.6% |
| Public Sector Business | Net sales | 290 | 355 | 22.7% |
| Public Sector Business | Operating profit | 101 | 109 | 8.6% |
| Health Tech Business | Net sales | 57 | 63 | 11.4% |
| Health Tech Business | Operating profit | (229) | (215) | — |
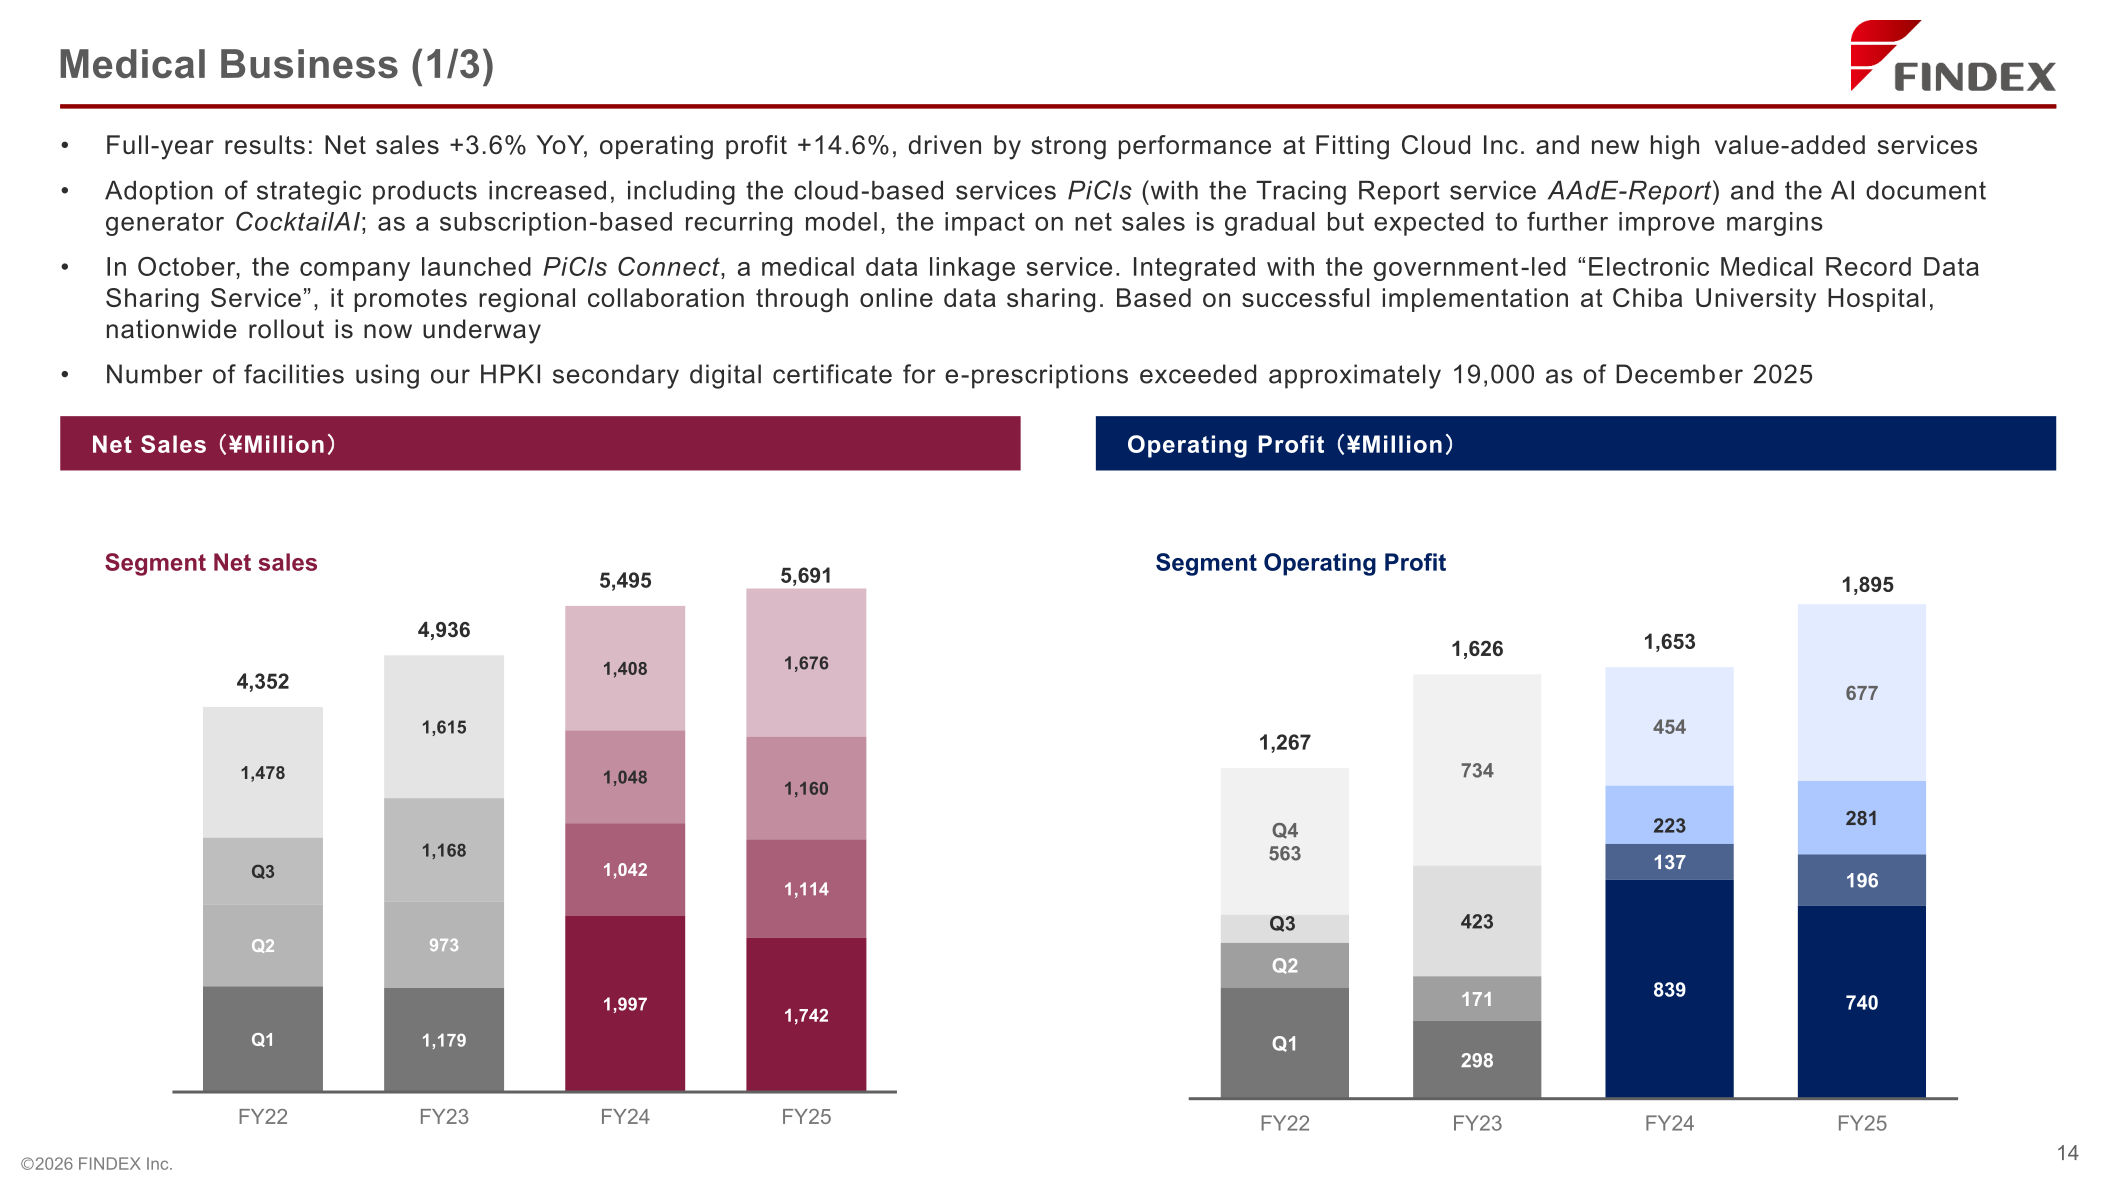
Medical Business: Net sales grew 3.6% and operating profit 14.6%, driven by strong performance at Fitting Cloud Inc. and new high value-added services. Adoption of strategic products increased, including the cloud-based services PiCls (with the Tracing Report service AAdE-Report) and the AI document generator CocktailAI; as a subscription-based recurring model, the impact on net sales is gradual but is expected to further improve margins. In October, the company launched PiCls Connect, a medical data linkage service integrated with the government-led “Electronic Medical Record Data Sharing Service”; based on its implementation at Chiba University Hospital, a nationwide rollout is underway. The number of facilities using the company’s HPKI secondary digital certificate for e-prescriptions exceeded approximately 19,000 as of December 2025. Medical system users totaled 2,246 facilities at the end of Q4 FY2025 (Q3 FY2025: 2,215), including 308 large hospitals, 345 medium-sized hospitals, 93 small hospitals and 1,441 clinics.
Public Sector Business: Net sales rose 22.7% and operating profit 8.6%, and monthly recurring revenue grew approximately fivefold from 2022 to 2025. The company explained that despite strong net sales growth, operating profit remained roughly flat year on year due to a further increase in the share of monthly recurring revenue. User facilities of the DocuMaker Office document management system rose from 48 at the end of FY2024 to 68 at the end of FY2025, with the largest increase among small facilities (up to 299 employees), from 24 to 34.
Health Tech Business: Net sales were ¥63 million (+11.4%) and the operating loss was ¥215 million, compared with a ¥229 million loss in the previous year. Costs included inventory write-downs (¥14 million) and the expansion of the AI analytics team analyzing medical data, but the increase in the loss was limited by revenue growth. Sales of GAP (Gaze Analyzing Perimeter) totaled 58 units, including overseas shipments in Q3. The company launched the Medical Data Platform Business within the segment and, in October 2025, was certified by the Cabinet Office as an Enterprise Certified for Entrustment with Handling Medical and Other Data; investments have been completed, with full-scale operations starting next fiscal year. Development of new GAP features has been completed, and MCI (Mild Cognitive Impairment) research is progressing toward clinical trials.
FY2026 Forecast
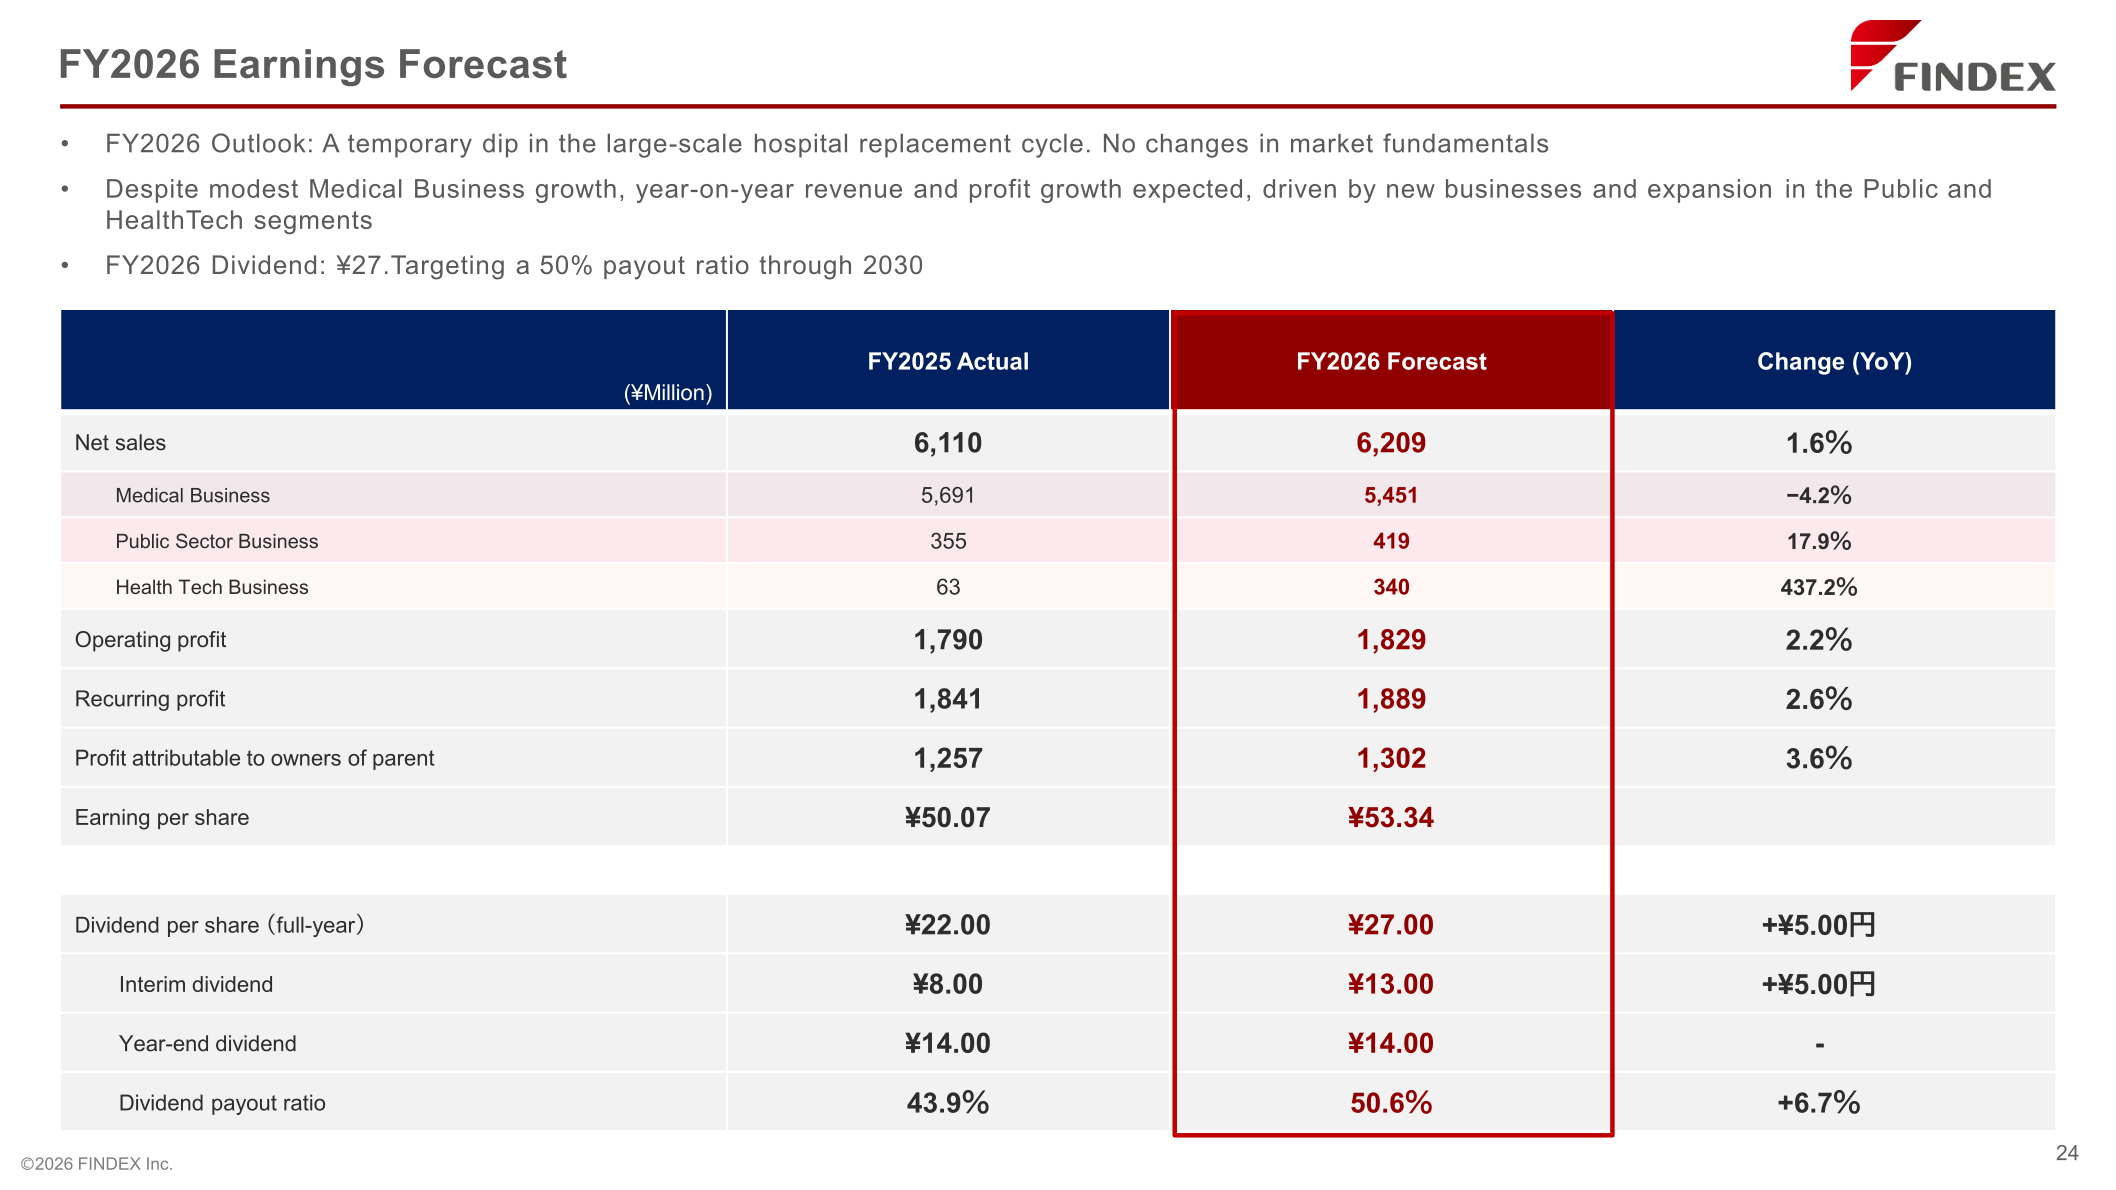
For FY2026, the company forecasts net sales of ¥6,209 million (+1.6%) and operating profit of ¥1,829 million (+2.2%). It describes FY2026 as a temporary dip in the large-scale hospital replacement cycle, with no changes in market fundamentals, and expects Medical Business net sales to decline 4.2% while the Public Sector and Health Tech segments expand. The company noted that the high order backlog as of Q4 2025 includes a significant number of projects scheduled to go live in 2027, and that FY2026 serves as a preparation period for FY2027 and will have no impact on its long-term growth.
| Item (¥ million) | FY2025 Actual | FY2026 Forecast | Change (YoY) |
|---|---|---|---|
| Net sales | 6,110 | 6,209 | 1.6% |
| Medical Business | 5,691 | 5,451 | −4.2% |
| Public Sector Business | 355 | 419 | 17.9% |
| Health Tech Business | 63 | 340 | 437.2% |
| Operating profit | 1,790 | 1,829 | 2.2% |
| Recurring profit | 1,841 | 1,889 | 2.6% |
| Profit attributable to owners of parent | 1,257 | 1,302 | 3.6% |
| Earnings per share | ¥50.07 | ¥53.34 | — |
By segment, the Medical Business plans to accelerate the rollout of cloud services at large-scale institutions, including add-on workflow support services such as CocktailAI and the PiCls series, and to promote cloud-based EMR and documentation support (REMORA Cloud and DocuMaker Cloud) at clinics. The Public Sector Business will continue developing agency partnerships, expand feature sets and implement multi-channel marketing. The Health Tech Business will drive projects for the utilization of EMR data through the Medical Data Platform, execute a revised domestic medical device sales plan and accelerate international sales.
Shareholder Returns
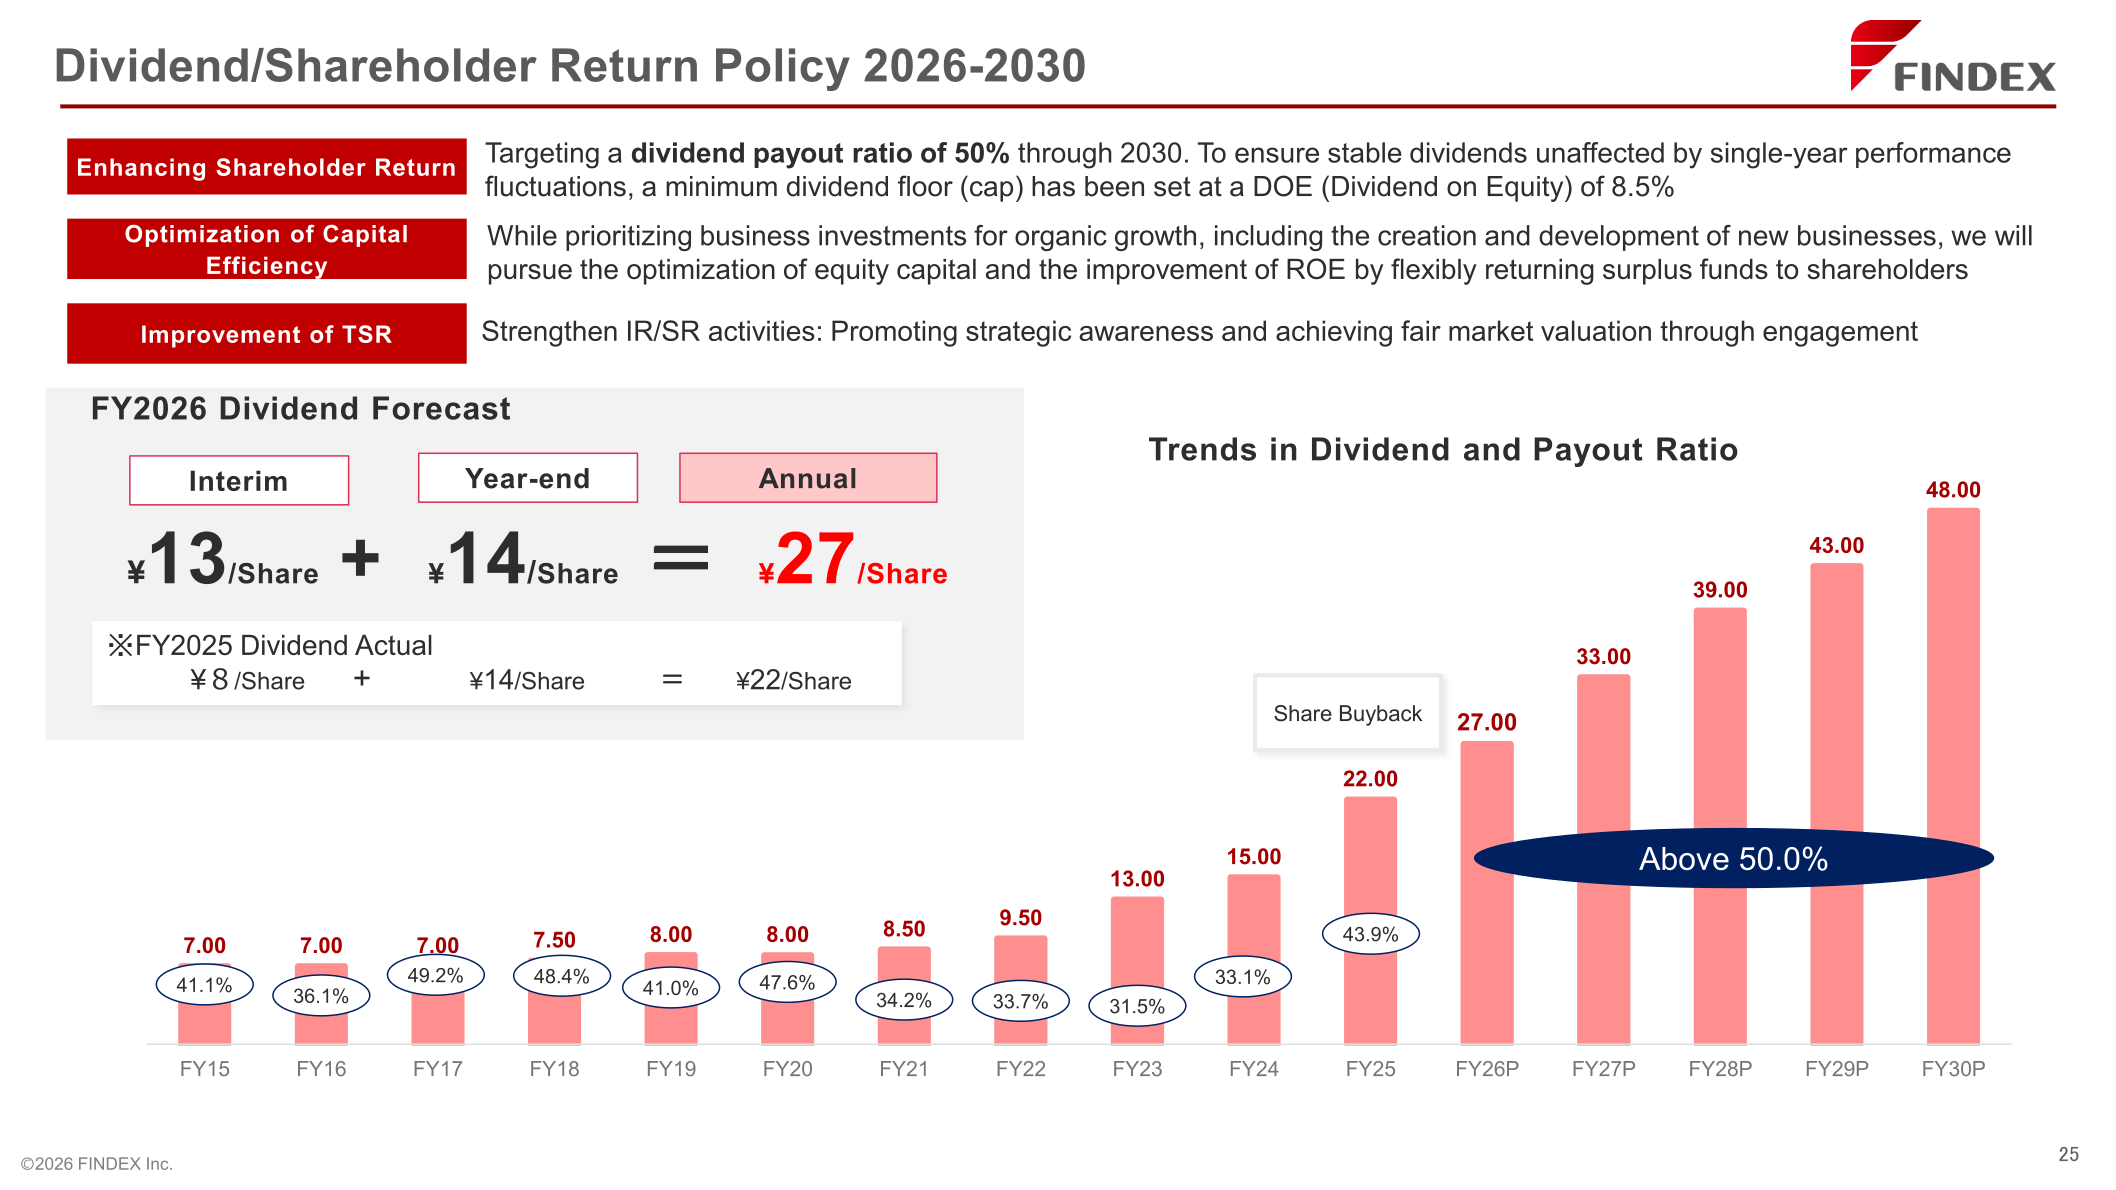
The FY2025 annual dividend was ¥22.00 per share (interim ¥8.00, year-end ¥14.00), for a payout ratio of 43.9%; the company states that it increased the year-end dividend by ¥5.0. For FY2026, it forecasts an annual dividend of ¥27.00 per share (interim ¥13.00, year-end ¥14.00), an increase of ¥5.00, with a payout ratio of 50.6%. The company focused on growth investments while executing shareholder returns through share repurchases during the fiscal year.
| Dividend per share | FY2025 Actual | FY2026 Forecast | Change |
|---|---|---|---|
| Interim | ¥8.00 | ¥13.00 | +¥5.00 |
| Year-end | ¥14.00 | ¥14.00 | – |
| Full-year | ¥22.00 | ¥27.00 | +¥5.00 |
| Dividend payout ratio | 43.9% | 50.6% | +6.7% |
Under the Dividend/Shareholder Return Policy 2026-2030, FINDEX targets a dividend payout ratio of 50% through 2030. To ensure stable dividends unaffected by single-year performance fluctuations, a minimum dividend floor has been set at a DOE (Dividend on Equity) of 8.5%. While prioritizing business investments for organic growth, including the creation and development of new businesses, the company will pursue the optimization of equity capital and the improvement of ROE by flexibly returning surplus funds to shareholders, and it aims to improve TSR by strengthening IR/SR activities.
Growth Strategy 2026-2030
The “Growth Strategy and Shareholder Return Policy 2026-2030” presented in the materials shows plan figures rising from net sales of ¥6,209 million and operating profit of ¥1,829 million in 2026E to net sales of ¥8,520 million and operating profit of ¥3,220 million in 2030P. In its review of the FY2025 management strategy, the company said it actively expanded mid-career hiring and further promoted systemization and AI utilization, resolving near-term labor shortages, and enhanced the client value proposition of high value-added cloud-based products, achieving further margin improvement. It also shifted its investment priority from M&A to the growth of existing and new businesses.
This article is an analysis based on publicly available information and is not a recommendation to buy or sell any specific securities. Investment decisions are your own responsibility.
















