
This article is based on publicly available IR materials and is not a recommendation to buy or sell any specific securities.
Note: J.S.B. does not publish an English results presentation; this article is an English translation of the Japanese-language article on our sister site Investalk, which is based on the company’s Japanese-language IR materials (the results briefing materials for the most recent full fiscal year), with figures transcribed as reported. J.S.B.’s fiscal year ends in October; following this site’s convention, the fiscal year ended October 2025 is classified as FY2025, while the body text and tables below keep the company’s own labels (FY10/2025 = fiscal year ended October 2025; FY10/2026 = fiscal year ending October 2026).
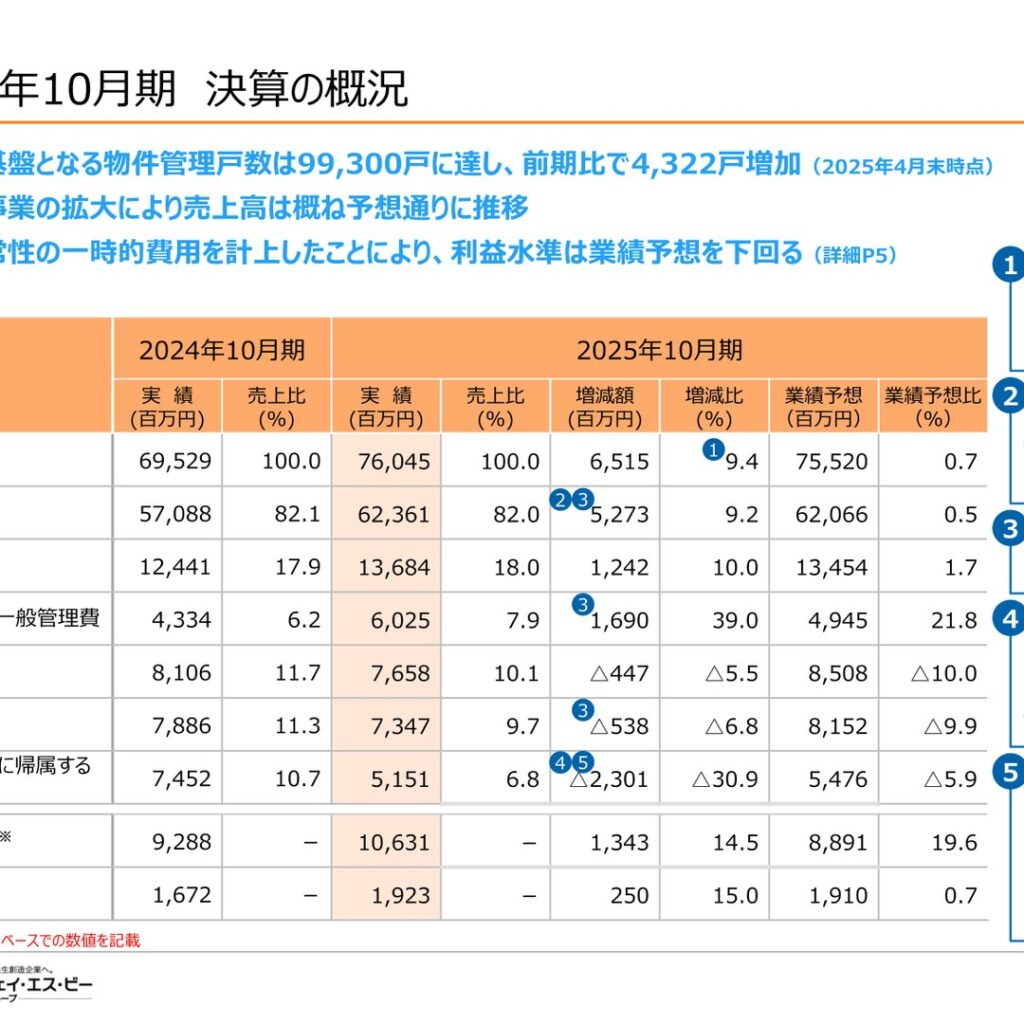
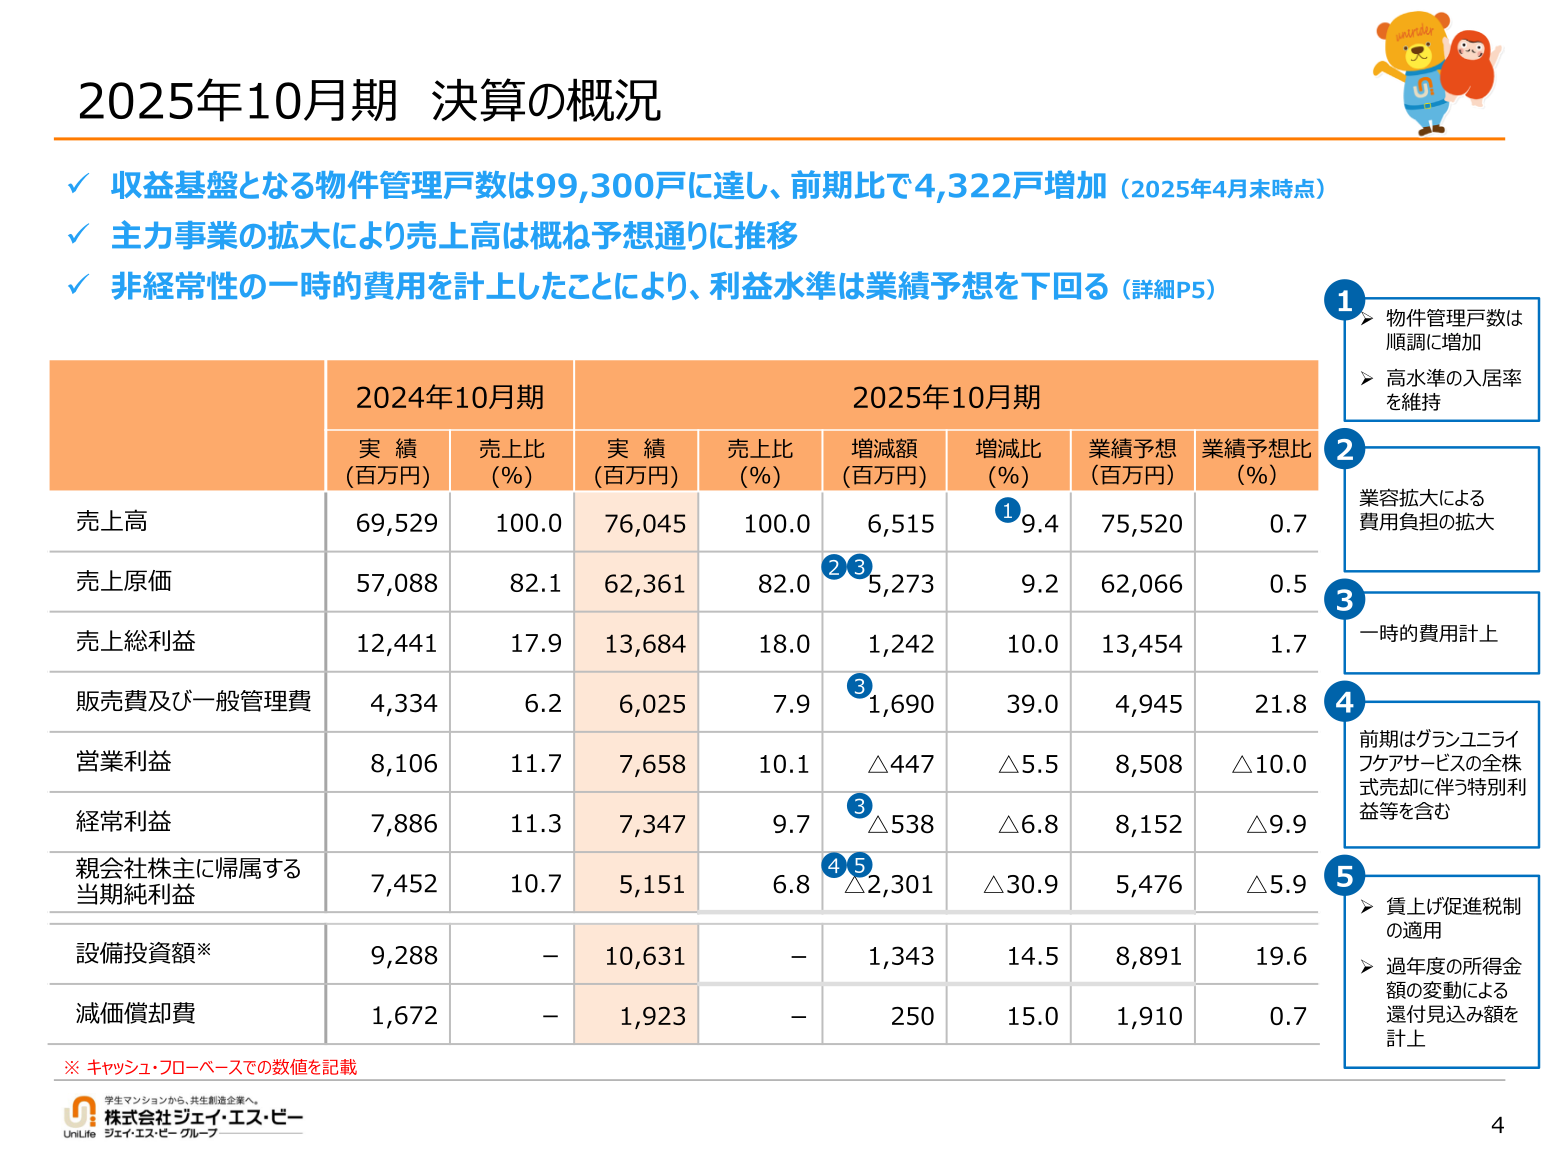
J.S.B. Co., Ltd. reported consolidated results for FY10/2025 of net sales of 76,045 million yen (up 9.4% year on year), operating profit of 7,658 million yen (down 5.5%), ordinary profit of 7,347 million yen (down 6.8%) and profit attributable to owners of parent of 5,151 million yen (down 30.9%). Although net sales grew on the expansion of the mainstay real estate rental management business, non-recurring one-off expenses totaling approximately 1,349 million yen, including lump-sum payments to employees and the booking of an estimated amount for additional tax liabilities, caused profit to fall below the earnings forecast. Excluding the one-off expenses, adjusted operating profit was 8,893 million yen, ordinary profit 8,697 million yen and net profit 6,080 million yen, levels that the company says would have exceeded the earnings forecast. For FY10/2026, the company expects a substantial increase in profit, partly reflecting the rebound from the one-off expenses recorded in the previous year.
Consolidated Results (FY10/2025 Actual)
For FY10/2025, consolidated net sales were 76,045 million yen (up 9.4% year on year; 100.0% of sales), cost of sales was 62,361 million yen (up 9.2%), gross profit was 13,684 million yen (up 10.0%; 18.0% of sales), and selling, general and administrative expenses were 6,025 million yen (up 39.0%; 7.9% of sales). Operating profit was 7,658 million yen (down 5.5%; 10.1% of sales), ordinary profit was 7,347 million yen (down 6.8%; 9.7% of sales), and profit attributable to owners of parent was 5,151 million yen (down 30.9%; 6.8% of sales), all falling short of the earnings forecast (operating profit 8,508 million yen, ordinary profit 8,152 million yen, net profit 5,476 million yen). Capital expenditure was 10,631 million yen (up 14.5%) and depreciation was 1,923 million yen (up 15.0%).
| Item (¥ million) | FY10/2025 (Actual) | FY10/2024 (Actual) | Change | Change (%) |
|---|---|---|---|---|
| Net sales | 76,045 | 69,529 | +6,515 | +9.4% |
| Cost of sales | 62,361 | 57,088 | +5,273 | +9.2% |
| Gross profit | 13,684 | 12,441 | +1,242 | +10.0% |
| Selling, general and administrative expenses | 6,025 | 4,334 | +1,690 | +39.0% |
| Operating profit | 7,658 | 8,106 | △447 | △5.5% |
| Ordinary profit | 7,347 | 7,886 | △538 | △6.8% |
| Profit attributable to owners of parent | 5,151 | 7,452 | △2,301 | △30.9% |
Occupancy-Related Indicators (Real Estate Rental Management Business)
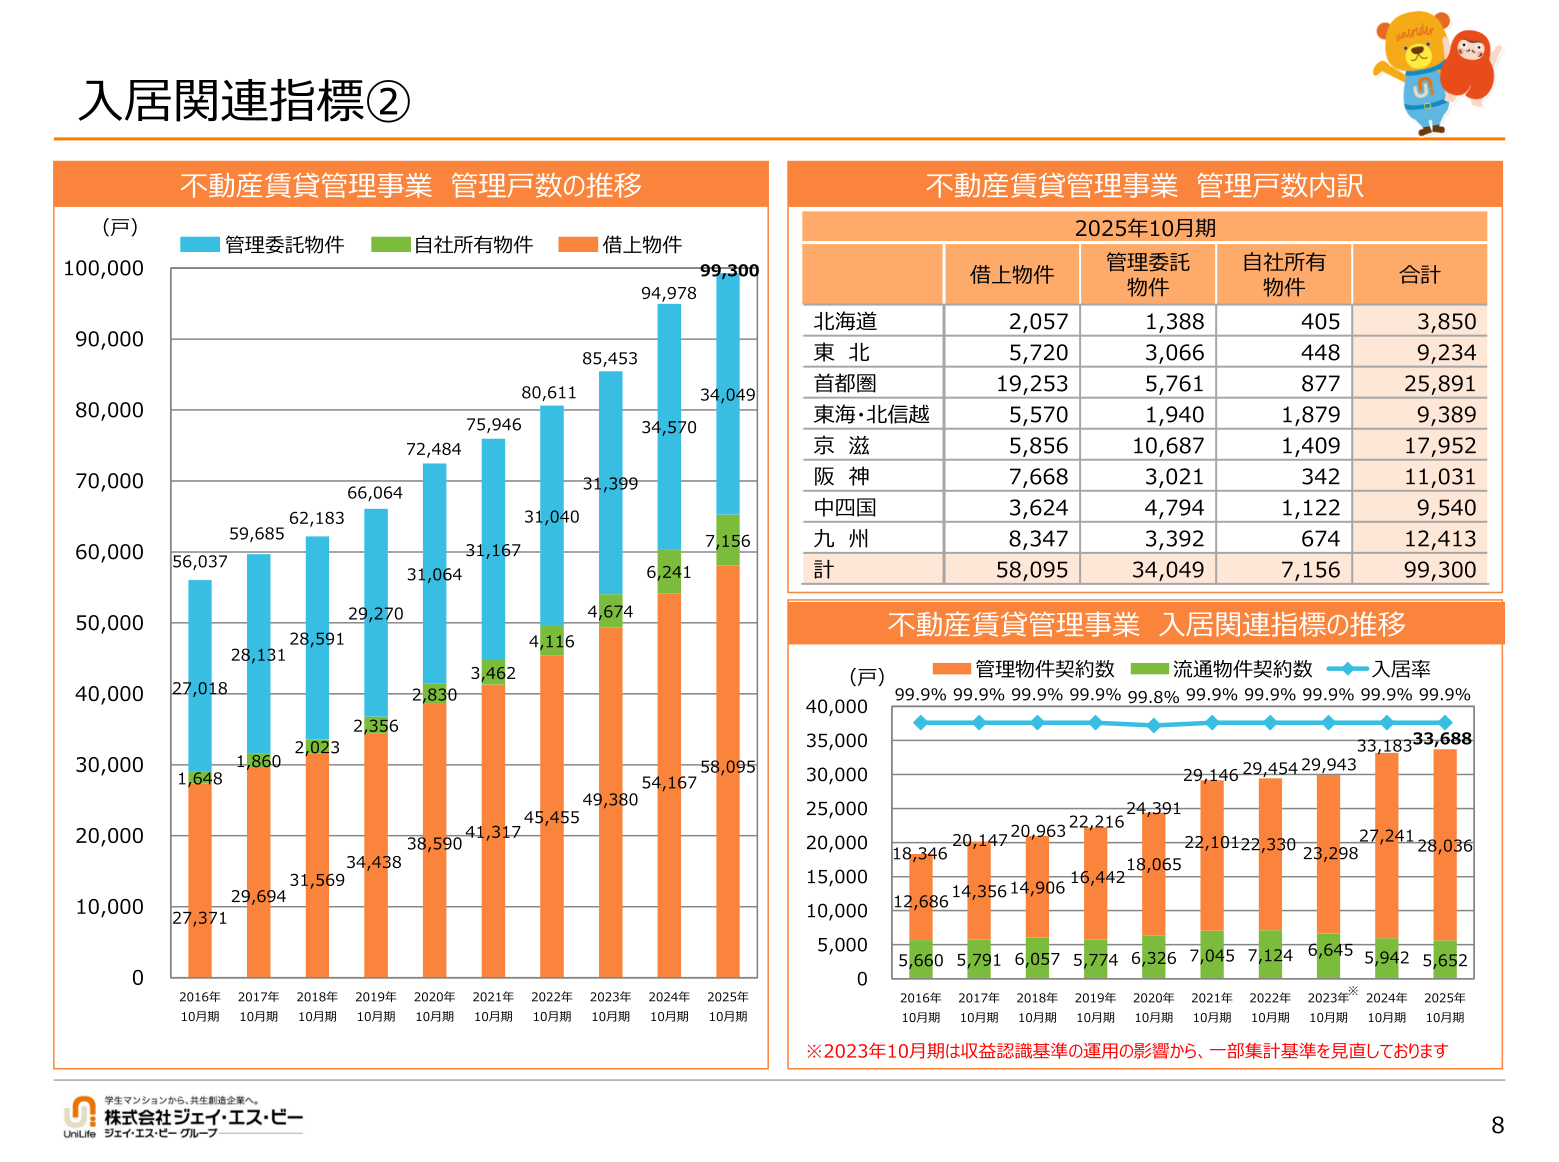
The number of managed units, the company’s revenue base, reached 99,300, an increase of 4,322 units (up 4.6%) from the previous year. By type, master-leased properties numbered 58,095 units (up 3,928 units, or 7.3%), properties under management contracts 34,049 units (down 521 units, or 1.5%), and company-owned properties 7,156 units (up 915 units, or 14.7%). The occupancy rate remained at a high 99.9%, the same level as the previous year. The number of contracts concluded was 33,688 (up 505, or 1.5%), of which 28,036 were for properties managed by the company (up 795, or 2.9%).
| Category | FY10/2025 | FY10/2024 | Change | Change (%) |
|---|---|---|---|---|
| Managed units (units) | 99,300 | 94,978 | +4,322 | +4.6% |
| Master-leased properties (units) | 58,095 | 54,167 | +3,928 | +7.3% |
| Properties under management contracts (units) | 34,049 | 34,570 | △521 | △1.5% |
| Company-owned properties (units) | 7,156 | 6,241 | +915 | +14.7% |
| Occupancy rate (%) | 99.9 | 99.9 | 0.0pt | – |
| Contracts concluded (contracts) | 33,688 | 33,183 | +505 | +1.5% |
Full-Year Forecast (FY10/2026)
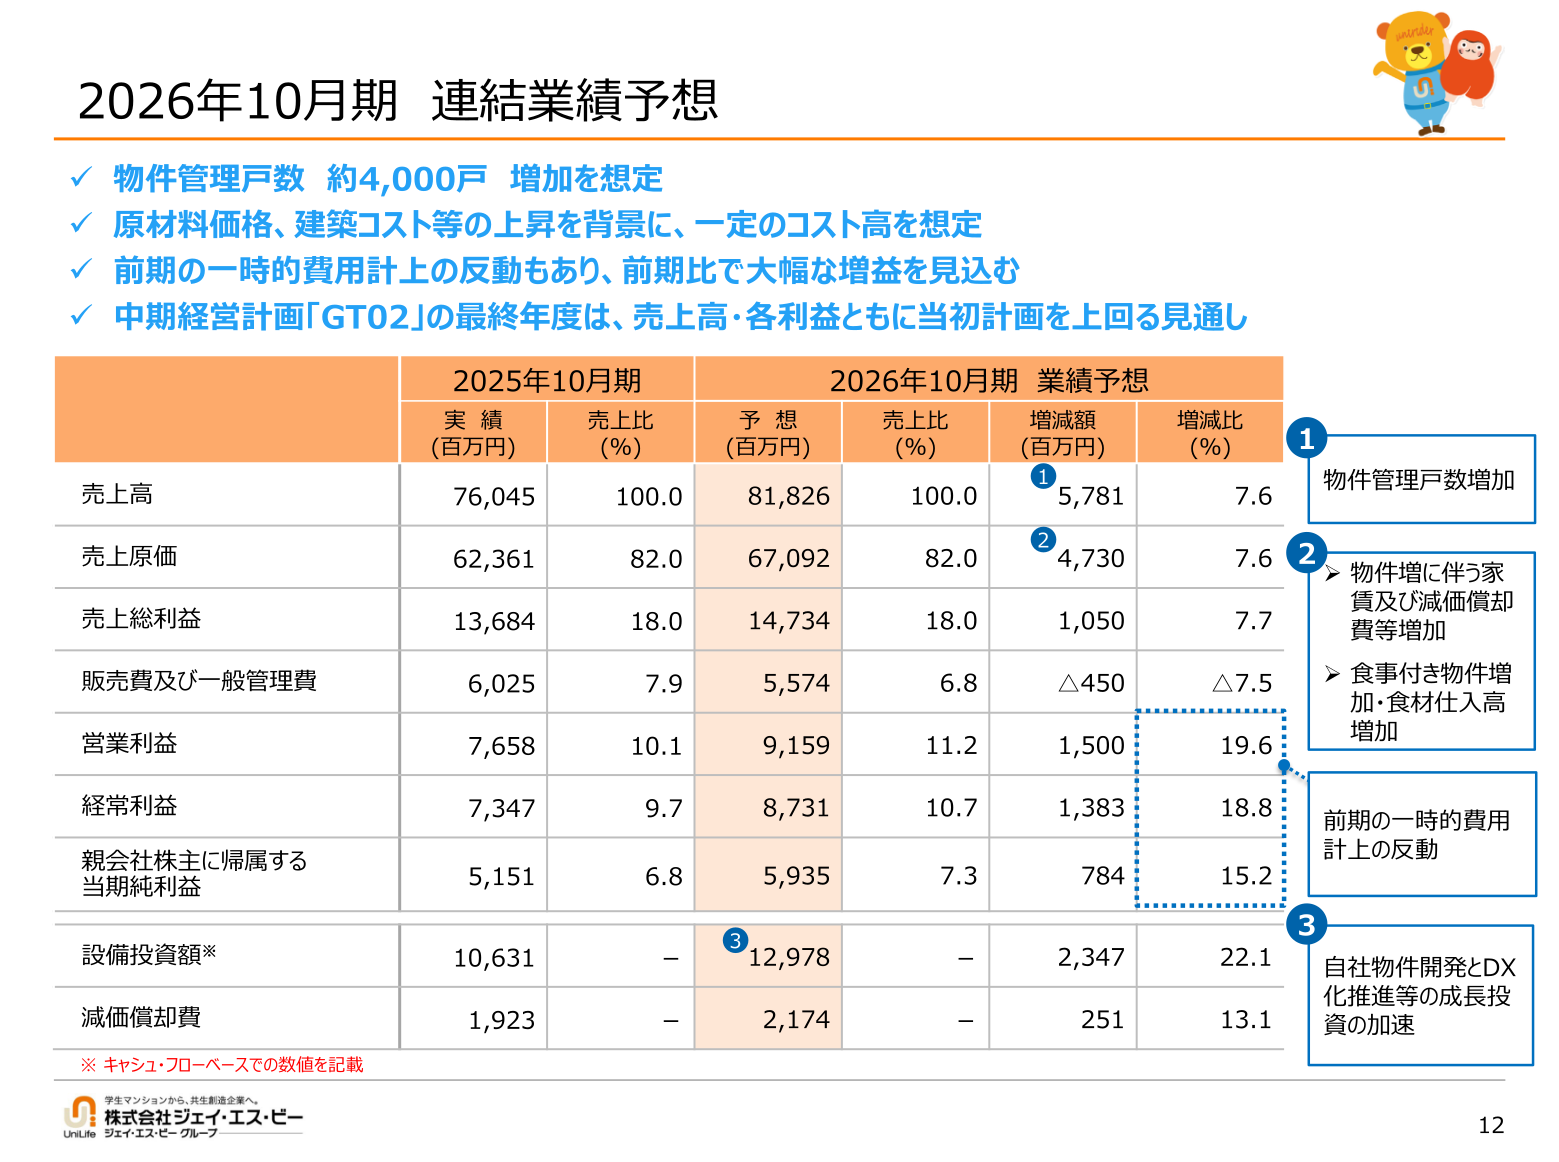
For FY10/2026, the company forecasts consolidated net sales of 81,826 million yen (up 7.6% year on year), cost of sales of 67,092 million yen (up 7.6%), gross profit of 14,734 million yen (up 7.7%), and selling, general and administrative expenses of 5,574 million yen (down 7.5%). It projects operating profit of 9,159 million yen (up 19.6%), ordinary profit of 8,731 million yen (up 18.8%) and profit attributable to owners of parent of 5,935 million yen (up 15.2%), expecting a substantial profit increase partly reflecting the rebound from the one-off expenses recorded in the previous year. The company assumes an increase of approximately 4,000 managed units, while expecting a certain degree of higher costs due to rising raw material prices, construction costs and other factors. For FY10/2026, the final year of the medium-term management plan “GT02,” net sales and each profit line are expected to exceed the initial plan.
| Item (¥ million) | FY10/2026 (Forecast) | FY10/2025 (Actual) | Change | Change (%) |
|---|---|---|---|---|
| Net sales | 81,826 | 76,045 | +5,781 | +7.6% |
| Cost of sales | 67,092 | 62,361 | +4,730 | +7.6% |
| Gross profit | 14,734 | 13,684 | +1,050 | +7.7% |
| Selling, general and administrative expenses | 5,574 | 6,025 | △450 | △7.5% |
| Operating profit | 9,159 | 7,658 | +1,500 | +19.6% |
| Ordinary profit | 8,731 | 7,347 | +1,383 | +18.8% |
| Profit attributable to owners of parent | 5,935 | 5,151 | +784 | +15.2% |
Shareholder Returns
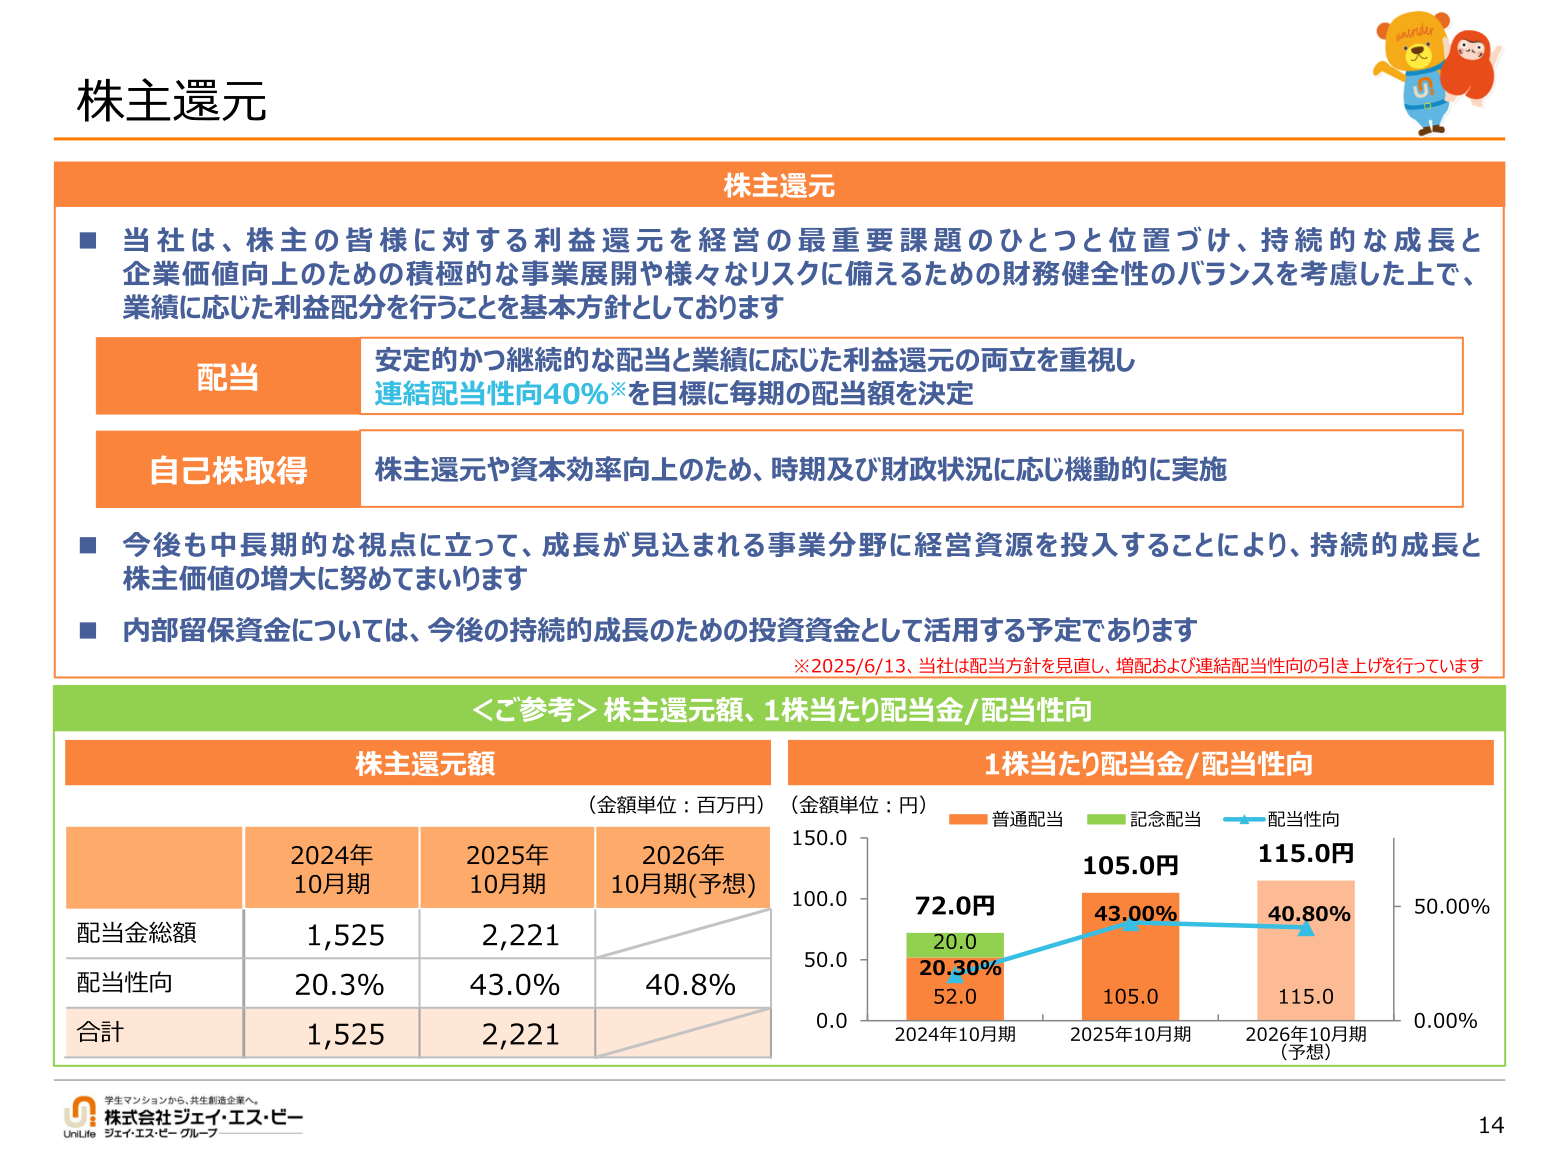
The company regards returning profits to shareholders as one of its most important management priorities, and its basic policy is to distribute profits in line with business performance. Its policy is to determine the dividend amount each fiscal year with a target consolidated payout ratio of 40%; on June 13, 2025, it revised its dividend policy, raising the dividend and increasing the consolidated payout ratio. The dividend per share was 72.0 yen for FY10/2024 (payout ratio 20.3%) and 105.0 yen for FY10/2025 (payout ratio 43.0%), and is forecast at 115.0 yen for FY10/2026 (payout ratio 40.8%). The company states that it will acquire treasury shares flexibly, depending on timing and its financial position, for the purpose of shareholder returns and improving capital efficiency.
| Item | FY10/2024 | FY10/2025 | FY10/2026 (Forecast) |
|---|---|---|---|
| Dividend per share (yen) | 72.0 | 105.0 | 115.0 |
| Payout ratio (%) | 20.3 | 43.0 | 40.8 |
| Total dividends (¥ million) | 1,525 | 2,221 | Not disclosed |
Progress of the Medium-Term Management Plan “GT02”
Under the medium-term management plan “GT02” (November 2023 to October 2026), the company continues to promote operational and organizational reforms aimed at improving productivity, and states that the plan is progressing smoothly. In FY10/2025, the ratio of women in management positions was 16.3% and the rate of childcare leave taken by male employees was 60.0%, both achieving the medium-term management plan targets one year ahead of schedule. Regarding the case of improper expense processing by an officer that came to light in 2025, the company had largely implemented during the fiscal year the recurrence prevention measures formulated on January 14, 2025, and states that it will continue to promote their ongoing operation.
This article is an analysis based on publicly available information and is not a recommendation to buy or sell any specific securities. Investment decisions are your own responsibility.
















