
This article is based on publicly available IR materials and is not a recommendation to buy or sell any specific securities.
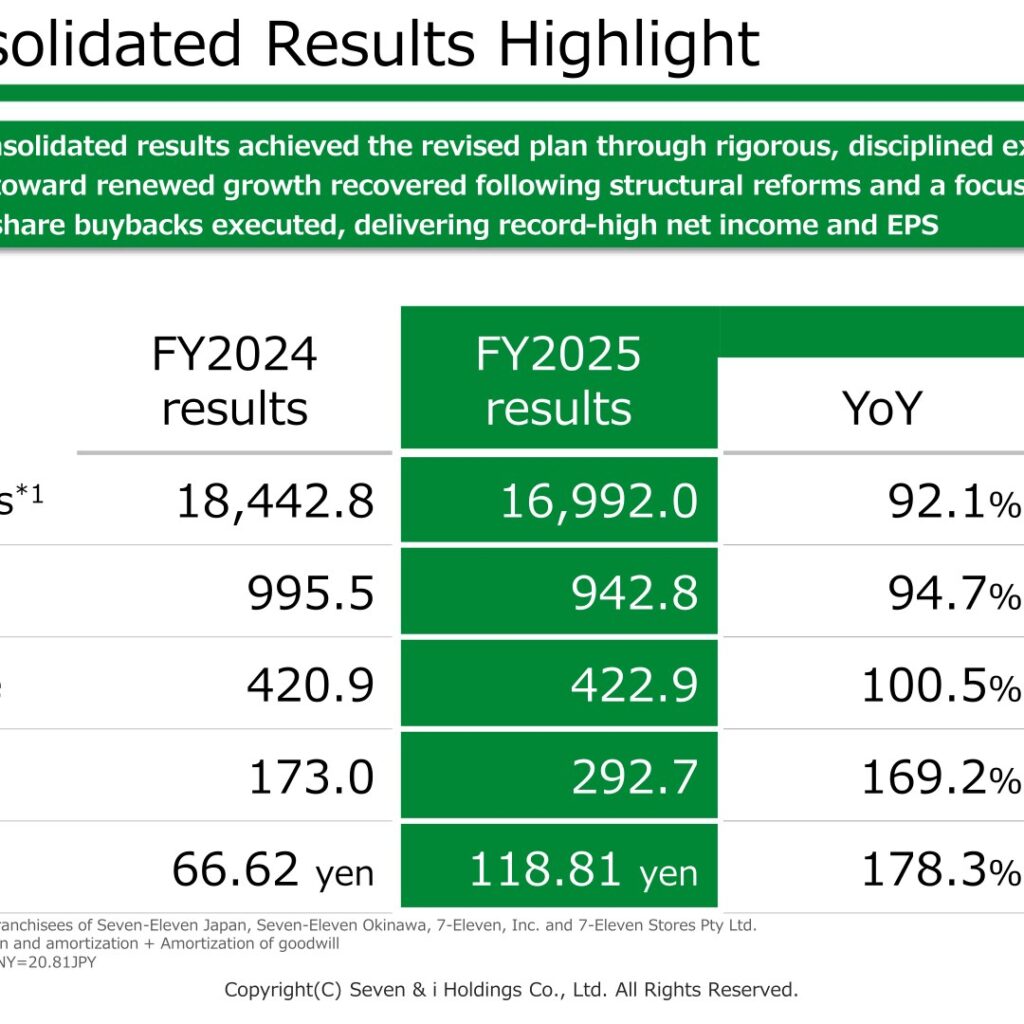
Seven & i Holdings Co., Ltd. reported FY2025 consolidated results (fiscal year ended February 28, 2026, as labeled in the company’s presentation, which covers the period from FY2024 results through FY2025 results) with Group’s total sales of ¥16,992.0Bn (92.1% YoY, 99.5% vs. plan), EBITDA of ¥942.8Bn (94.7% YoY, 102.2% vs. plan), and operating income of ¥422.9Bn (100.5% YoY, 104.7% vs. plan). Net income attributable to owners of parent reached ¥292.7Bn (169.2% YoY, 108.4% vs. plan), a record high, with EPS of ¥118.81 (178.3% YoY, 108.4% vs. plan). During FY2025 the company completed the deconsolidation of York HD and Seven Bank and completed a ¥600Bn share buyback, as part of a shift toward a pure convenience store business focus.
Consolidated Results (Full-Year Actual)
The table below summarizes full-year consolidated results for FY2025 versus FY2024, including YoY and vs.-plan comparisons, as disclosed in the company’s FY2025 Consolidated Results Highlight slides (Billions of yen, %; EPS in yen; exchange rate FY2025: 1USD=149.61JPY, 1CNY=20.81JPY).
| Item | FY2024 | FY2025 | YoY | YoY Change | vs. Plan | vs. Plan Change |
|---|---|---|---|---|---|---|
| Group’s total sales | 18,442.8 | 16,992.0 | 92.1% | (1,450.7) | 99.5% | (93.9) |
| Revenues from operations | 11,972.7 | 10,430.2 | 87.1% | (1,542.4) | 98.8% | (129.7) |
| Operating income | 420.9 | 422.9 | 100.5% | +2.0 | 104.7% | +18.9 |
| Ordinary income | 374.5 | 377.4 | 100.8% | +2.8 | 103.1% | +11.4 |
| Special gains | 115.7 | 142.9 | 123.5% | +27.2 | 126.0% | +29.5 |
| Special losses | 220.9 | 85.7 | 38.8% | (135.1) | 131.1% | +20.3 |
| Net income attributable to owners of parent | 173.0 | 292.7 | 169.2% | +119.6 | 108.4% | +22.7 |
| Amortization of goodwill | 137.9 | 137.8 | 100.0% | (0.04) | 101.4% | +1.8 |
| EPS (yen) | 66.62 | 118.81 | 178.3% | +52.19 | 108.4% | +9.24 |
| EPS before amortization of goodwill (yen) | 105.12 | 161.74 | 153.9% | +56.62 | 106.5% | +9.87 |
| EBITDA | 995.5 | 942.8 | 94.7% | (52.6) | 102.2% | +20.3 |
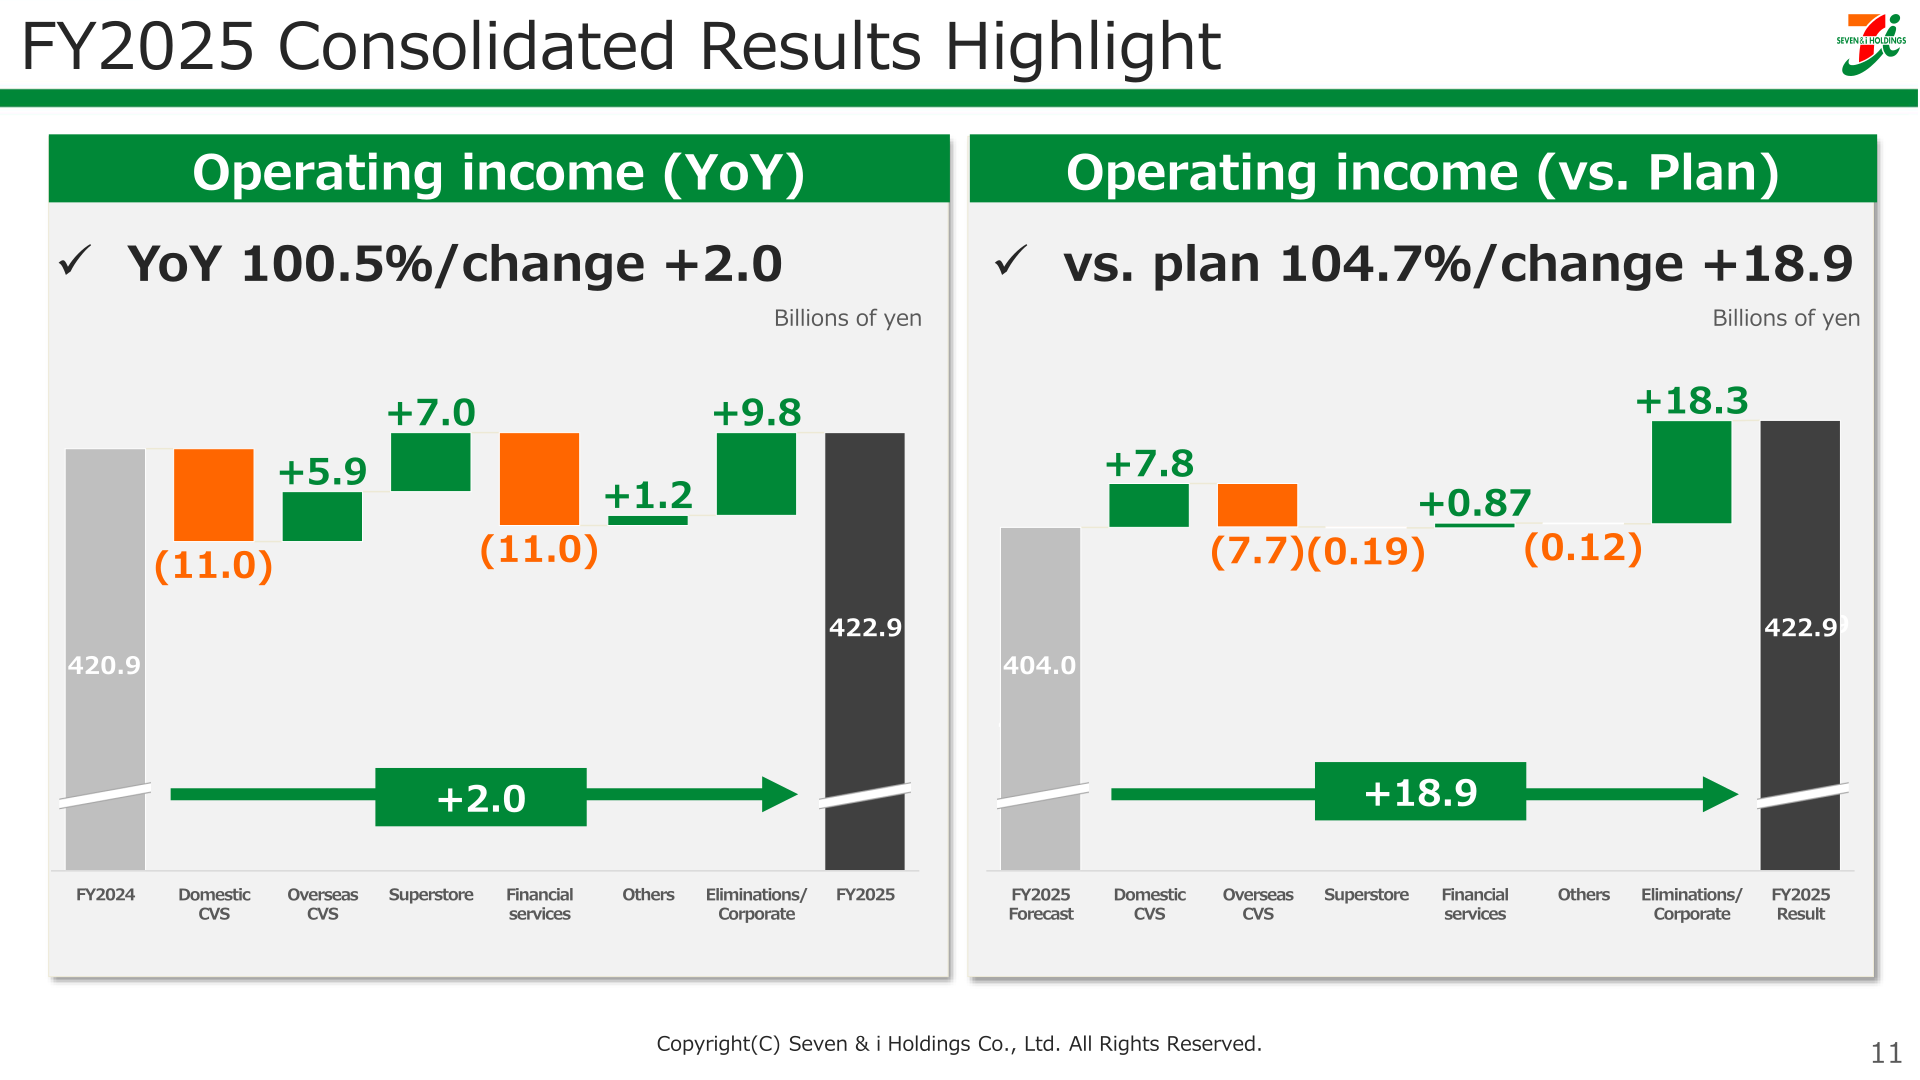
By segment, operating income YoY changes included Overseas CVS operations +¥5.9Bn and Superstore operations +¥7.0Bn, while Domestic CVS operations declined by ¥11.0Bn YoY and Financial services declined by ¥11.0Bn YoY; Eliminations/Corporate improved by +¥9.8Bn YoY, and Others improved by +¥1.2Bn YoY. On special items, special losses decreased significantly to ¥85.7Bn (38.8% YoY, change of ¥(135.1)Bn), which the company attributes to Group structural reforms implemented up to the previous year, while special gains increased to ¥142.9Bn (123.5% YoY, change of +¥27.2Bn), attributed to optimization of asset holdings.
Segment Results
FY2025 segment performance (YoY) by operating segment, based on the Revenues from Operations, Operating Income and EBITDA by Operating Segment table (Billions of yen, %; exchange rate 1USD=149.61JPY, 1CNY=20.81JPY). Figures are value, YoY%, and YoY change as disclosed.
| Segment | Revenues from operations (YoY, Change) | Operating income (YoY, Change) | EBITDA (YoY, Change) |
|---|---|---|---|
| Consolidated | 10,430.2 (87.1%, (1,542.4)) | 422.9 (100.5%, +2.0) | 942.8 (94.7%, (52.6)) |
| Domestic CVS operations | 914.5 (101.2%, +10.4) | 222.5 (95.3%, (11.0)) | 314.0 (96.7%, (10.8)) |
| Overseas CVS operations | 8,556.8 (93.3%, (613.9)) | 222.2 (102.8%, +5.9) | 581.8 (99.0%, (5.9)) |
| Superstore operations | 689.4 (48.1%, (742.6)) | 17.5 (168.2%, +7.0) | 36.1 (69.4%, (15.9)) |
| Financial services | 137.1 (64.7%, (74.9)) | 20.9 (65.5%, (11.0)) | 45.6 (63.1%, (26.7)) |
| Others | 179.7 (56.0%, (141.1)) | 6.9 (120.8%, +1.2) | 10.6 (84.6%, (1.9)) |
| Eliminations/Corporate | (47.5) (-, +19.8) | (67.2) (-, +9.8) | (45.5) (-, +8.8) |
FY2026 Forecast
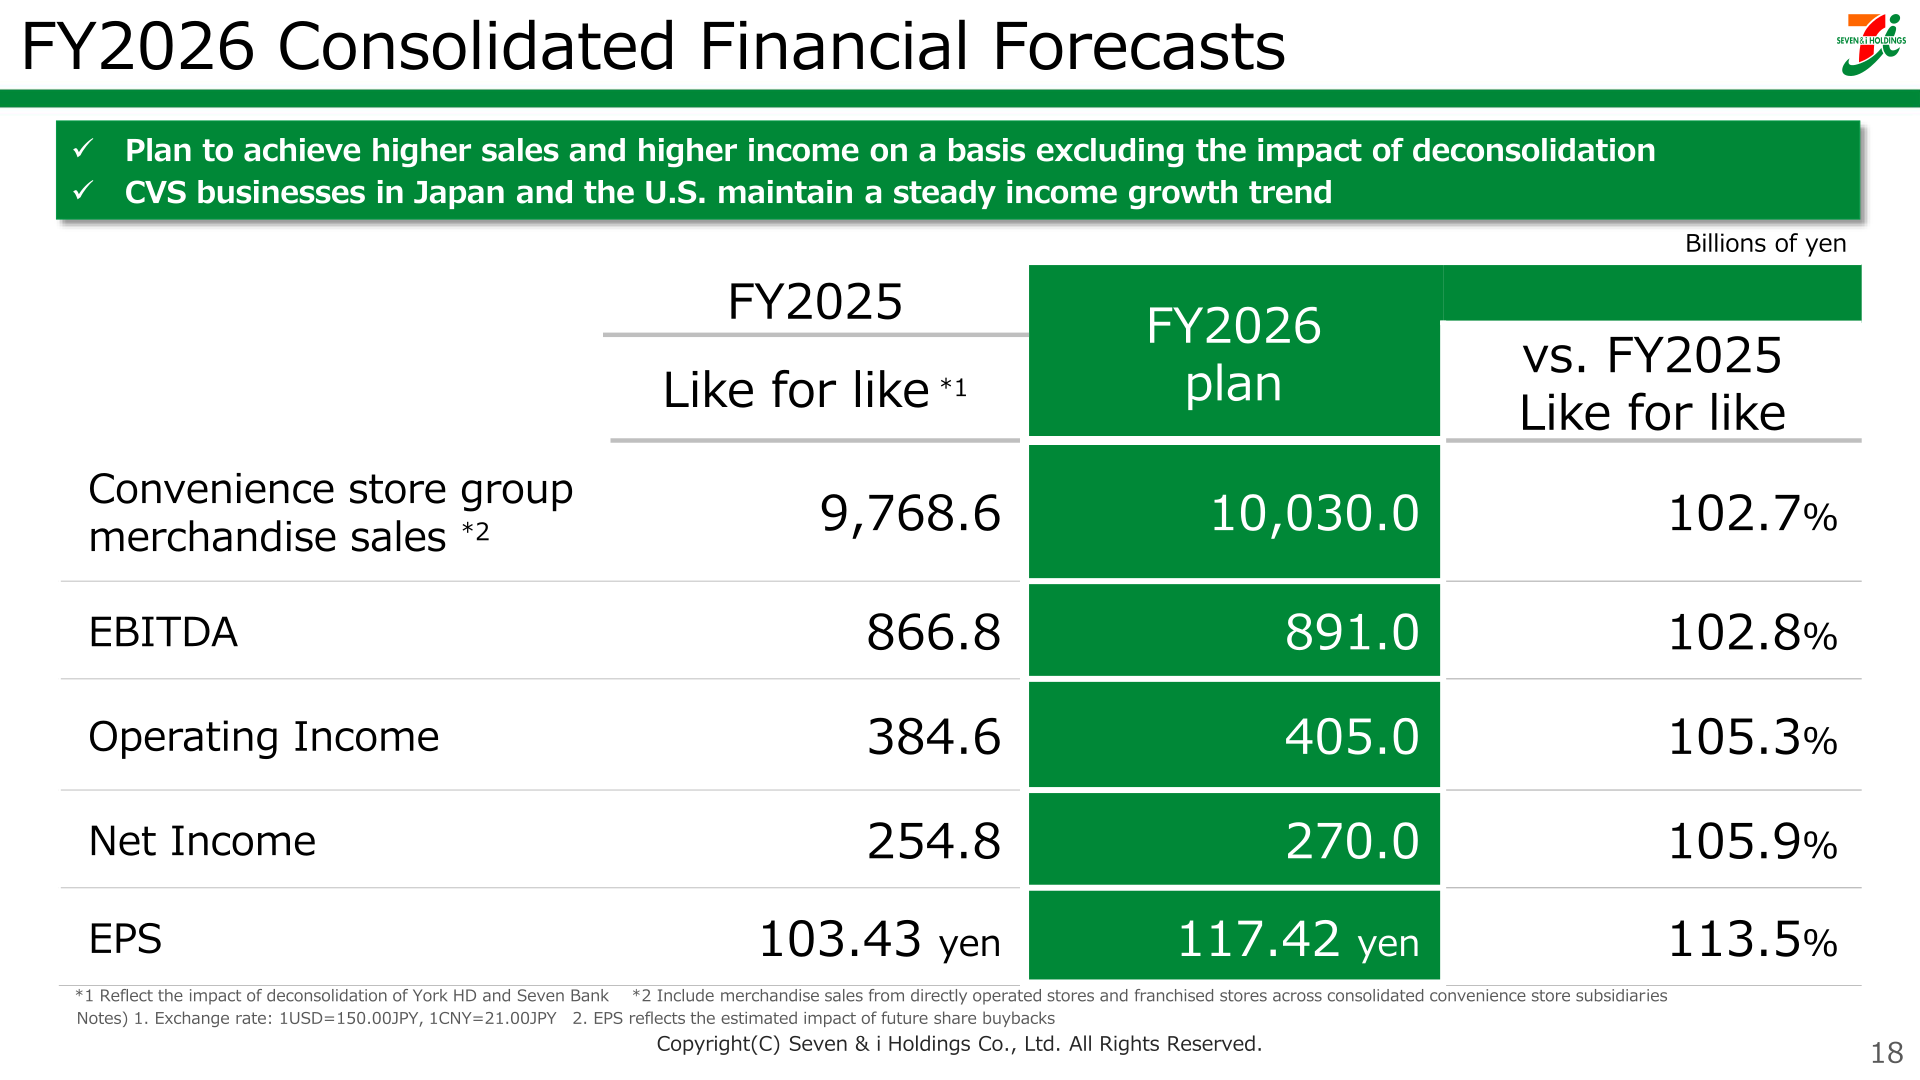
For FY2026, the company forecasts continued growth on a like-for-like basis (reflecting the deconsolidation of York HD and Seven Bank), noting that CVS businesses in Japan and the U.S. maintain a steady income growth trend and that the plan is to achieve higher sales and higher income on a basis excluding the impact of deconsolidation. FY2026 exchange rate assumptions are 1USD=150.00JPY, 1CNY=21.00JPY; EPS and EPS before amortization of goodwill reflect the estimated impact of future share buybacks.
| Item | FY2025 (like-for-like) | FY2026 Plan | YoY | YoY Change |
|---|---|---|---|---|
| Convenience store group merchandise sales | 9,768.6 | 10,030.0 | 102.7% | +261.3 |
| Revenues from operations | 9,510.3 | 9,448.0 | 99.3% | (62.3) |
| EBITDA | 866.8 | 891.0 | 102.8% | +24.1 |
| Operating income | 384.6 | 405.0 | 105.3% | +20.3 |
| Ordinary income | 352.2 | 367.0 | 104.2% | +14.7 |
| Net income attributable to owners of parent | 254.8 | 270.0 | 105.9% | +15.1 |
| EPS (yen) | 103.43 | 117.42 | 113.5% | +13.99 |
| EPS before amortization of goodwill (yen) | 145.63 | 162.56 | 111.6% | +16.93 |
On a non-like-for-like basis (i.e., versus FY2025 actual results, which included York HD and Seven Bank), FY2026 operating income is forecast at ¥405.0Bn (95.7% YoY, change of ¥(17.9)Bn) and net income attributable to owners of parent at ¥270.0Bn (92.2% YoY, change of ¥(22.7)Bn), reflecting the impact of the FY2025 deconsolidations. FY2026 forecasts by operating segment (Billions of yen, %) are summarized below.
| Segment | Revenues from operations FY2026 (YoY, Change) | Operating income FY2026 (YoY, Change) |
|---|---|---|
| Consolidated | 9,448.0 (90.6%, (982.2)) | 405.0 (95.7%, (17.9)) |
| Domestic CVS operations | 950.0 (103.9%, +35.4) | 224.2 (100.8%, +1.6) |
| Overseas CVS operations | 8,466.0 (98.9%, (90.8)) | 247.8 (111.5%, +25.5) |
| 7-Eleven, Inc. [Millions of dollar] | 51,500 (97.9%, (1,102)) | 2,375 (106.9%, +153) |
| Others | 50.0 (5.1%, (928.6)) | 1.8 (4.1%, (42.2)) |
| Eliminations/Corporate | (18.0) (-, +1.7) | (68.8) (-, (2.9)) |
Shareholder Returns
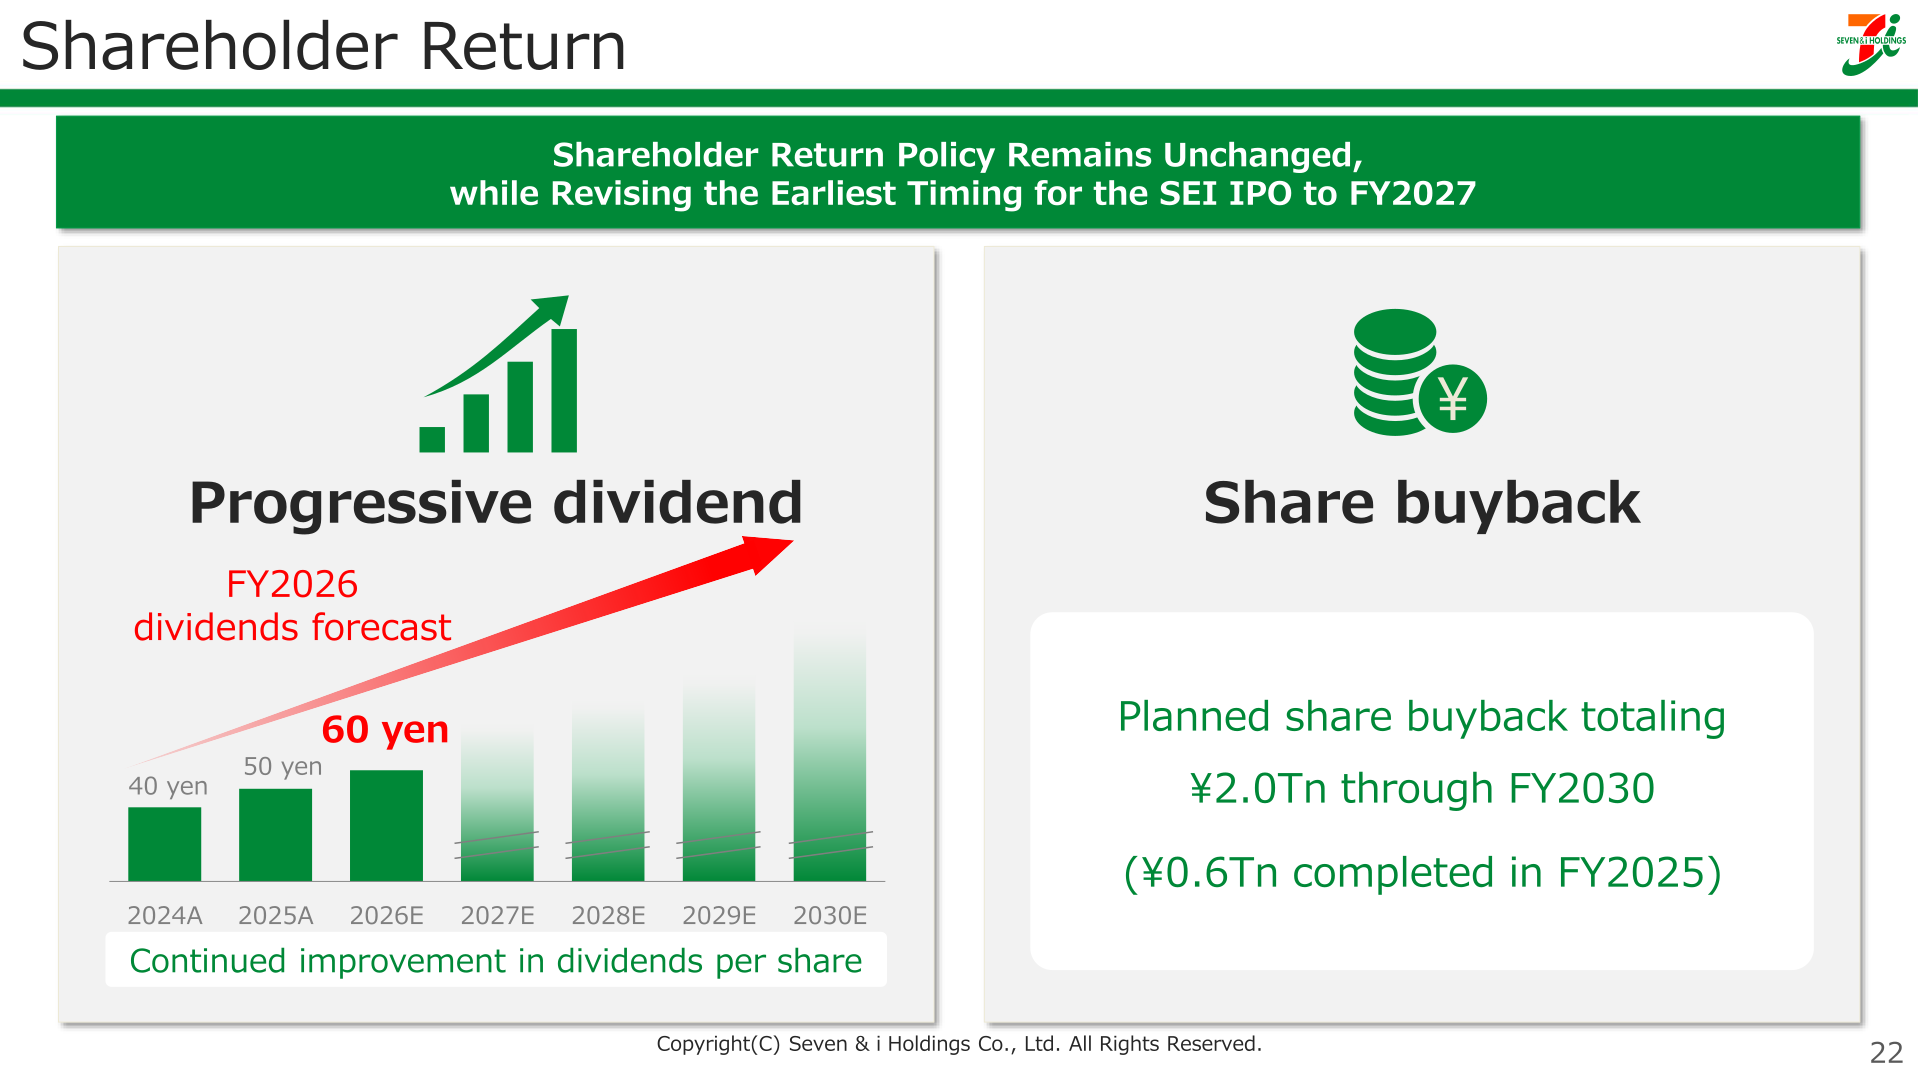
The company’s shareholder return policy remains unchanged: a planned share buyback totaling ¥2.0Tn through FY2030, of which ¥0.6Tn was completed in FY2025, together with a progressive dividend policy. Separately, the timing for the SEI (7-Eleven, Inc.) IPO has been revised to FY2027 at the earliest. The presentation’s dividend-per-share chart references figures of ¥40, ¥50 and ¥60 alongside a ‘FY2026 dividends forecast’ label spanning 2024A through 2030E, but the exact per-fiscal-year mapping is not clearly delineated in the extracted text, so specific per-share dividend amounts by year cannot be confirmed here.
Medium-Term Plan / Topics
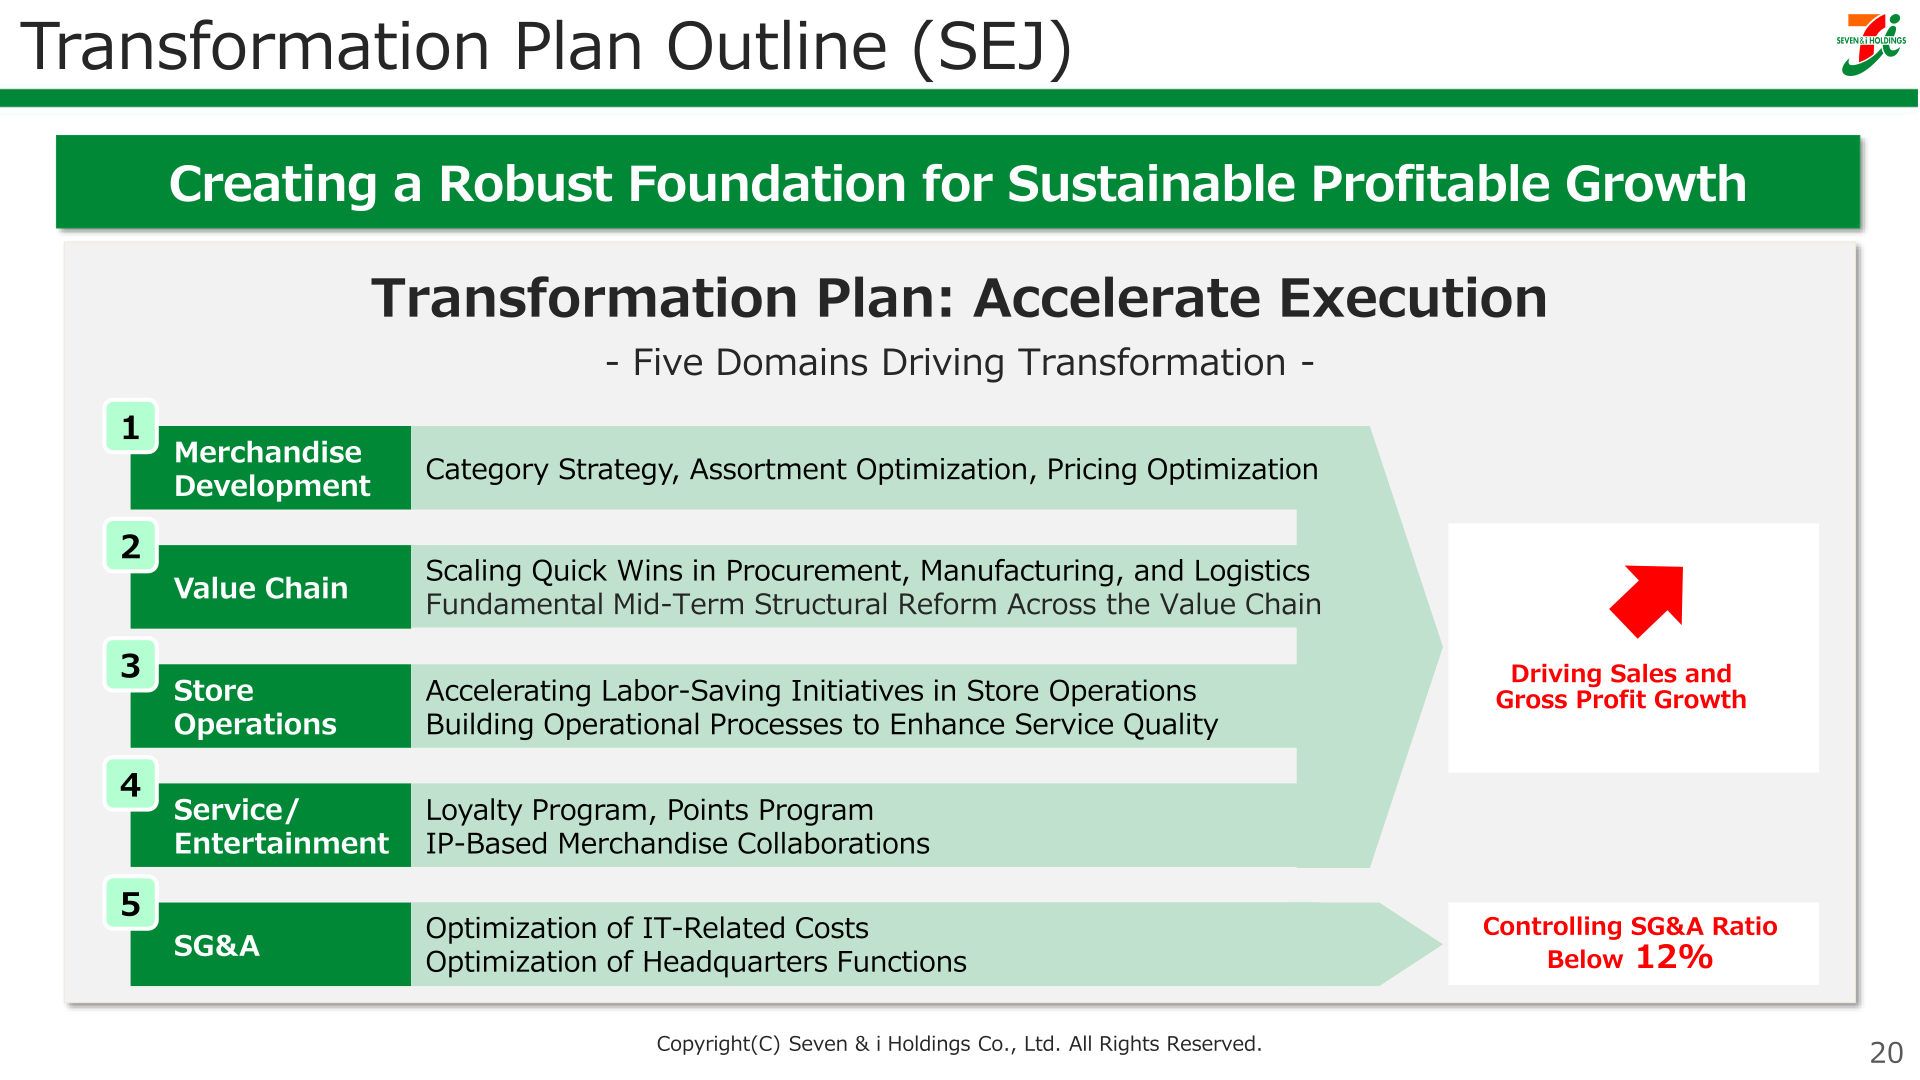
The company outlined a ‘Transformation Plan: Accelerate Execution’ organized around five domains for Seven-Eleven Japan (SEJ): (1) Merchandise Development — category strategy, assortment optimization, pricing optimization; (2) Value Chain — scaling quick wins in procurement, manufacturing and logistics, and fundamental mid-term structural reform across the value chain; (3) Store Operations — accelerating labor-saving initiatives and building operational processes to enhance service quality; (4) SG&A — optimization of IT-related costs and headquarters functions, with a goal of controlling the SG&A ratio below 12%; and (5) Service/Entertainment — loyalty and points programs and IP-based merchandise collaborations. Separately, the company presented FY2030 value-creation targets versus FY2025 (like-for-like), described as: Revenue Growth of approximately +LSD% (low-single-digit percent), Adjusted EBITDA Growth of approximately +MSD% (mid-single-digit percent), EPS Growth of approximately +High-Teens%, and Total Shareholder Return above the rate of EPS Growth, to be achieved through operating margin expansion, the ¥2.0Tn buyback plan through FY2030, and the progressive dividend policy.
This article is an analysis based on publicly available information and is not a recommendation to buy or sell any specific securities. Investment decisions are your own responsibility.
![[Obayashi] Investors’ Guide 2026 — The Complete 24-Article Breakdown](https://japan-equity.com/wp-content/uploads/2026/07/hub_cover-1024x1024.png)
![[Obayashi] IR & SR Policy — Feeding Dialogue Back into Management](https://japan-equity.com/wp-content/uploads/2026/07/p32_sq-1024x1024.jpg)
![[Obayashi] Domestic Civil Engineering — Resilience Spending Supports 9.6% Margin](https://japan-equity.com/wp-content/uploads/2026/07/p11_sq-1024x1024.jpg)
![[Obayashi] Overseas Construction — Orders Reach ¥1.2tn](https://japan-equity.com/wp-content/uploads/2026/07/p15_sq-1024x1024.jpg)
![[Obayashi] Share Price & External Ratings — vs TOPIX, ESG Index Inclusion](https://japan-equity.com/wp-content/uploads/2026/07/p40_sq-1024x1024.jpg)
![[Construction] ¥75.5tn Investment, Shrinking Workforce — Big-5 Market Share](https://japan-equity.com/wp-content/uploads/2026/07/p12_sq-1024x1024.jpg)



![[Obayashi] Capital Policy & Shareholder Returns — ROE 10%+, DOE ~5%, ¥100bn Buyback](https://japan-equity.com/wp-content/uploads/2026/07/p27_sq-1024x1024.jpg)
![[Obayashi] Reducing Cross-Shareholdings — ¥285.2bn Sold in Five Years](https://japan-equity.com/wp-content/uploads/2026/07/p29_sq-1024x1024.jpg)
![[Obayashi] ¥750bn Investment Plan — ¥300bn to Development, ¥190bn to Tech/DX](https://japan-equity.com/wp-content/uploads/2026/07/p30_sq-1024x1024.jpg)
![[Obayashi] MTP2022 KPIs — Operating Profit ~2x Target, ROE 14.4%](https://japan-equity.com/wp-content/uploads/2026/07/p25_sq-1024x1024.jpg)
![[Obayashi] Cash Allocation — ¥420bn Investment CF Over Five Years](https://japan-equity.com/wp-content/uploads/2026/07/p26_sq-1024x1024.jpg)
![[Obayashi] Green Energy — 44 Plants, 344MW, and the Green Hydrogen Challenge](https://japan-equity.com/wp-content/uploads/2026/07/p21_sq-1024x1024.jpg)
![[Obayashi] Tackling the Labor Shortage — Robotics Construction®](https://japan-equity.com/wp-content/uploads/2026/07/p14_sq-1024x1024.jpg)
