
This article is based on publicly available IR materials and is not a recommendation to buy or sell any specific securities.
Note: Hotland Holdings does not publish an English results presentation; this article is an English translation of the Japanese-language article on our sister site Investalk, which is based on the company’s Japanese-language IR materials, with figures transcribed as reported. Hotland Holdings has a December fiscal year-end, so the latest completed full year is the fiscal year ended December 2025 (classified here as FY2025).
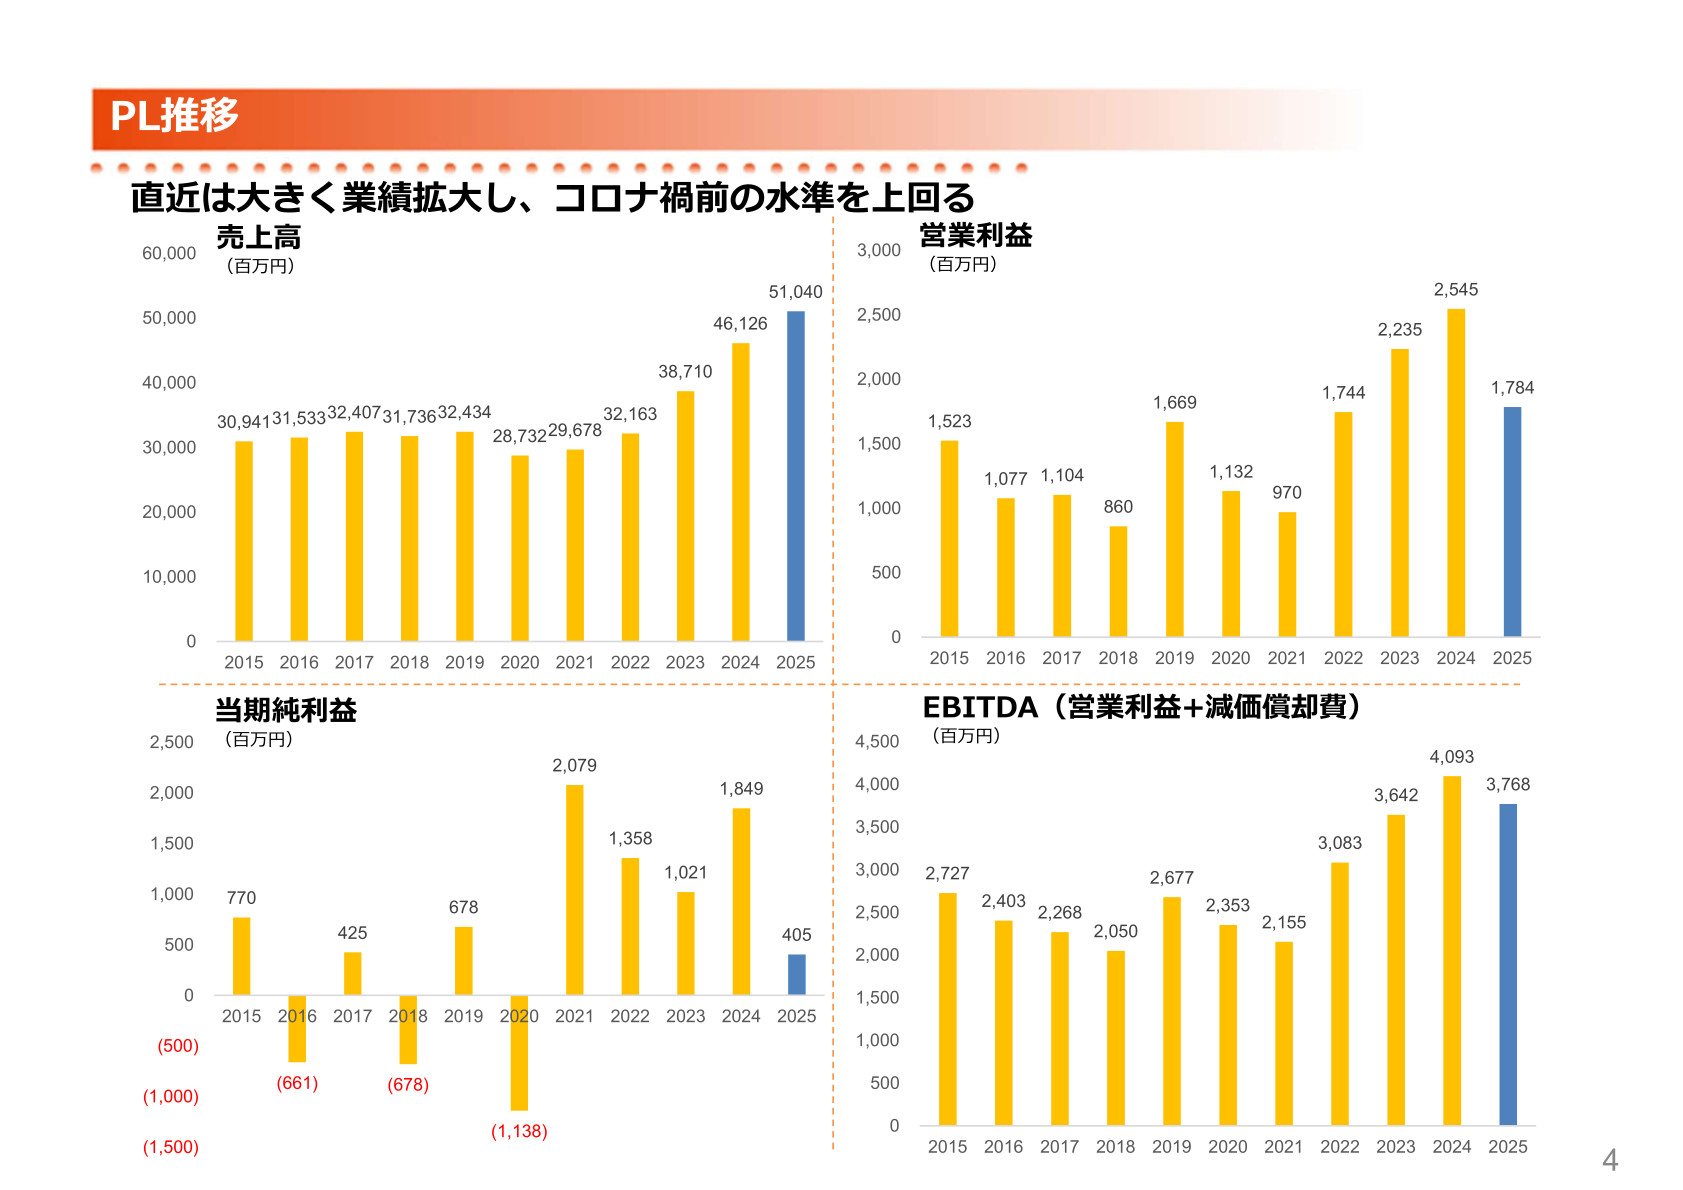
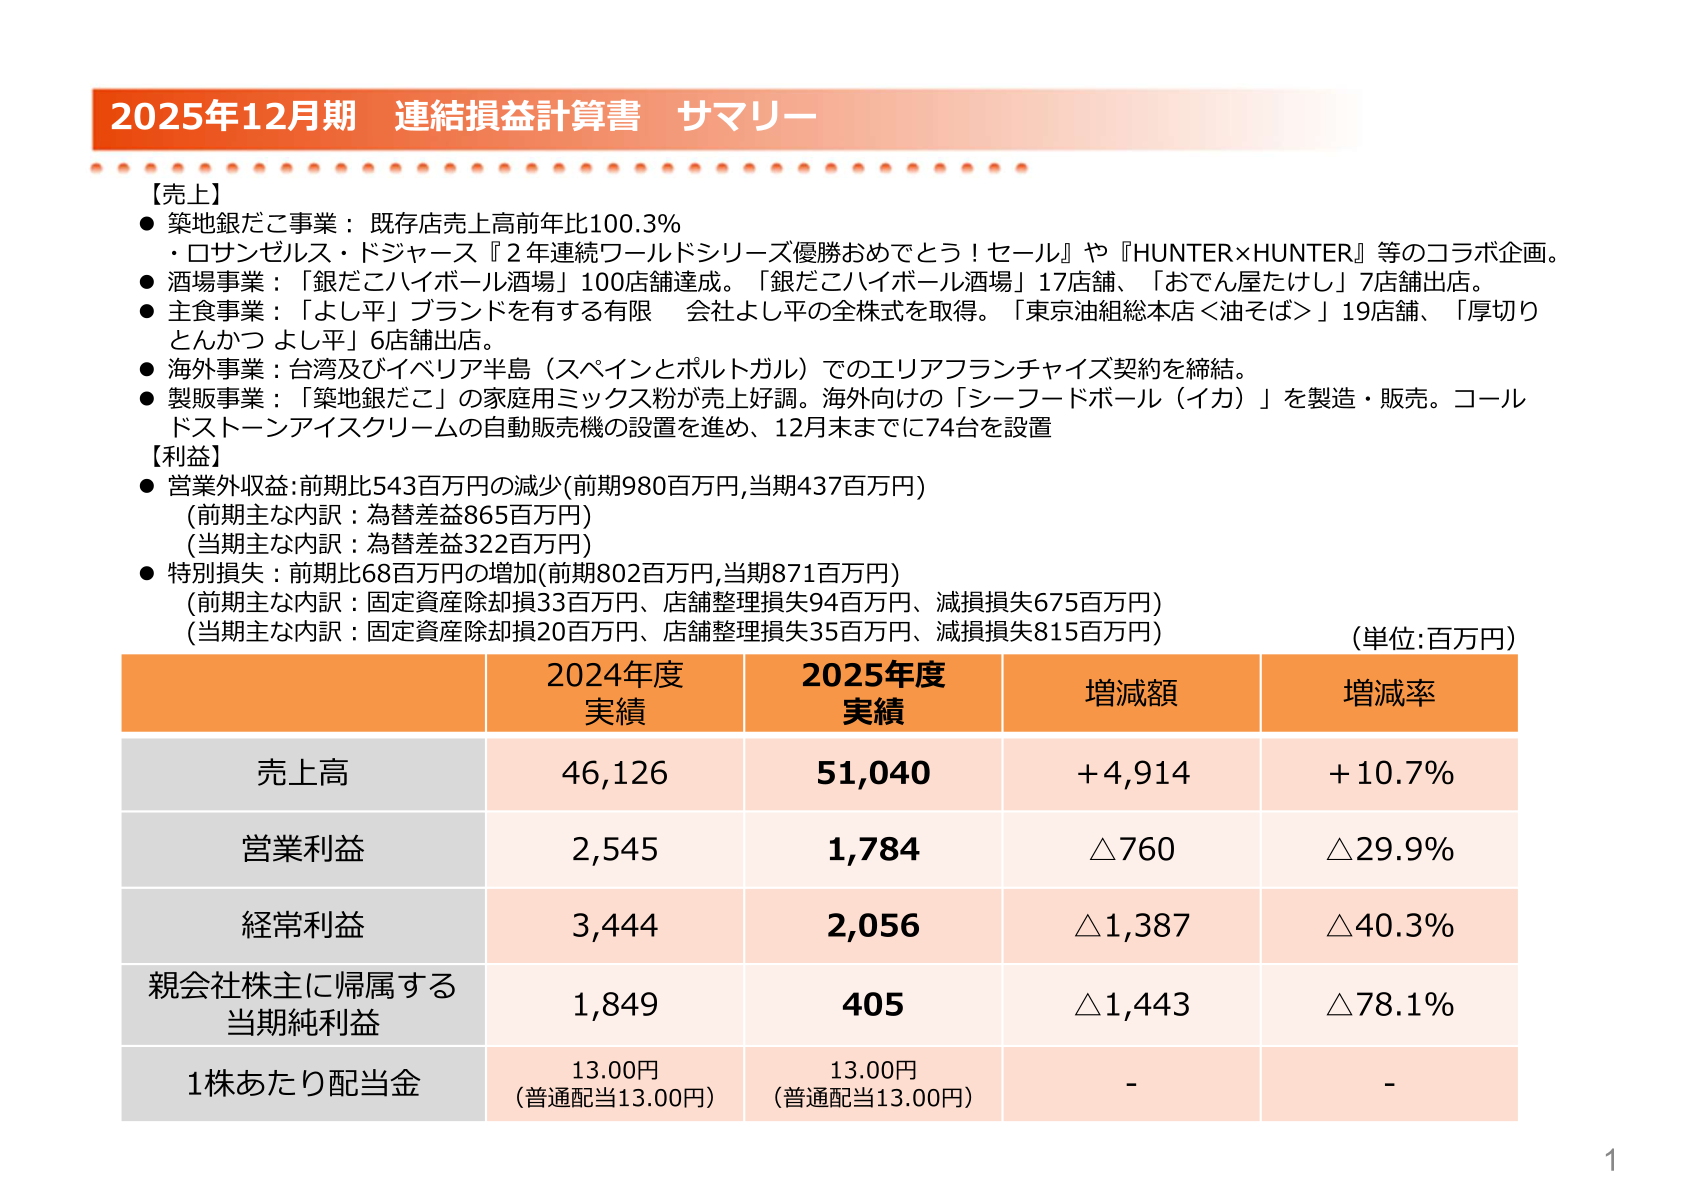
On February 27, 2026, Hotland Holdings released its earnings presentation for the fiscal year ended December 2025 (full year). Consolidated net sales were 51,040 million yen (+10.7% year on year), an increase, while operating profit was 1,784 million yen (△29.9%), ordinary profit was 2,056 million yen (△40.3%), and net income attributable to owners of the parent was 405 million yen (△78.1%), all below the prior year. On the sales side, existing-store sales of the Tsukiji Gindaco business reached 100.3% of the prior year, and new store openings advanced in the bar business and the staple-food business. On the profit side, a decrease in non-operating income (foreign exchange gains) and an increase in extraordinary losses (impairment losses) had an impact.
Consolidated Results (Full Year)
Non-operating income decreased by 543 million yen year on year (from 980 million yen in the prior year to 437 million yen in the current year). Of this, foreign exchange gains decreased from 865 million yen in the prior year to 322 million yen in the current year. Extraordinary losses increased by 68 million yen year on year (from 802 million yen in the prior year to 871 million yen in the current year). The main breakdown for the current year was 20 million yen in loss on retirement of non-current assets, 35 million yen in store closure losses, and 815 million yen in impairment losses. The dividend per share was 13.00 yen (ordinary dividend 13.00 yen), the same as the prior year.
| Item | Current Year (FY2025) | Prior Year (FY2024) | Change |
|---|---|---|---|
| Net sales | 51,040 million yen | 46,126 million yen | +10.7% (+4,914 million yen) |
| Operating profit | 1,784 million yen | 2,545 million yen | △29.9% (△760 million yen) |
| Ordinary profit | 2,056 million yen | 3,444 million yen | △40.3% (△1,387 million yen) |
| Net income attributable to owners of the parent | 405 million yen | 1,849 million yen | △78.1% (△1,443 million yen) |
| Dividend per share | 13.00 yen (ordinary dividend 13.00 yen) | 13.00 yen (ordinary dividend 13.00 yen) | - |
Business Results by Segment
The materials cite the following as the main topics by business. In the Tsukiji Gindaco business, existing-store sales reached 100.3% of the prior year, and the company ran collaboration campaigns with the Los Angeles Dodgers and with “HUNTER×HUNTER.” In the bar business, “Gindaco Highball Bar” reached 100 stores, and the company newly opened 17 of these bars and 7 “Oden-ya Takeshi” outlets. In the staple-food business, the company acquired all shares of Yoshihei Co., Ltd., which holds the “Yoshihei” brand, and opened 19 “Tokyo Aburagumi Sohonten (abura-soba)” outlets and 6 “Atsugiri Tonkatsu Yoshihei” outlets. In the overseas business, the company concluded area franchise agreements in Taiwan and on the Iberian Peninsula (Spain and Portugal). In the manufacturing and sales business, the household-use mix flour for “Tsukiji Gindaco” sold strongly, and the company advanced the manufacture and sale of “Seafood Balls (squid)” for overseas markets and the installation of Cold Stone ice cream vending machines (74 units by the end of December).
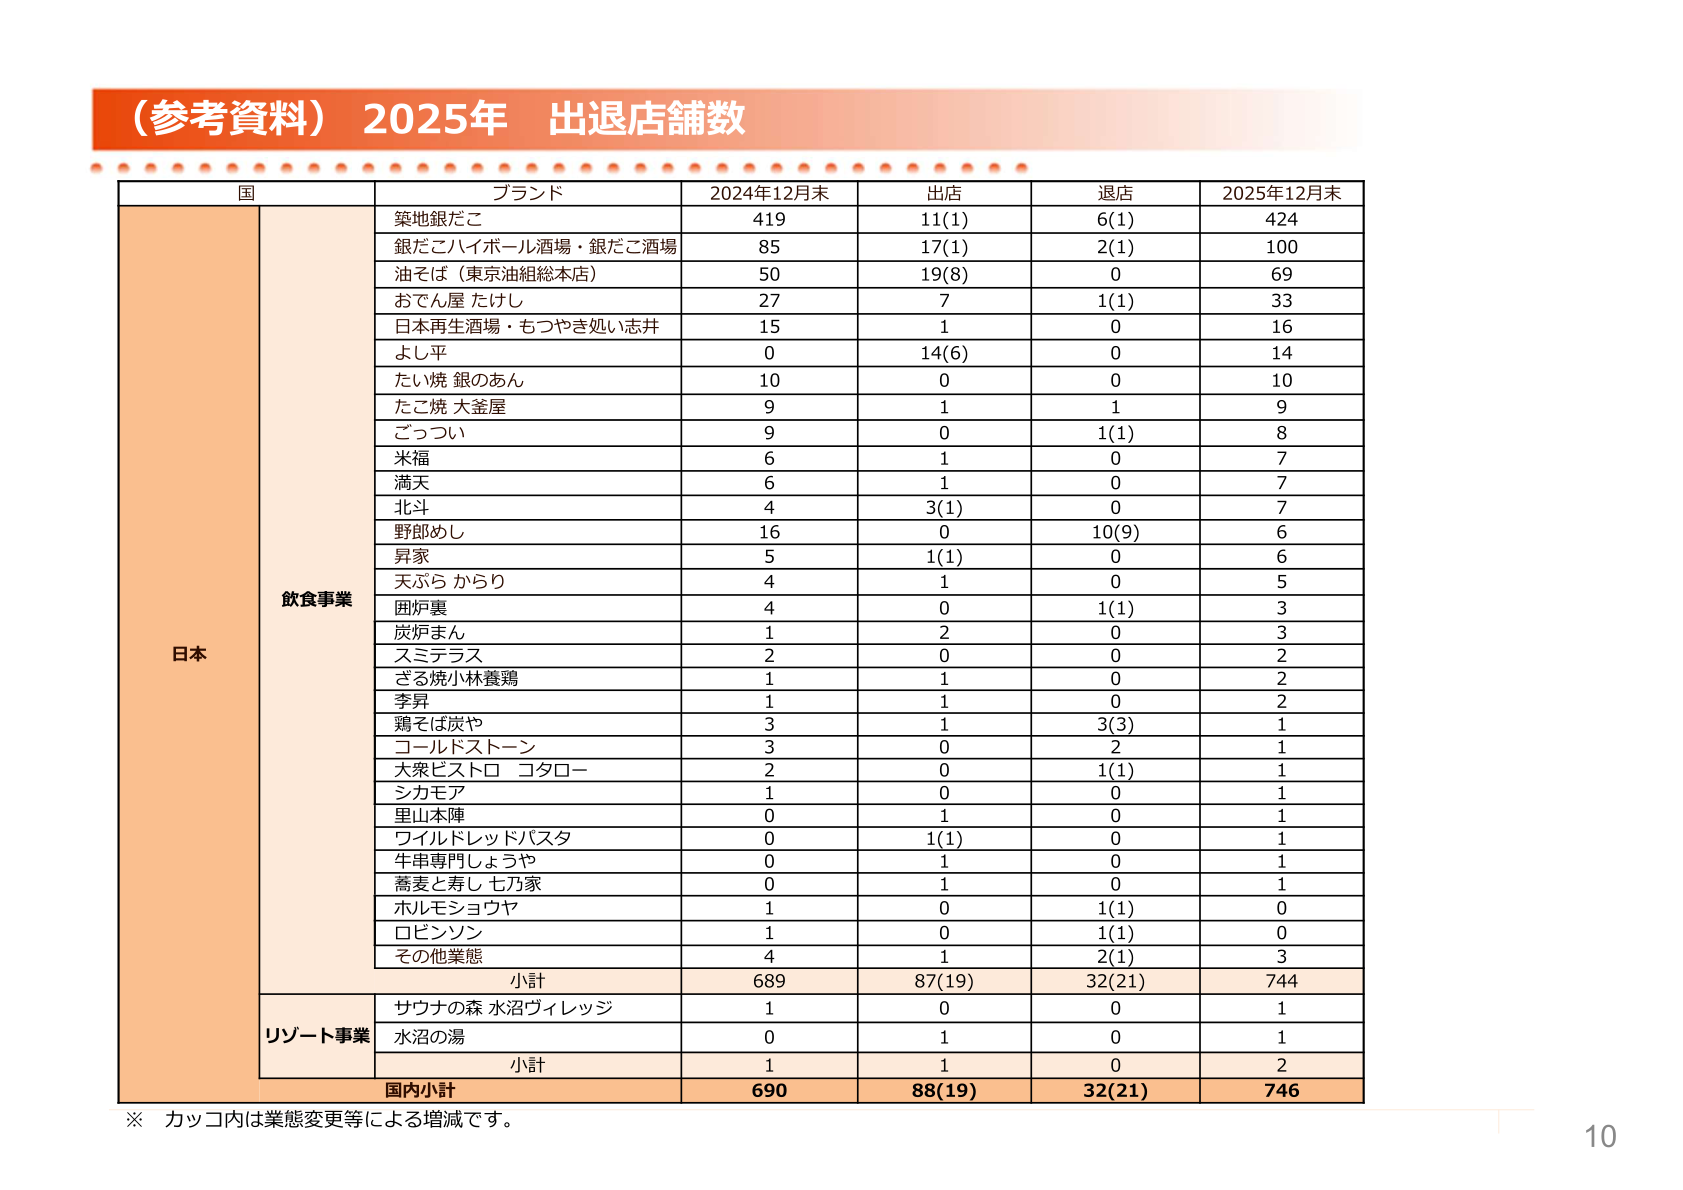
| Brand (Business) | Metric | End of Dec 2025 | End of Dec 2024 |
|---|---|---|---|
| Tsukiji Gindaco (domestic) | Number of stores | 424 stores | 419 stores |
| Gindaco Highball Bar / Gindaco Bar | Number of stores | 100 stores | 85 stores |
| Abura-soba (Tokyo Aburagumi Sohonten) | Number of stores | 69 stores | 50 stores |
| Oden-ya Takeshi | Number of stores | 33 stores | 27 stores |
| Yoshihei | Number of stores | 14 stores | 0 stores |
| Domestic subtotal | Number of stores | 746 stores | 690 stores |
| Total (Japan + overseas) | Number of stores | 820 stores | 768 stores |
Full-Year Forecast
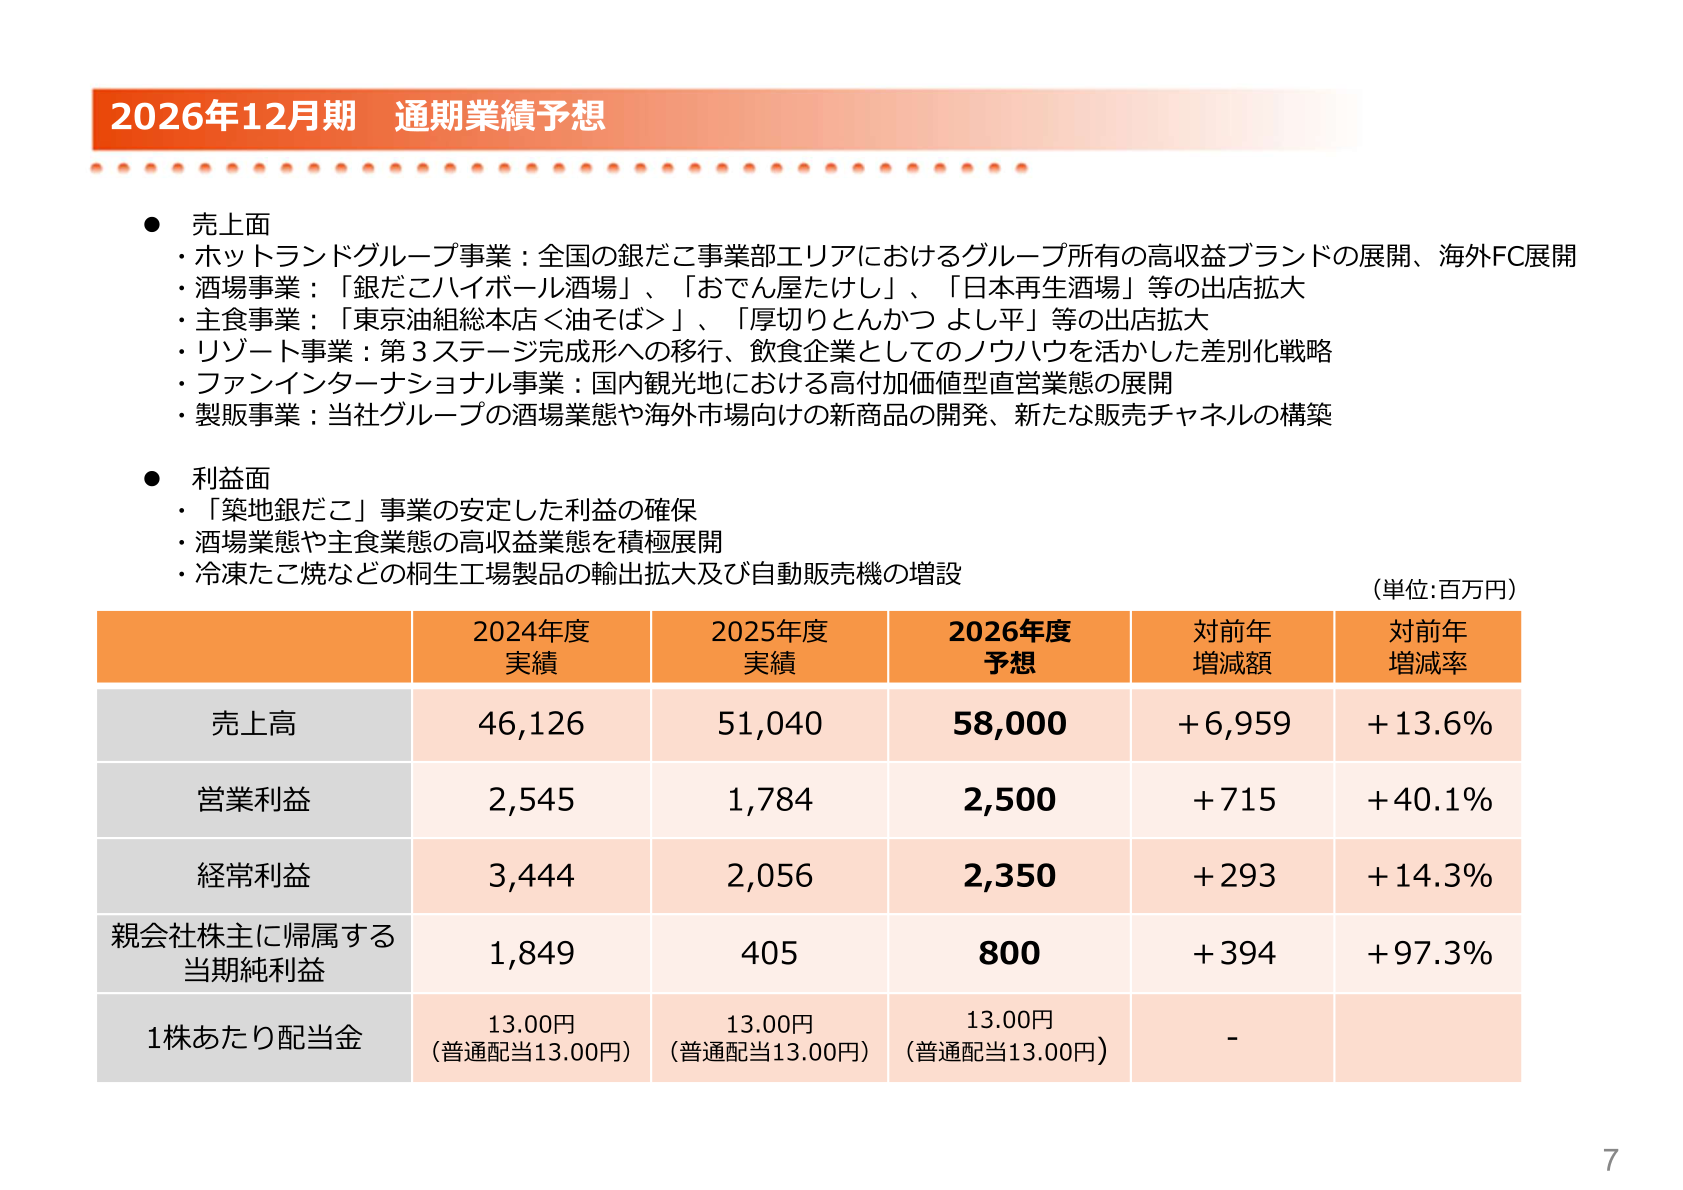
The company’s forecast for the fiscal year ending December 2026 (FY2026), shown against the prior-year actual, is as follows.
| Item | Forecast (FY2026) | Prior-Year Actual (FY2025) |
|---|---|---|
| Net sales | 58,000 million yen | 51,040 million yen |
| Operating profit | 2,500 million yen | 1,784 million yen |
| Ordinary profit | 2,350 million yen | 2,056 million yen |
| Net income attributable to owners of the parent | 800 million yen | 405 million yen |
| Dividend per share | 13.00 yen (ordinary dividend 13.00 yen) | 13.00 yen (ordinary dividend 13.00 yen) |
Shareholder Returns
The dividend per share is 13.00 yen (ordinary dividend 13.00 yen) for both the FY2025 actual and the FY2026 forecast, unchanged from the prior year.
This article is an analysis based on publicly available information and is not a recommendation to buy or sell any specific securities. Investment decisions are your own responsibility.
















