
This article is based on publicly available IR materials and is not a recommendation to buy or sell any specific securities.
Note: Toyota Boshoku labels the fiscal year ended March 2026 as “FY2026” (FY26); this article follows the company’s own fiscal-year labels in the text and tables below.
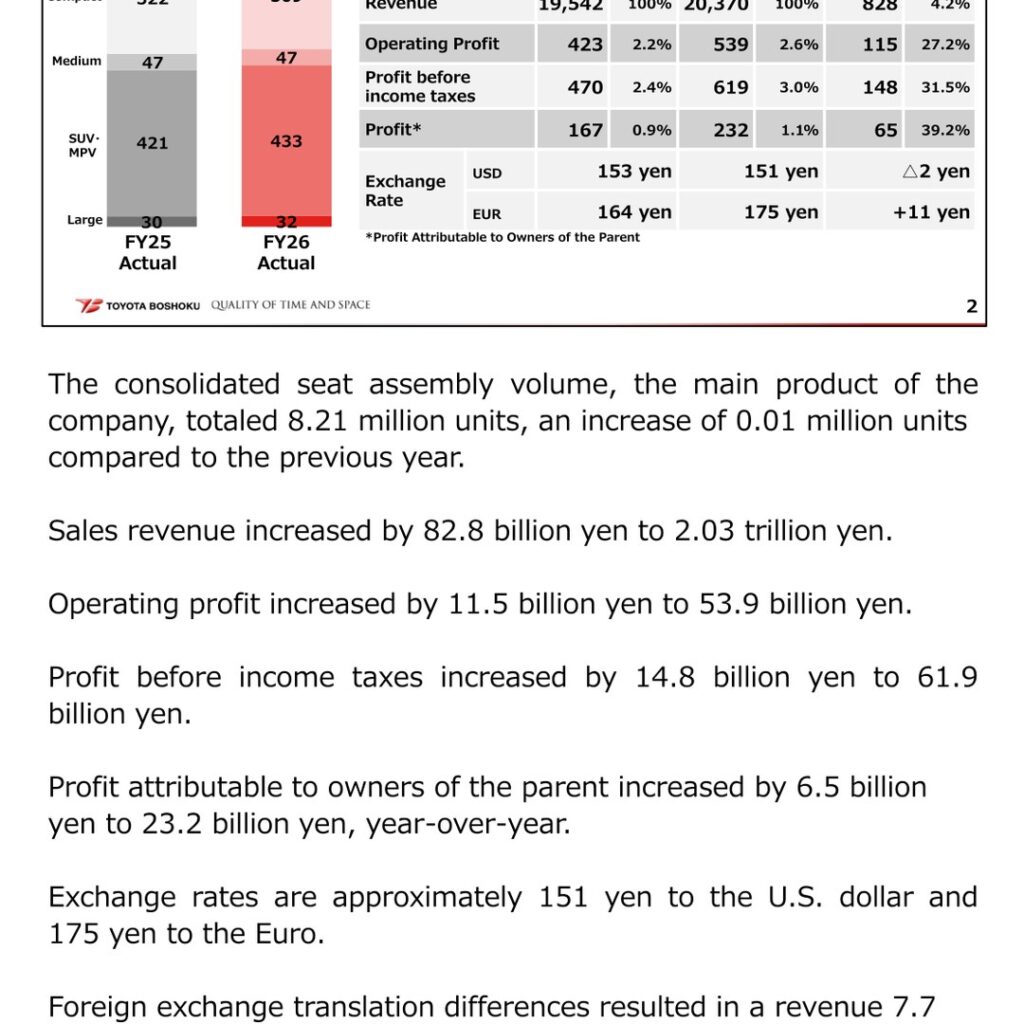
Toyota Boshoku Corporation (TSE Prime, Securities Code 3116) announced its FY2026 (ending March 2026) financial results on April 28, 2026. Sales revenue increased by 82.8 billion yen to 2.03 trillion yen, and operating profit increased by 11.5 billion yen to 53.9 billion yen, up 27.2% year-over-year, due to effects of new products and cost reduction in global. However, excluding the impact of the previous year’s impairment losses, operating profit decreased by 20.6 billion yen due to recalls and the impact of additional U.S. tariffs. The impact of the additional U.S. tariffs for the year totaled a 5.0 billion yen loss in profit.
Consolidated Results (Full-Year Actual)
The consolidated seat assembly volume, the company’s main product, totaled 8.21 million units, an increase of 0.01 million units compared to the previous year. Profit before income taxes increased by 14.8 billion yen to 61.9 billion yen, and profit attributable to owners of the parent increased by 6.5 billion yen to 23.2 billion yen. Exchange rates were approximately 151 yen to the U.S. dollar and 175 yen to the euro; foreign exchange translation differences resulted in a 7.7 billion yen increase in revenue and a 2.0 billion yen increase in operating profit year-over-year.
| Item (100 million yen) | FY25 Actual | FY26 Actual | YOY Change | YOY % |
|---|---|---|---|---|
| Revenue | 19,542 | 20,370 | 828 | 4.2% |
| Operating Profit | 423 | 539 | 115 | 27.2% |
| Profit before income taxes | 470 | 619 | 148 | 31.5% |
| Profit attributable to owners of the parent | 167 | 232 | 65 | 39.2% |
The operating profit margin improved from 2.2% in FY25 to 2.6% in FY26. In the consolidated analysis of operating profit, the company cites cost reduction (+307) and new product effects (+61) as positive factors, against quality-related cost (△218), U.S. tariffs impact (△50) and changes in product prices (△172) as negative factors (100 million yen).
Segment Results
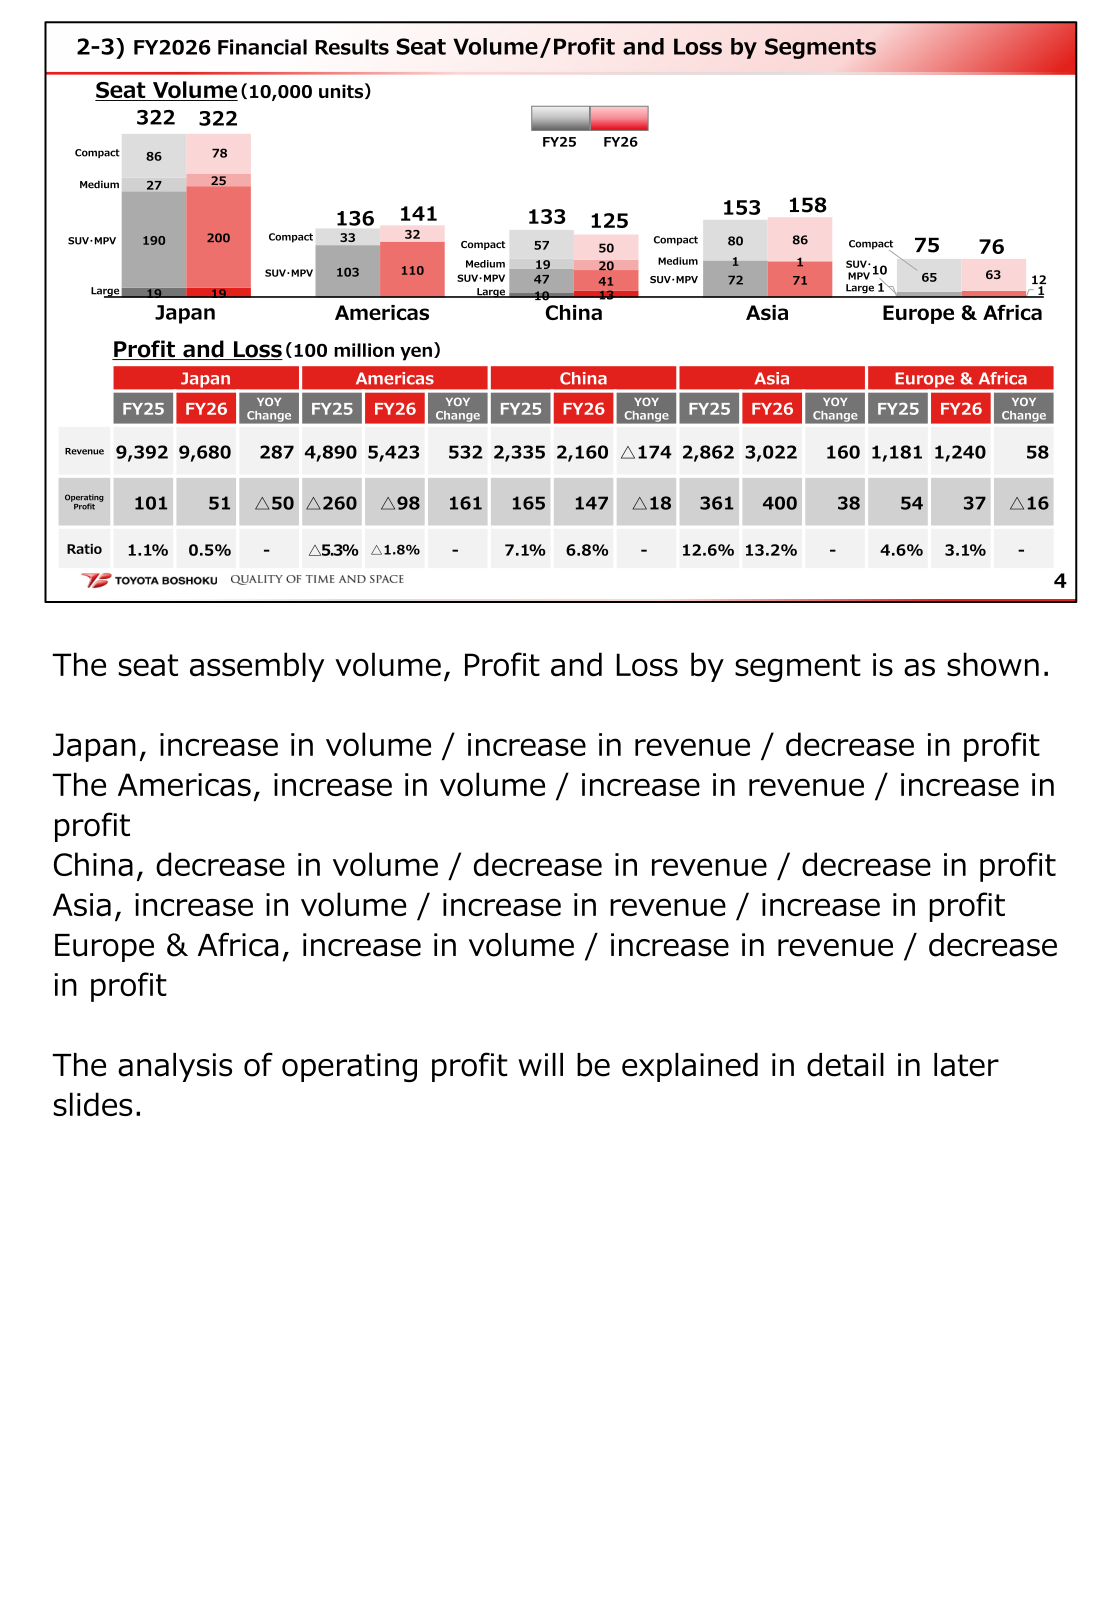
By segment, Japan saw an increase in volume and revenue but a decrease in profit, mainly due to quality-related cost. The Americas reduced its operating loss due to cost reduction and volume increase, although excluding the prior year’s impairment losses, profit decreased due to additional U.S. tariffs and quality-related cost. China posted lower volume, revenue and profit, Asia increased volume, revenue and profit, and Europe & Africa saw higher volume and revenue but lower profit due to market prices.
| Segment (100 million yen) | Revenue FY25 | Revenue FY26 | Operating Profit FY25 | Operating Profit FY26 |
|---|---|---|---|---|
| Japan | 9,392 | 9,680 | 101 | 51 |
| The Americas | 4,890 | 5,423 | △260 | △98 |
| China | 2,335 | 2,160 | 165 | 147 |
| Asia | 2,862 | 3,022 | 361 | 400 |
| Europe & Africa | 1,181 | 1,240 | 54 | 37 |
FY2027 Forecast
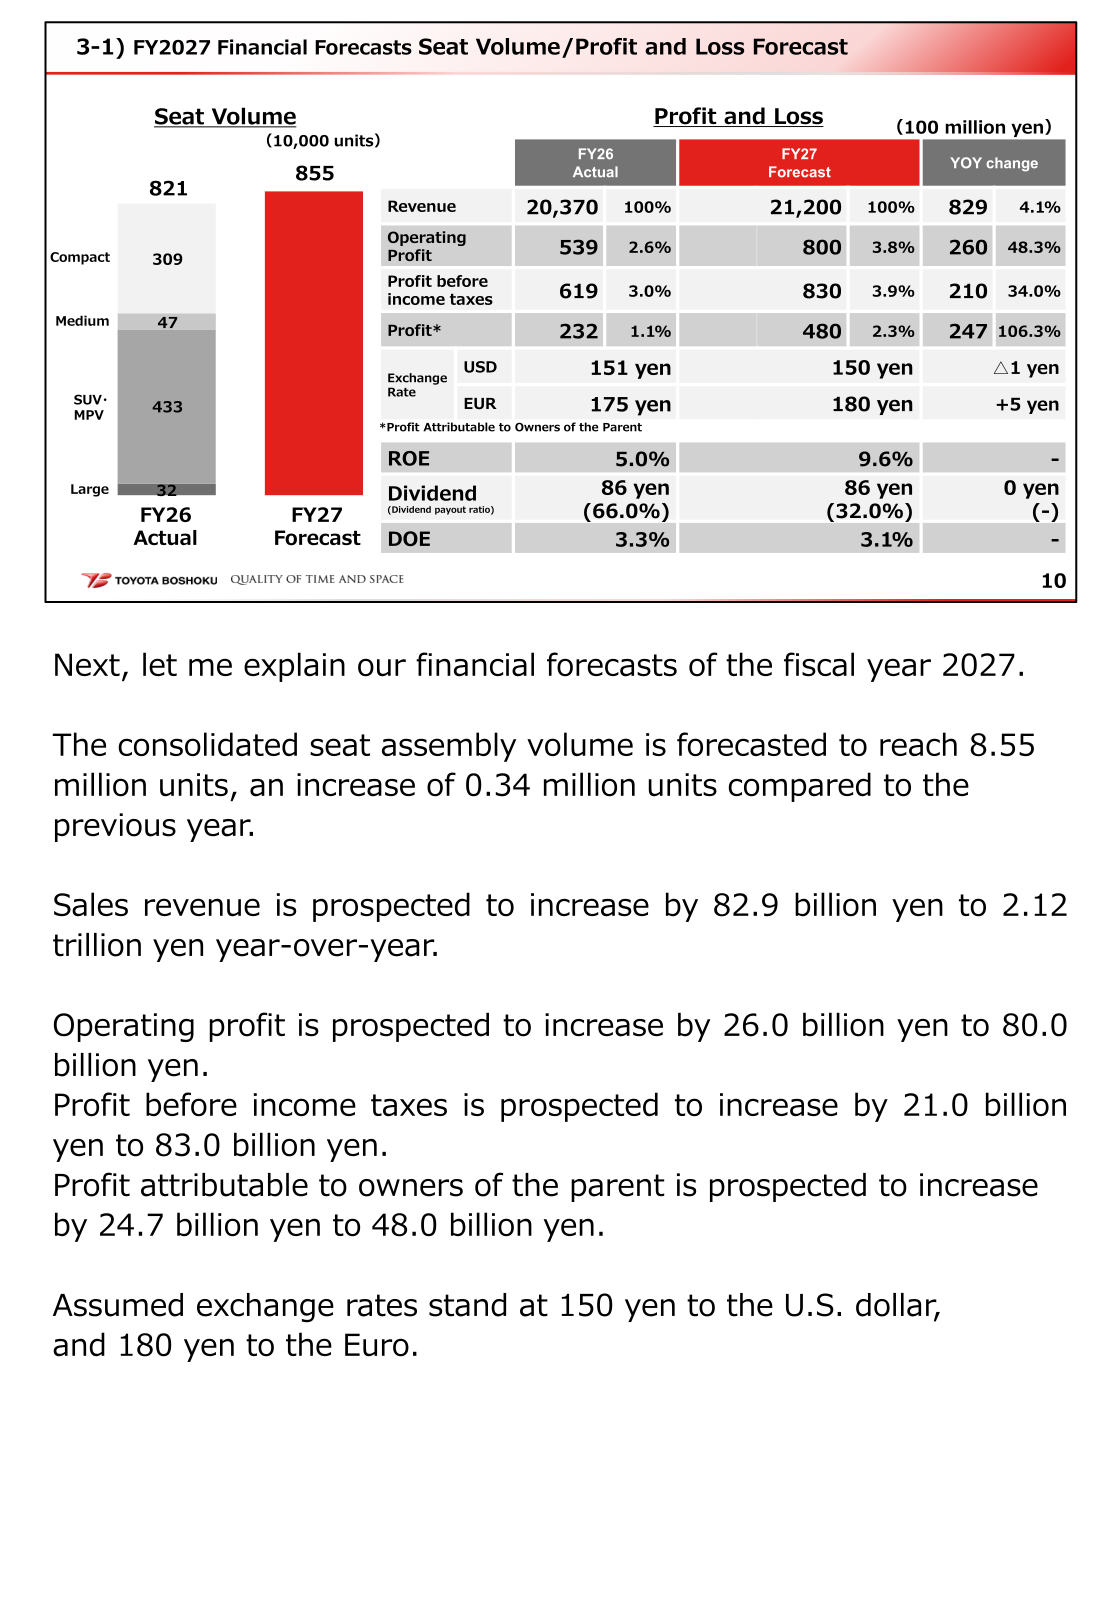
For FY2027, consolidated seat assembly volume is forecast to reach 8.55 million units, an increase of 0.34 million units. Sales revenue is projected to increase by 82.9 billion yen to 2.12 trillion yen, operating profit to increase by 26.0 billion yen to 80.0 billion yen, profit before income taxes to increase by 21.0 billion yen to 83.0 billion yen, and profit attributable to owners of the parent to increase by 24.7 billion yen to 48.0 billion yen. Assumed exchange rates are 150 yen to the U.S. dollar and 180 yen to the euro. Operating profit for FY26 excluding the impact of impairment losses was 57.4 billion yen; compared to this, the FY27 forecast represents an increase of 22.5 billion yen, driven by a global volume increase and impacts of cost reduction. The company notes that the FY27 forecast incorporates material costs related to the Middle East situation for April only, along with the latest volume information.
| Item (100 million yen) | FY26 Actual | FY27 Forecast | YOY Change | YOY % |
|---|---|---|---|---|
| Revenue | 20,370 | 21,200 | 829 | 4.1% |
| Operating Profit | 539 | 800 | 260 | 48.3% |
| Profit before income taxes | 619 | 830 | 210 | 34.0% |
| Profit attributable to owners of the parent | 232 | 480 | 247 | 106.3% |
| ROE | 5.0% | 9.6% | – | – |
Shareholder Returns
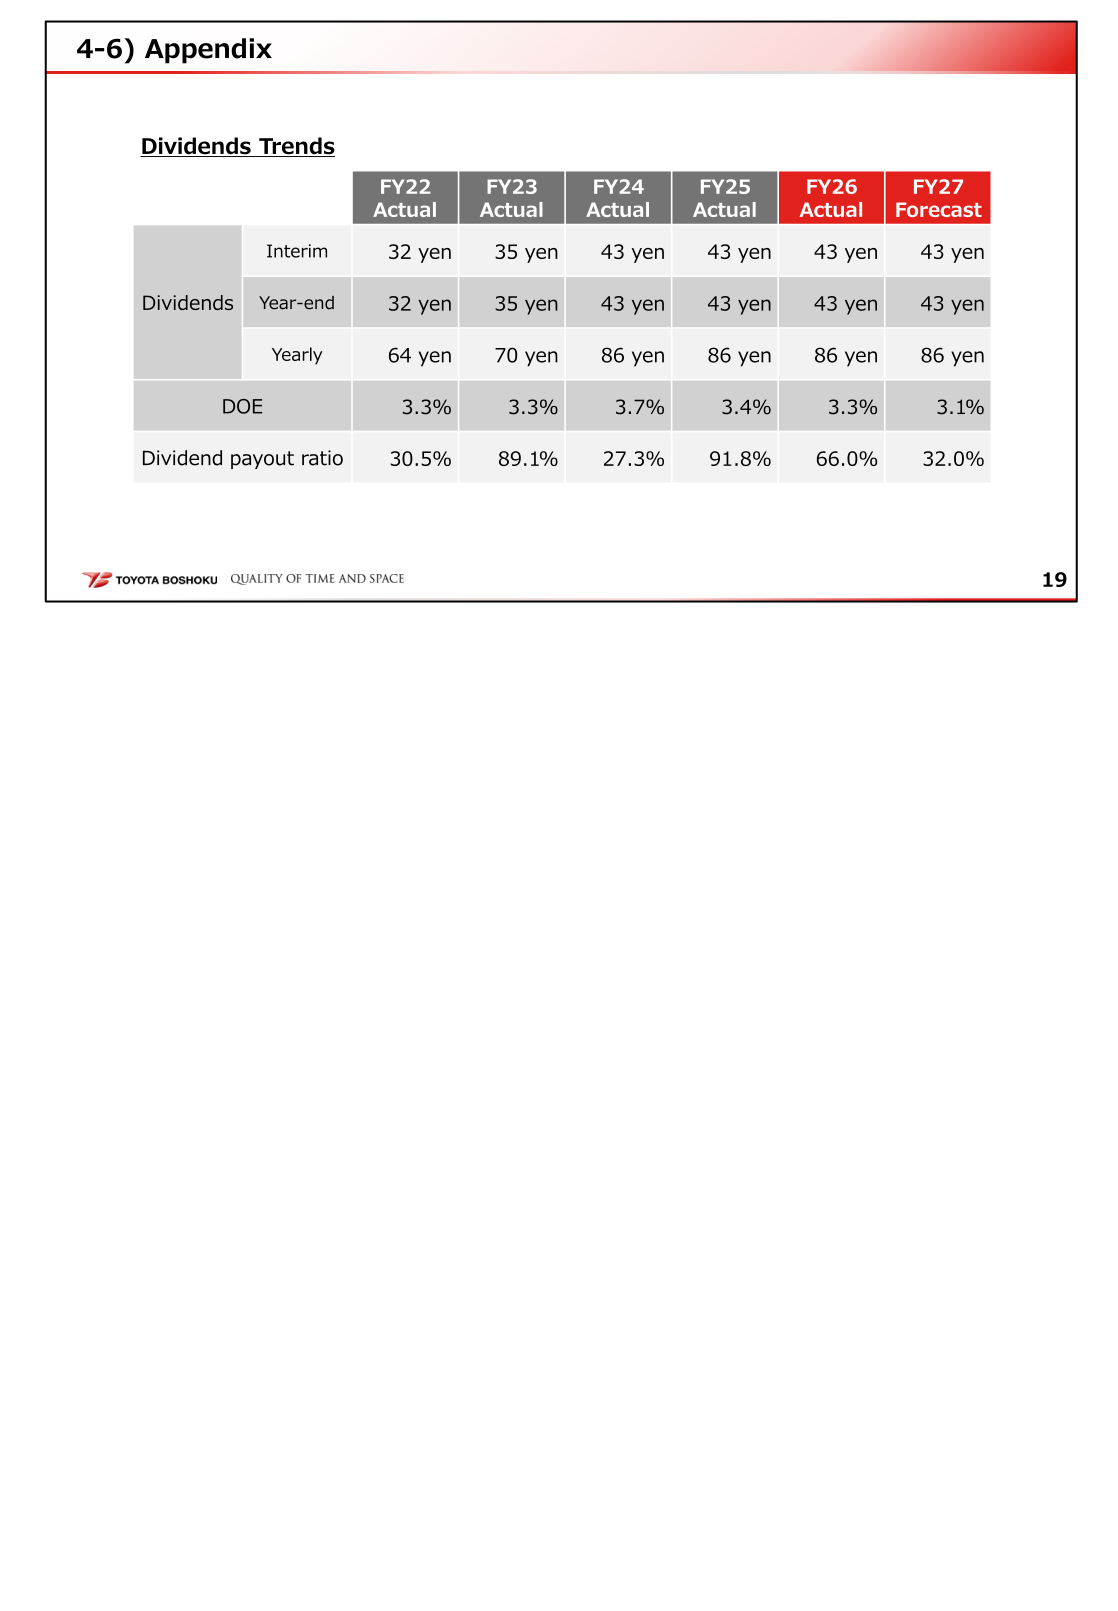
The FY26 annual dividend plan is 86 yen, as announced previously, with a dividend payout ratio of 66.0% and DOE of 3.3%. For FY27, the dividend plan is also 86 yen, with an interim dividend of 43 yen and a year-end dividend of 43 yen (payout ratio 32.0%, DOE 3.1%). By maintaining DOE of 3% or more, the company aims to provide long-term stable profit return based on consolidated performance.
| Item | FY24 Actual | FY25 Actual | FY26 Actual | FY27 Forecast |
|---|---|---|---|---|
| Annual dividend | 86 yen | 86 yen | 86 yen | 86 yen |
| DOE | 3.7% | 3.4% | 3.3% | 3.1% |
| Dividend payout ratio | 27.3% | 91.8% | 66.0% | 32.0% |
Medium-Term Plan / Topics
Against the 2025 Mid-term Plan targets of revenue of 16,000+α and operating profit of 1,000+α (100 million yen), FY26 actual results were revenue of 20,370 and operating profit of 539, with an operating profit ratio of 2.6%, DOE of 3.3%, and an equity ratio of 41.0%. The 2030 Mid-term Plan targets revenue of 22,000 and operating profit of 1,500 (100 million yen), an operating profit ratio of 7.0%, DOE of 3.0% or more, and an equity ratio at the 50% level. To achieve the 2030 Mid-term Plan, the company states that upfront investments such as expanding sales to new customers, strategic human capital and R&D will be continued efficiently by leveraging the benefits of volume increase and the effects of new products.
This article is an analysis based on publicly available information and is not a recommendation to buy or sell any specific securities. Investment decisions are your own responsibility.
![[Obayashi] Investors’ Guide 2026 — The Complete 24-Article Breakdown](https://japan-equity.com/wp-content/uploads/2026/07/hub_cover-1024x1024.png)
![[Obayashi] IR & SR Policy — Feeding Dialogue Back into Management](https://japan-equity.com/wp-content/uploads/2026/07/p32_sq-1024x1024.jpg)
![[Obayashi] Domestic Civil Engineering — Resilience Spending Supports 9.6% Margin](https://japan-equity.com/wp-content/uploads/2026/07/p11_sq-1024x1024.jpg)
![[Obayashi] Overseas Construction — Orders Reach ¥1.2tn](https://japan-equity.com/wp-content/uploads/2026/07/p15_sq-1024x1024.jpg)
![[Obayashi] Share Price & External Ratings — vs TOPIX, ESG Index Inclusion](https://japan-equity.com/wp-content/uploads/2026/07/p40_sq-1024x1024.jpg)
![[Construction] ¥75.5tn Investment, Shrinking Workforce — Big-5 Market Share](https://japan-equity.com/wp-content/uploads/2026/07/p12_sq-1024x1024.jpg)



![[Obayashi] Capital Policy & Shareholder Returns — ROE 10%+, DOE ~5%, ¥100bn Buyback](https://japan-equity.com/wp-content/uploads/2026/07/p27_sq-1024x1024.jpg)
![[Obayashi] Reducing Cross-Shareholdings — ¥285.2bn Sold in Five Years](https://japan-equity.com/wp-content/uploads/2026/07/p29_sq-1024x1024.jpg)
![[Obayashi] ¥750bn Investment Plan — ¥300bn to Development, ¥190bn to Tech/DX](https://japan-equity.com/wp-content/uploads/2026/07/p30_sq-1024x1024.jpg)
![[Obayashi] MTP2022 KPIs — Operating Profit ~2x Target, ROE 14.4%](https://japan-equity.com/wp-content/uploads/2026/07/p25_sq-1024x1024.jpg)
![[Obayashi] Cash Allocation — ¥420bn Investment CF Over Five Years](https://japan-equity.com/wp-content/uploads/2026/07/p26_sq-1024x1024.jpg)
![[Obayashi] Green Energy — 44 Plants, 344MW, and the Green Hydrogen Challenge](https://japan-equity.com/wp-content/uploads/2026/07/p21_sq-1024x1024.jpg)
![[Obayashi] Tackling the Labor Shortage — Robotics Construction®](https://japan-equity.com/wp-content/uploads/2026/07/p14_sq-1024x1024.jpg)
