
This article is based on publicly available IR materials and is not a recommendation to buy or sell any specific securities.
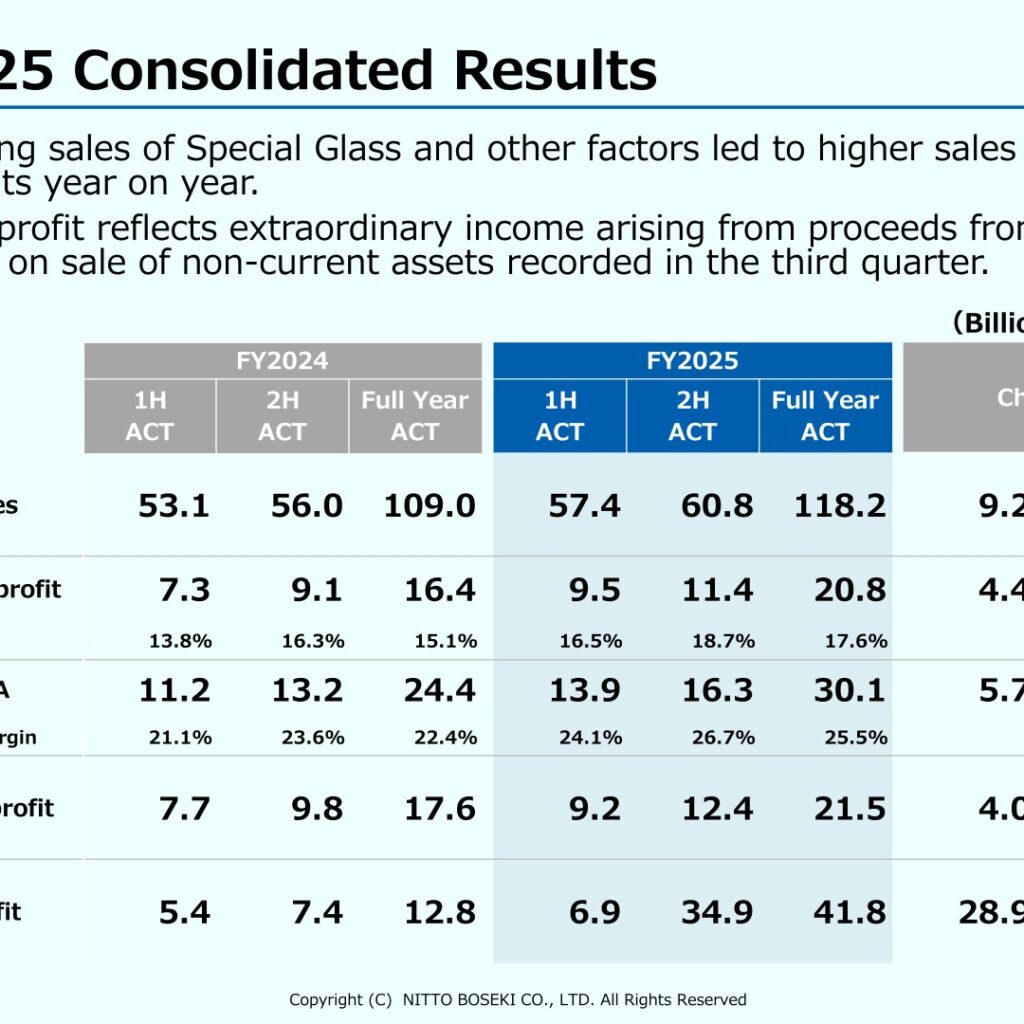
For FY2025 (the fiscal year ended March 31, 2026; April 2025 to March 2026), the Nittobo Group posted net sales of 118.2 billion yen, up 9.2 billion yen (8.4%) year on year, and operating profit of 20.8 billion yen, up 4.4 billion yen (26.6%). Against the background of robust demand for Special Glass, the electronic materials business saw strong sales, recording higher revenue and profit year on year. Net profit rose to 41.8 billion yen, up 28.9 billion yen (225.4%), reflecting extraordinary income arising from a gain on the sale of non-current assets recorded in the third quarter.
Consolidated Results (Full-Year Actual)
Strong sales of Special Glass and other factors led to higher sales and profits year on year. Operating profit reached 20.8 billion yen and ROS improved to 17.6% from 15.1%. Figures are in billions of yen.
| Item | FY2025 | FY2024 | Change | % Change |
|---|---|---|---|---|
| Net sales | 118.2 | 109.0 | 9.2 | 8.4% |
| Operating profit | 20.8 | 16.4 | 4.4 | 26.6% |
| ROS | 17.6% | 15.1% | — | — |
| EBITDA | 30.1 | 24.4 | 5.7 | 23.5% |
| EBITDA margin | 25.5% | 22.4% | — | — |
| Ordinary profit | 21.5 | 17.6 | 4.0 | 22.6% |
| Net profit | 41.8 | 12.8 | 28.9 | 225.4% |
Segment Results
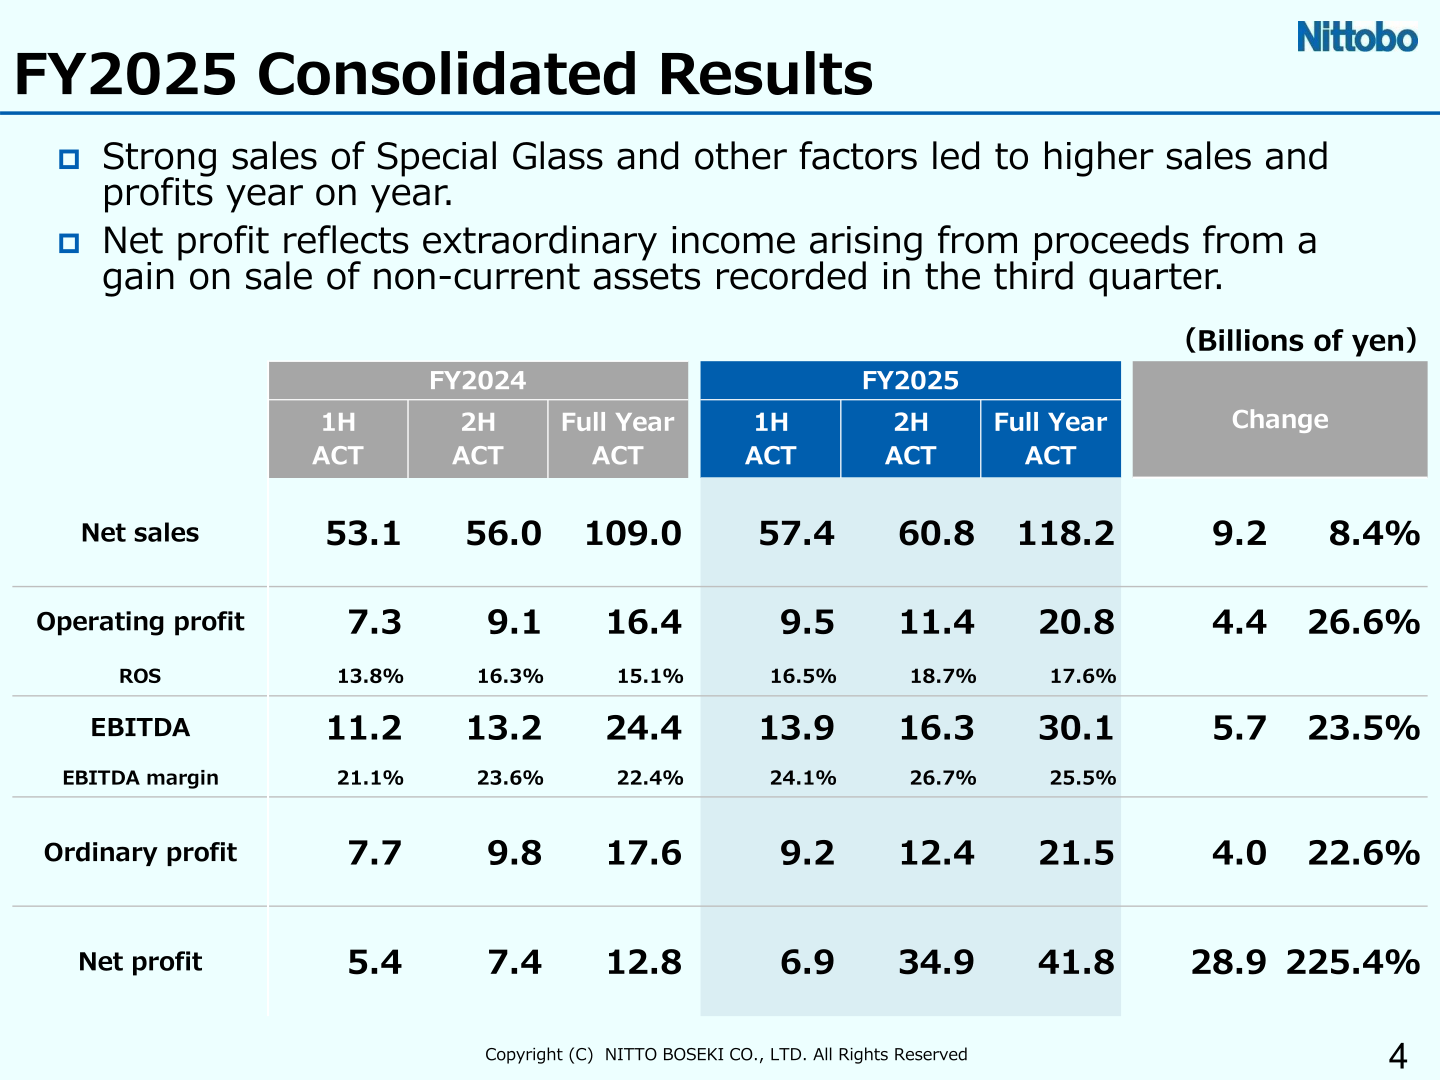
Electronic Materials drove the improvement, with Special Glass sales strong and contributing to earnings on continued robust demand for AI-server uses. Materials Solution sales rose year on year helped by price increases; Insulation Materials remained weak on soft residential demand and periodic repair costs; Medical was stable in in vitro diagnostic reagents; and Composite Materials was broadly flat. Figures are in billions of yen; Electronic Materials net sales include intersegment sales, while other segments do not.
| Segment | Net Sales FY2025 | Net Sales FY2024 | Operating Profit FY2025 | Operating Profit FY2024 |
|---|---|---|---|---|
| Electronic Materials* | 61.4 | 52.1 | 19.4 | 13.9 |
| Medical | 13.9 | 13.6 | 2.4 | 2.4 |
| Composite Materials | 13.4 | 13.5 | (0.1) | (0.9) |
| Materials Solution | 9.5 | 9.4 | 0.6 | 0.8 |
| Insulation Materials | 15.1 | 15.3 | 0.2 | 0.7 |
| Other Business | 17.1 | 16.3 | 0.5 | 0.4 |
| Adjustment | — | — | (2.2) | (0.9) |
| Total | 118.2 | 109.0 | 20.8 | 16.4 |
FY2026 Forecast
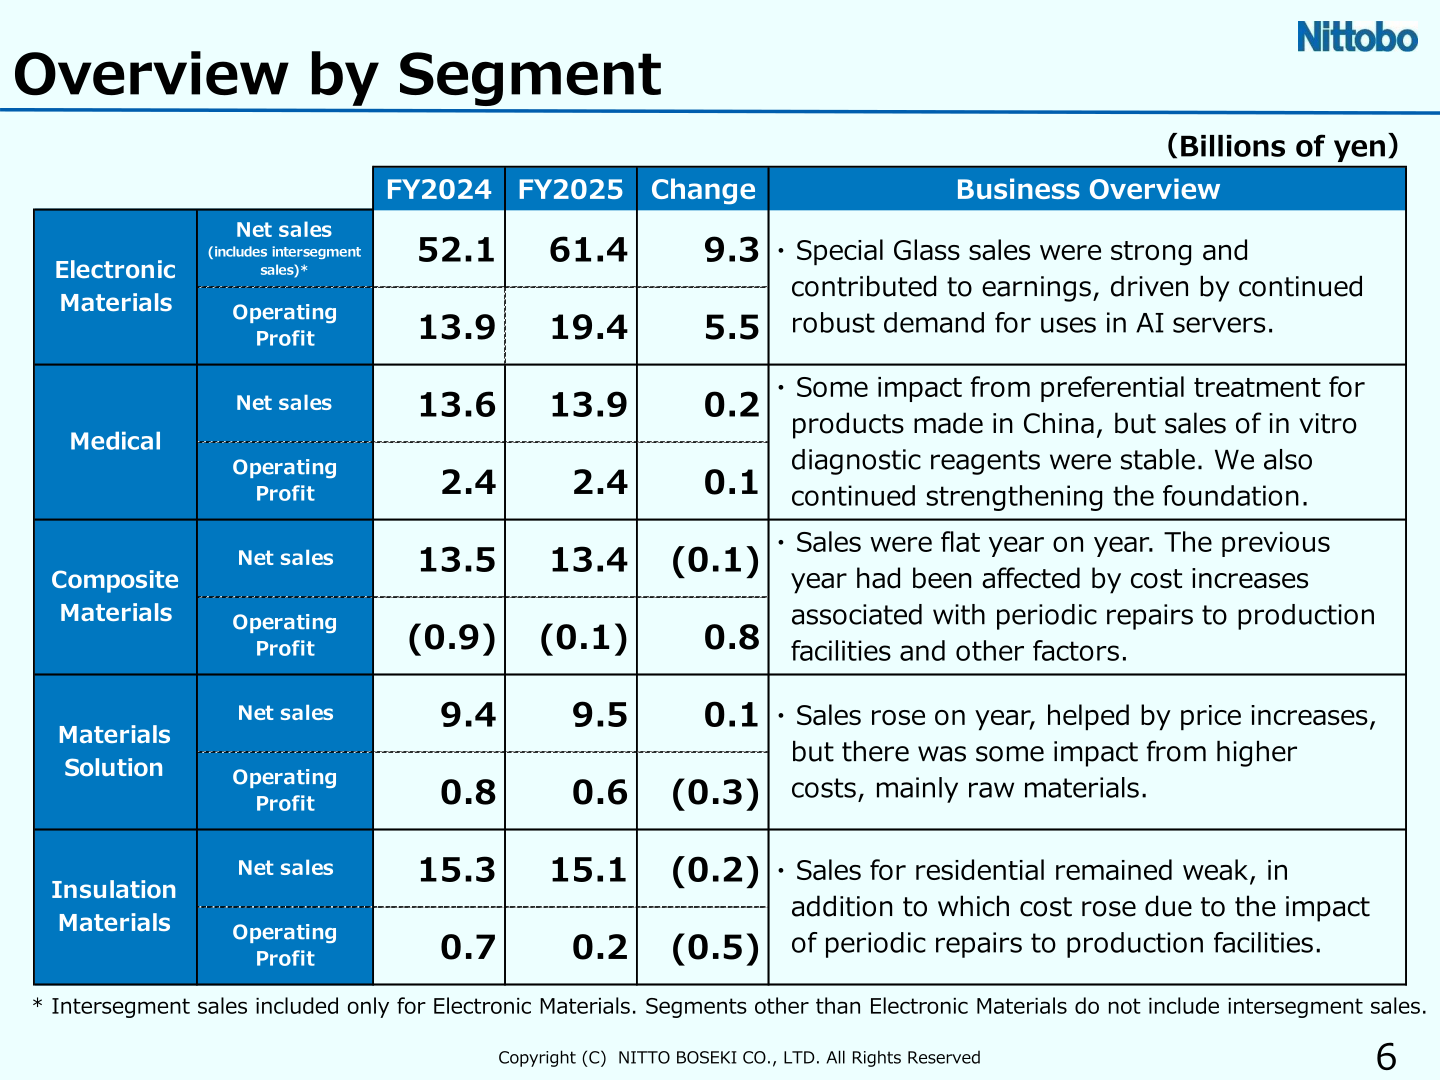
For FY2026 (the fiscal year ending March 31, 2027), Nittobo expects both net sales and operating profit to grow year on year as it actively increases Special Glass capacity in the electronic materials business in response to continued robust demand. Net profit is forecast to decline to 17.0 billion yen, against a FY2025 figure that included extraordinary income from the gain on sale of non-current assets. Figures are in billions of yen.
| Item | FY2026 Forecast | FY2025 (Actual) | Change | % Change |
|---|---|---|---|---|
| Net sales | 137.0 | 118.2 | 18.8 | 15.9% |
| Operating profit | 26.0 | 20.8 | 5.2 | 24.9% |
| ROS | 19.0% | 17.6% | — | — |
| EBITDA | 37.6 | 30.1 | 7.5 | 24.8% |
| EBITDA margin | 27.4% | 25.5% | — | — |
| Ordinary profit | 26.0 | 21.5 | 4.5 | 20.7% |
| Net profit | 17.0 | 41.8 | (24.8) | (59.3%) |
Shareholder Returns
Nittobo’s basic policy is to pay a dividend of not less than 55 yen per share, targeting a dividend payout ratio of 30% of steady earnings. Annual dividends are calculated on the basis of steady earnings, excluding the impact of extraordinary income arising from the gain on sale of non-current assets. The FY2025 year-end dividend is 99.5 yen per share, for a full-year dividend of 127.0 yen per share. For FY2026, an annual dividend of 140.0 yen per share is planned.
Medium-Term Management Plan (FY2024–2027)
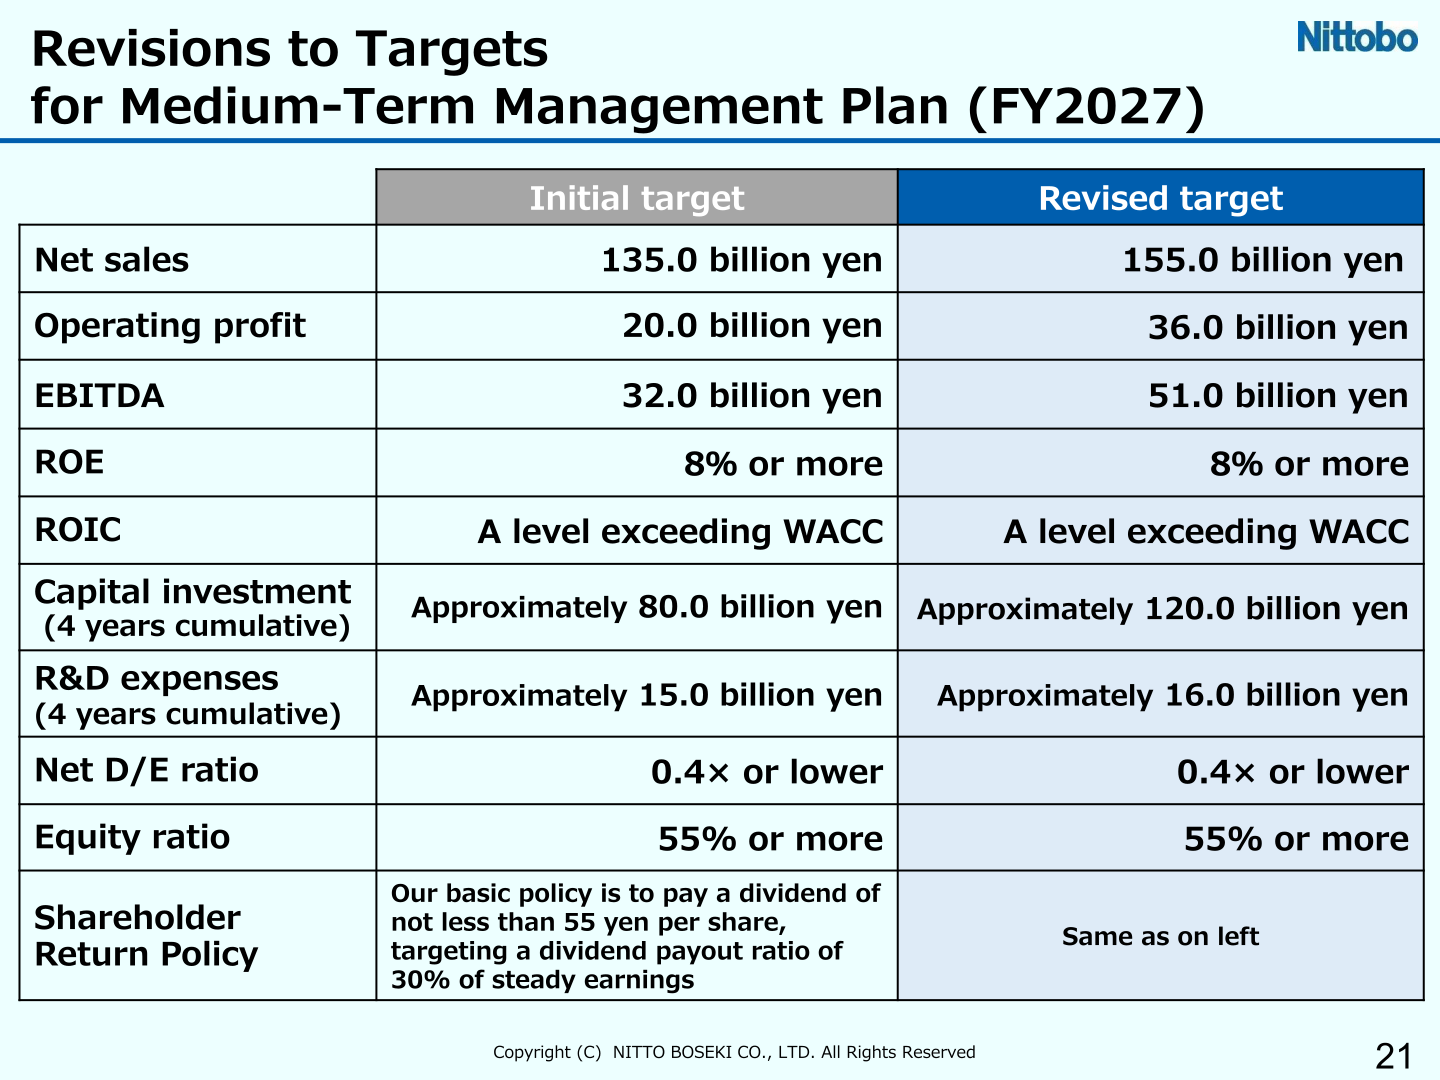
Performance targets of the Medium-Term Management Plan were hit ahead of schedule in FY2025. Targets for FY2027 have been revised upward, now aiming for net sales of 155.0 billion yen and operating profit of 36.0 billion yen.
| Metric (FY2027 targets) | Initial Target | Revised Target |
|---|---|---|
| Net sales | 135.0 billion yen | 155.0 billion yen |
| Operating profit | 20.0 billion yen | 36.0 billion yen |
| EBITDA | 32.0 billion yen | 51.0 billion yen |
| ROE | 8% or more | 8% or more |
| ROIC | A level exceeding WACC | A level exceeding WACC |
| Capital investment (4-year cumulative) | Approximately 80.0 billion yen | Approximately 120.0 billion yen |
| R&D expenses (4-year cumulative) | Approximately 15.0 billion yen | Approximately 16.0 billion yen |
| Net D/E ratio | 0.4× or lower | 0.4× or lower |
| Equity ratio | 55% or more | 55% or more |
This article is an analysis based on publicly available information and is not a recommendation to buy or sell any specific securities. Investment decisions are your own responsibility.
















