
This article is based on publicly available IR materials and is not a recommendation to buy or sell any specific securities.
Note: NATORI CO., Ltd. does not publish an English results presentation; this article is an English translation of the Japanese-language article on our sister site Investalk, which is based on the company’s Japanese-language IR materials, with figures transcribed as reported. Note also that the company labels this fiscal year as the year ended March 31, 2026 (FY26/03), whereas this site classifies the most recent completed fiscal year as FY2025; the source’s own period labels are retained in the text, tables and slide captions below.
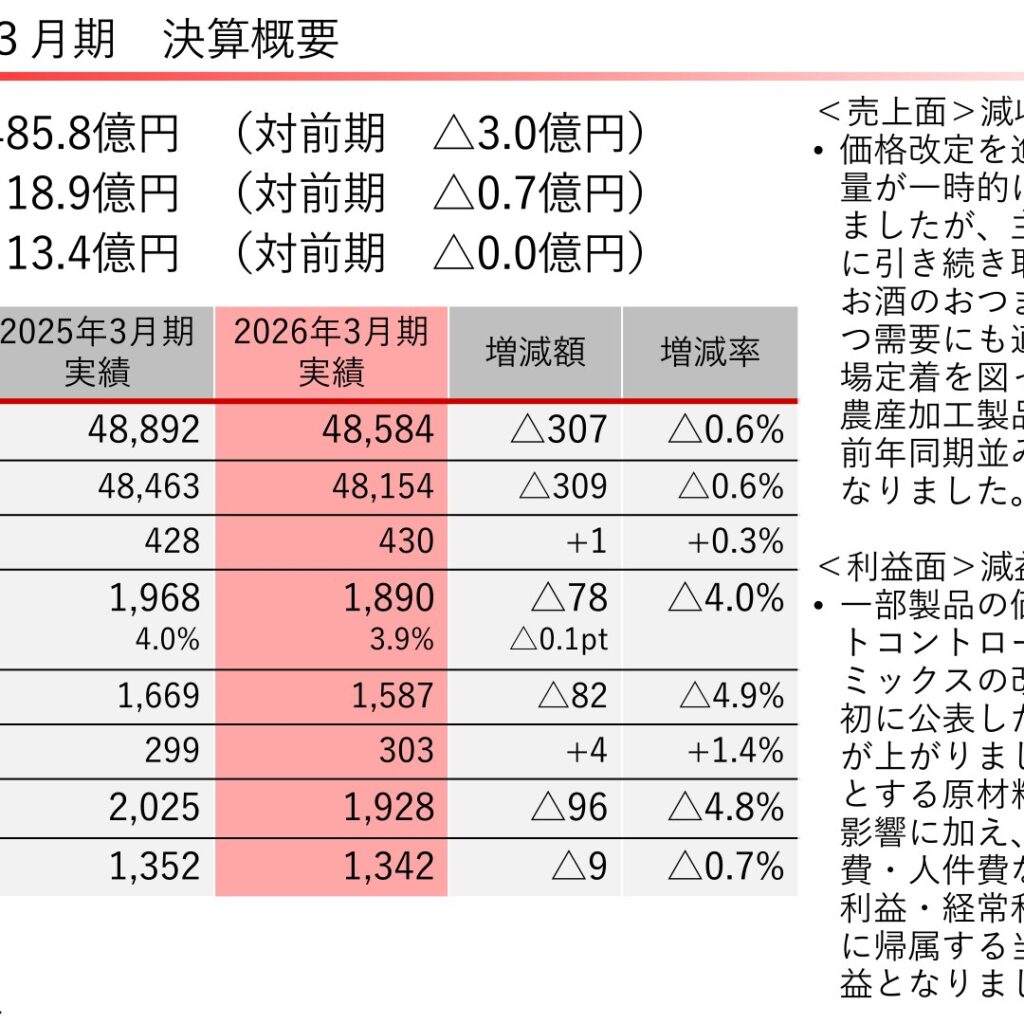
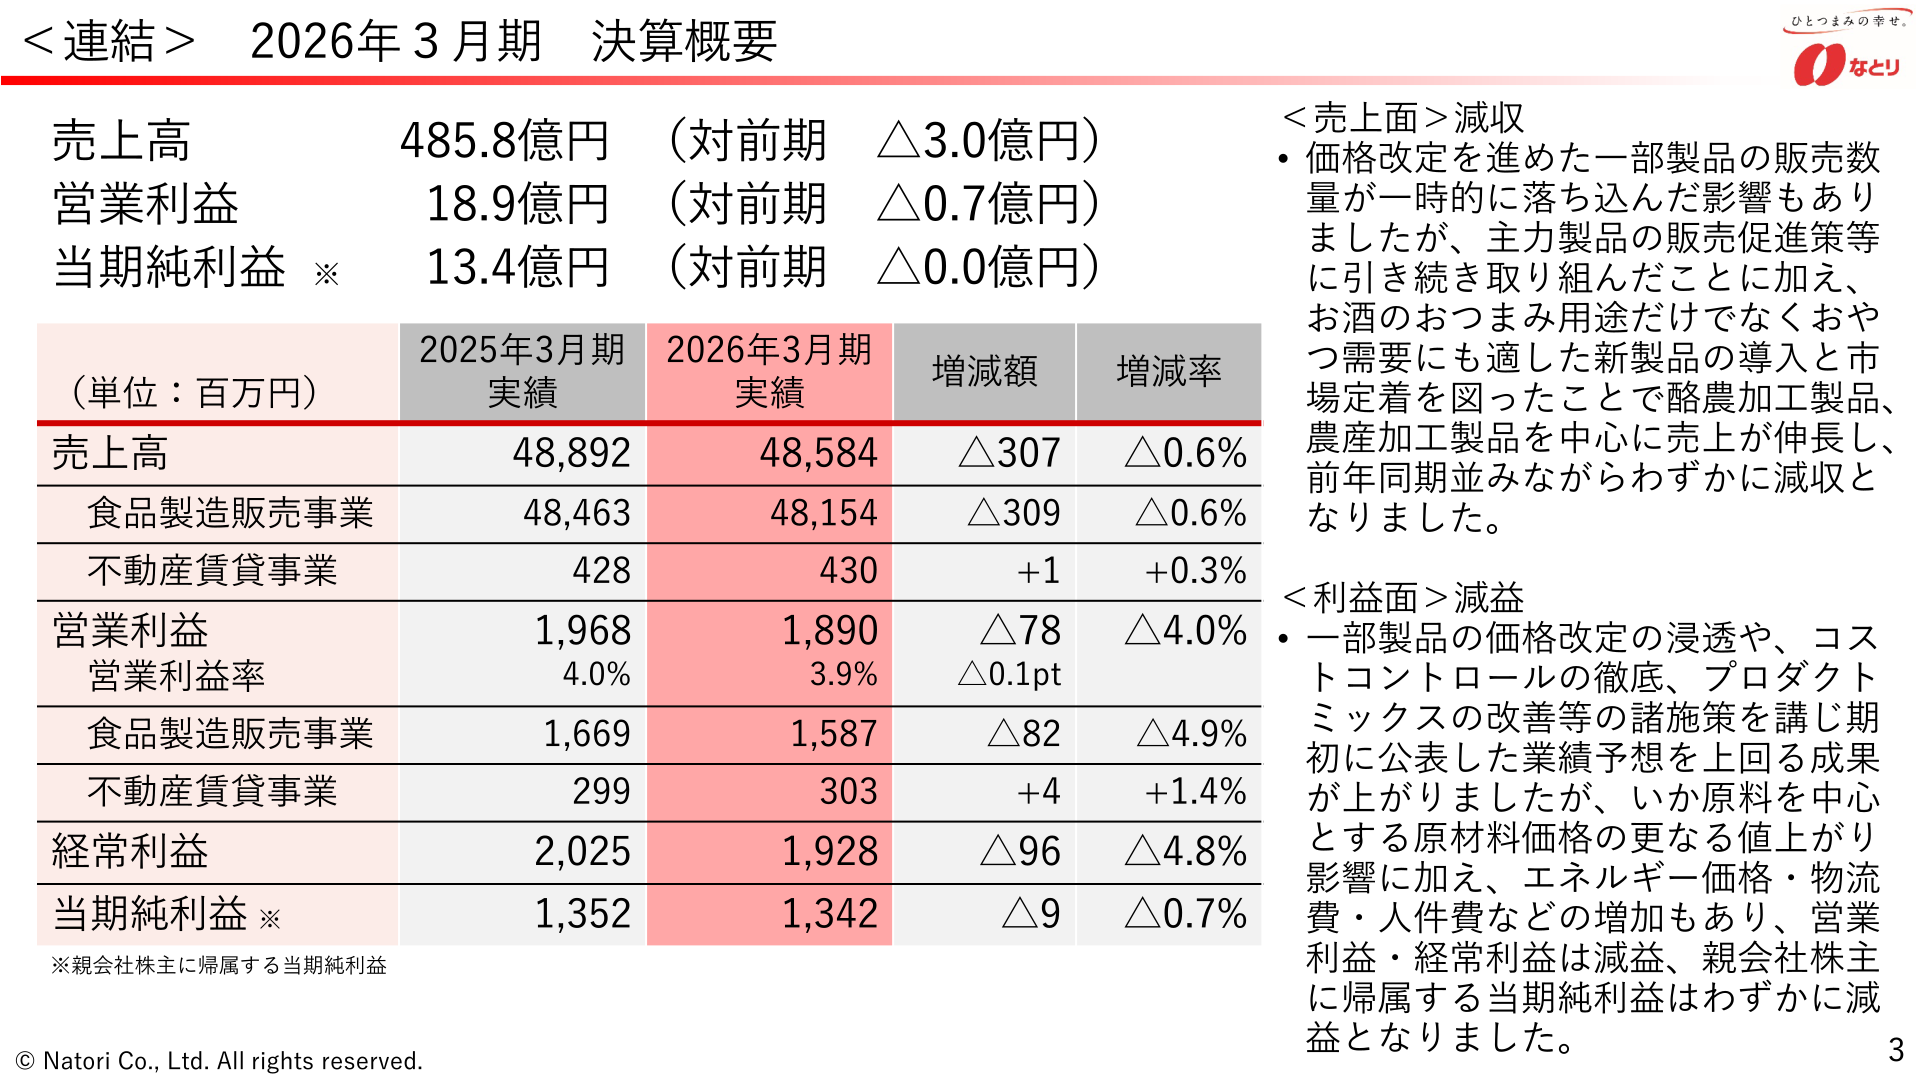
For the fiscal year ended March 31, 2026, NATORI posted net sales of 48.58 billion yen (down 0.30 billion yen year on year), operating profit of 1.89 billion yen (down 0.07 billion yen year on year) and net income of 1.34 billion yen (down 0.00 billion yen year on year), a decline in both sales and profit. Higher raw material prices, centred on squid raw materials, together with increases in energy prices, logistics costs and personnel expenses, weighed on profit, while sales grew mainly in processed dairy products and processed agricultural products and the results exceeded the earnings forecast announced at the start of the year. Higher sales and higher profit are expected for the fiscal year ending March 31, 2027.
Consolidated Results (Fiscal Year Ended March 31, 2026 Actual)
Net sales were 48,154 million yen in the food manufacturing and sales business (down 0.6% year on year) and 430 million yen in the real estate leasing business (up 0.3% year on year). Operating profit was 1,587 million yen in the food manufacturing and sales business (down 4.9% year on year) and 303 million yen in the real estate leasing business (up 1.4% year on year). Figures are in millions of yen, and net income refers to net income attributable to owners of the parent.
| Item | FY25/03 Actual | FY26/03 Actual | Change | Change (%) |
|---|---|---|---|---|
| Net sales | 48,892 | 48,584 | △307 | △0.6% |
| Food manufacturing and sales business | 48,463 | 48,154 | △309 | △0.6% |
| Real estate leasing business | 428 | 430 | +1 | +0.3% |
| Operating profit | 1,968 | 1,890 | △78 | △4.0% |
| Food manufacturing and sales business | 1,669 | 1,587 | △82 | △4.9% |
| Real estate leasing business | 299 | 303 | +4 | +1.4% |
| Ordinary profit | 2,025 | 1,928 | △96 | △4.8% |
| Net income* | 1,352 | 1,342 | △9 | △0.7% |
Net Sales by Product Category (Genre)
Within the food manufacturing and sales business, processed dairy products grew to 9,488 million yen (up 6.7% year on year) and processed agricultural products to 2,304 million yen (up 11.6% year on year), while processed marine products came to 19,428 million yen (down 3.8% year on year), reflecting factors including a temporary decline in the sales volume of squid products, for which price revisions and changes in package contents were carried out. The product category “pocket snack products” was named “ingredient snack products” up to the third-quarter results for the fiscal year ended March 31, 2026. Figures are in millions of yen.
| Product category | FY25/03 Actual | FY26/03 Actual | Change | Change (%) |
|---|---|---|---|---|
| Processed marine products | 20,197 | 19,428 | △769 | △3.8% |
| Processed meat products | 8,910 | 8,808 | △102 | △1.1% |
| Processed dairy products | 8,894 | 9,488 | +594 | +6.7% |
| Processed agricultural products | 2,063 | 2,304 | +240 | +11.6% |
| Pocket snack products* | 2,561 | 2,570 | +9 | +0.4% |
| Chilled products | 2,012 | 1,961 | △50 | △2.5% |
| Other products | 3,823 | 3,592 | △231 | △6.0% |
| Total | 48,463 | 48,154 | △309 | △0.6% |
Full-Year Forecast (Fiscal Year Ending March 31, 2027)
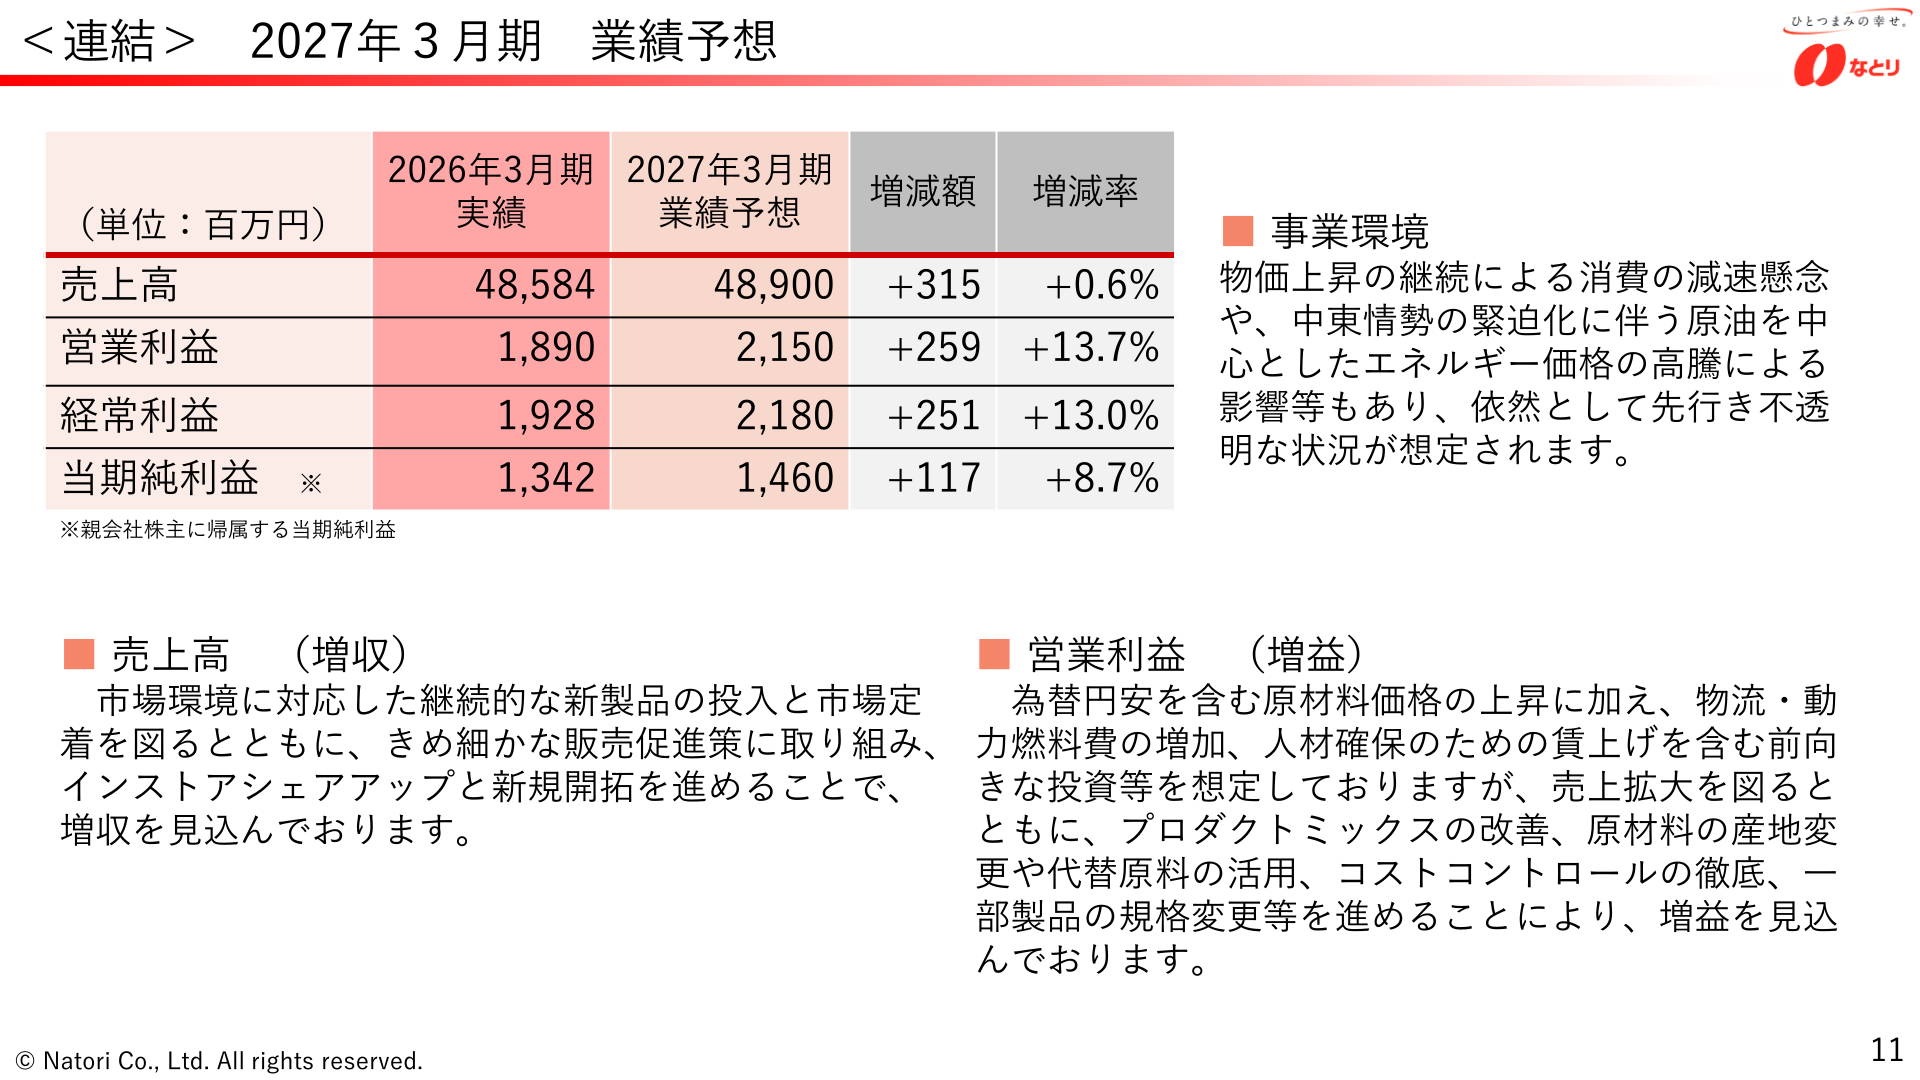
For the fiscal year ending March 31, 2027, the company expects higher sales through the continuous launch of new products matched to market conditions and their establishment in the market, and through in-store share gains and new account development driven by finely tuned sales promotion measures. While it assumes rising raw material prices including the effect of a weaker yen, increases in logistics and power and fuel costs, and forward-looking investment including wage increases, it expects higher profit through an improved product mix, changes in raw material sourcing areas and the use of alternative raw materials, thorough cost control, and specification changes for some products. Figures are in millions of yen.
| Item | FY27/03 Forecast | FY26/03 Actual | Change | Change (%) |
|---|---|---|---|---|
| Net sales | 48,900 | 48,584 | +315 | +0.6% |
| Operating profit | 2,150 | 1,890 | +259 | +13.7% |
| Ordinary profit | 2,180 | 1,928 | +251 | +13.0% |
| Net income* | 1,460 | 1,342 | +117 | +8.7% |
Dividend Policy and Shareholder Returns
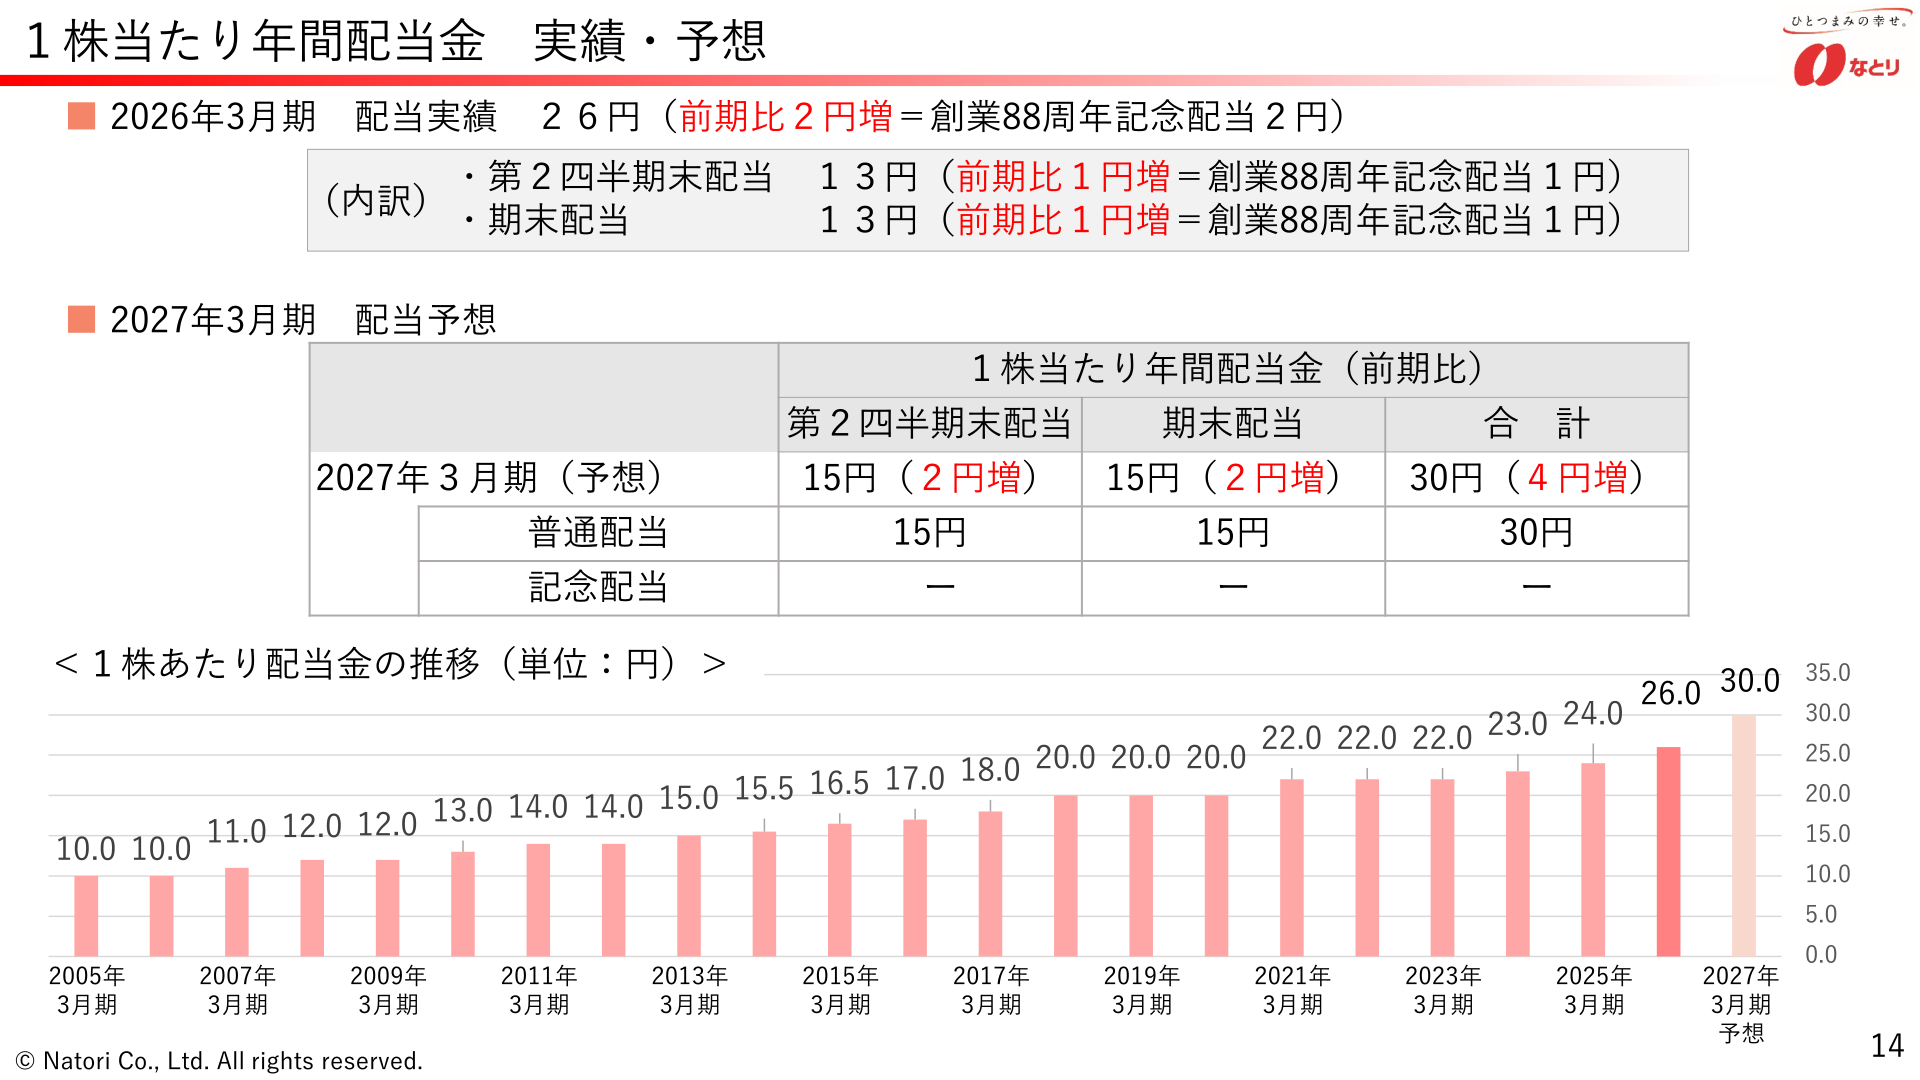
The company revised its dividend policy from the fiscal year ending March 31, 2027, adopting a policy of striving to increase dividends to shareholders in a stable and continuous manner. The dividend for the fiscal year ended March 31, 2026 was 26 yen for the year (up 2 yen year on year, including a 2 yen commemorative dividend marking the 88th anniversary of the company’s founding). For the fiscal year ending March 31, 2027, the company forecasts an annual dividend of 30 yen consisting of ordinary dividends only (up 4 yen year on year).
| Item | FY27/03 Forecast | FY26/03 Actual |
|---|---|---|
| Second-quarter-end dividend | 15 yen (up 2 yen) | 13 yen (up 1 yen year on year) |
| Year-end dividend | 15 yen (up 2 yen) | 13 yen (up 1 yen year on year) |
| Total | 30 yen (up 4 yen) | 26 yen (up 2 yen year on year) |
Performance Trends
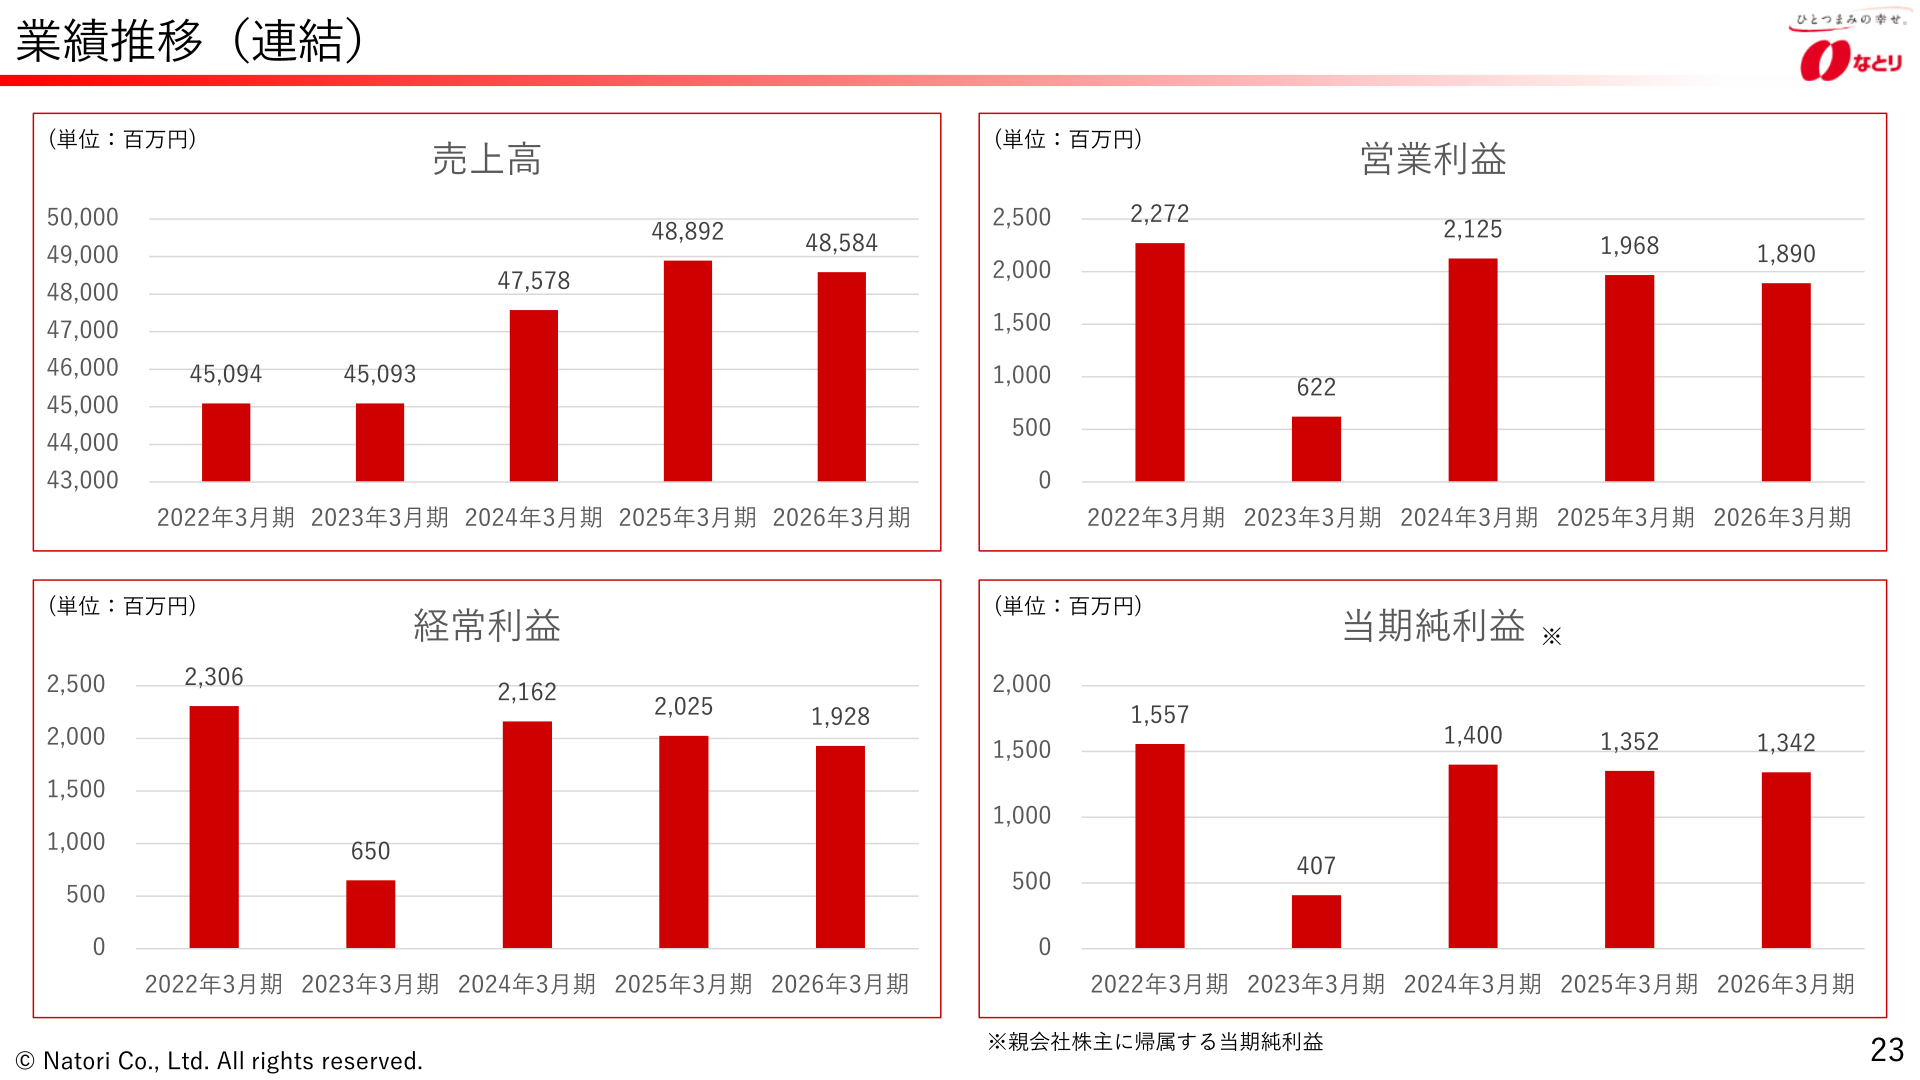
Consolidated net sales moved from 45,094 million yen in FY22/03 to 45,093 million yen in FY23/03, 47,578 million yen in FY24/03, 48,892 million yen in FY25/03 and 48,584 million yen in FY26/03. Over the same period, operating profit was 2,272 million yen, 622 million yen, 2,125 million yen, 1,968 million yen and 1,890 million yen, and net income was 1,557 million yen, 407 million yen, 1,400 million yen, 1,352 million yen and 1,342 million yen.
This article is an analysis based on publicly available information and is not a recommendation to buy or sell any specific securities. Investment decisions are your own responsibility.
















