
This article is based on publicly available IR materials and is not a recommendation to buy or sell any specific securities.
Note: The company labels the fiscal year ended February 28, 2026 as “FY2/2026”; on this site it is classified as FY2025, and all labels in the text, tables and segment data below follow the company’s own materials.
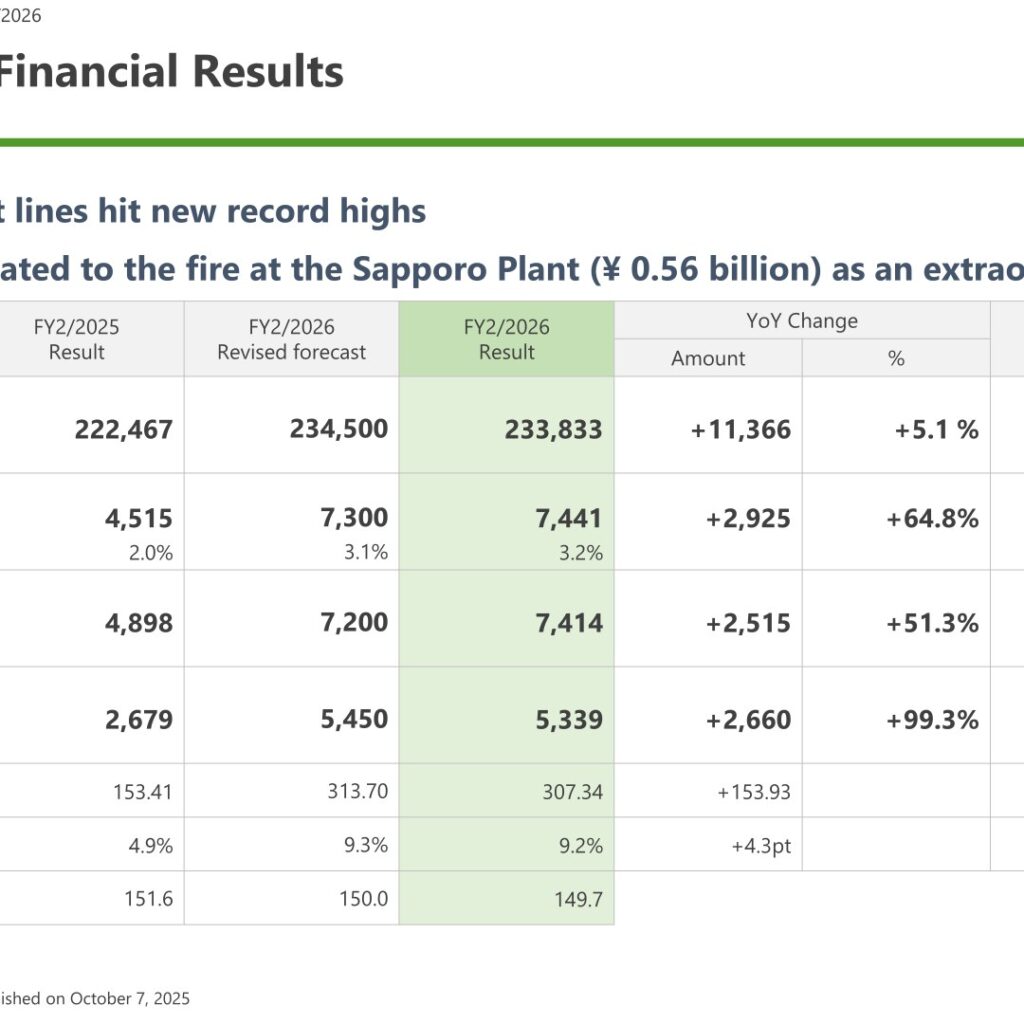
Warabeya Nichiyo Holdings reported net sales of 233,833 million yen for FY2/2026, up 5.1% year on year, with operating profit of 7,441 million yen (up 64.8%), ordinary profit of 7,414 million yen (up 51.3%) and profit attributable to owners of parent of 5,339 million yen (up 99.3%). The company states that sales and all profit lines hit new record highs. Costs related to the fire at the Sapporo Plant of 0.56 billion yen were recorded as an extraordinary loss. For FY2/2027 the company forecasts higher sales and increases in operating profit and ordinary profit, while profit attributable to owners of parent is projected to decline.
Consolidated Results (Full-Year Actual)
Against the revised forecast published on October 7, 2025, net sales came in 666 million yen lower, while operating profit exceeded the forecast by 141 million yen and ordinary profit by 214 million yen. The operating profit margin rose to 3.2% from 2.0% and ROE improved 4.3 points to 9.2%. The average US dollar exchange rate was 149.7 yen, against 151.6 yen in the previous fiscal year.
| Item (Millions of yen) | FY2/2025 Result | FY2/2026 Revised forecast | FY2/2026 Result | YoY Change (Amount) | YoY Change (%) | Vs. Forecast |
|---|---|---|---|---|---|---|
| Net sales | 222,467 | 234,500 | 233,833 | +11,366 | +5.1 % | (666) |
| Operating profit | 4,515 | 7,300 | 7,441 | +2,925 | +64.8% | +141 |
| Operating profit margin | 2.0% | 3.1% | 3.2% | – | – | – |
| Ordinary profit | 4,898 | 7,200 | 7,414 | +2,515 | +51.3% | +214 |
| Profit (attributable to owners of parent) | 2,679 | 5,450 | 5,339 | +2,660 | +99.3% | (110) |
| EPS (yen) | 153.41 | 313.70 | 307.34 | +153.93 | – | – |
| ROE | 4.9% | 9.3% | 9.2% | +4.3pt | – | – |
| US$ Exchange rate (yen) | 151.6 | 150.0 | 149.7 | – | – | – |
Below the operating line, non-operating income was 1,076 million yen and non-operating expenses 1,103 million yen. Extraordinary income of 466 million yen comprised a gain on sale of non-current assets of 0.35 billion yen and a gain on reversal of asset retirement obligations of 0.11 billion yen. Extraordinary losses of 641 million yen included the loss on fire of 0.56 billion yen and impairment losses of 0.07 billion yen, against impairment losses of 1.08 billion yen in the previous fiscal year. Profit before income taxes was 7,239 million yen and total income taxes were 1,625 million yen.
On the balance sheet, total assets rose 10.8 billion yen to 131.7 billion yen and total net assets rose 3.0 billion yen to 62.1 billion yen, while interest-bearing debt increased 2.2 billion yen to 36.4 billion yen and the equity ratio fell 1.8 points to 45.1%. Cash flows from operating activities were 16,960 million yen, cash flows from investing activities were negative 13,482 million yen and cash flows from financing activities were negative 1,864 million yen, leaving cash and cash equivalents at the end of the period at 10,378 million yen.
Segment Results
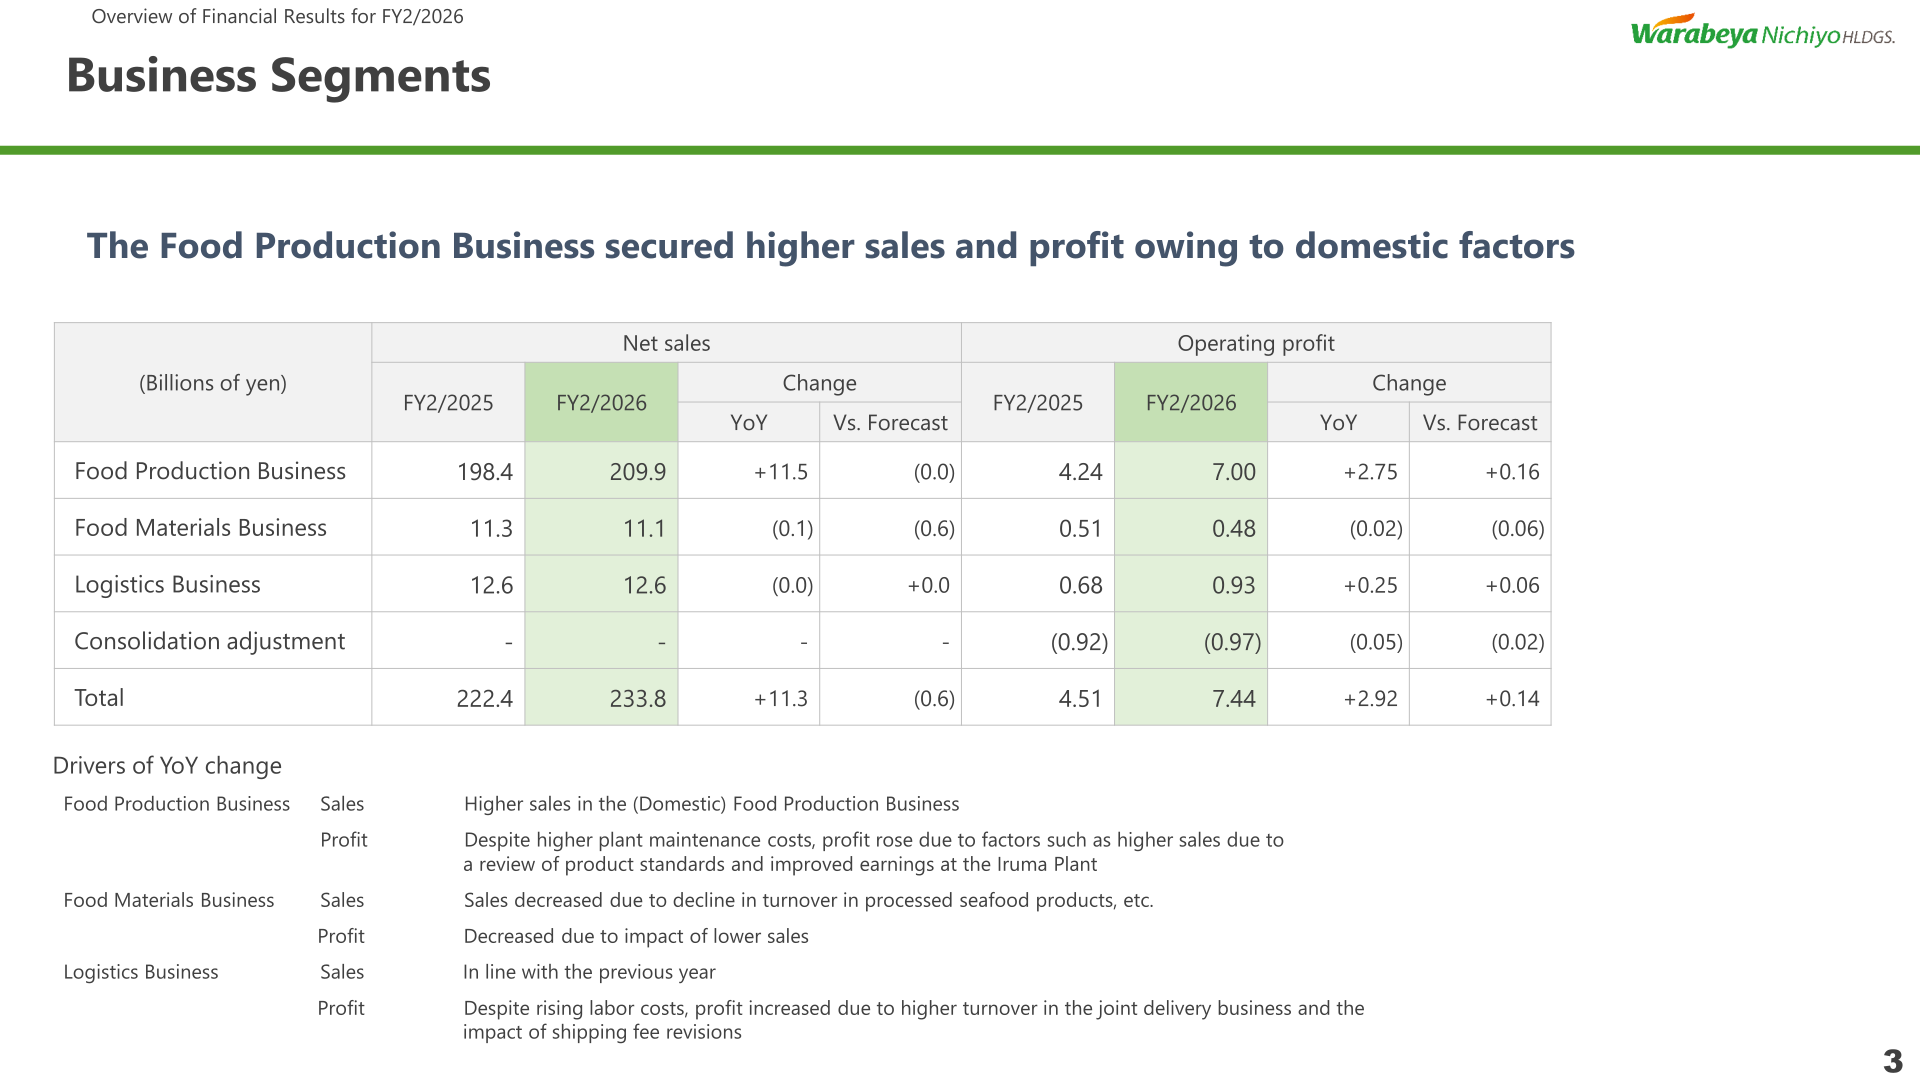
The Food Production Business secured higher sales and profit owing to domestic factors. Sales rose in the domestic Food Production Business and, despite higher plant maintenance costs, profit rose due to factors such as higher sales from a review of product standards and improved earnings at the Iruma Plant. In the Food Materials Business, sales decreased due to a decline in turnover in processed seafood products and other items, and profit decreased on the impact of lower sales. Logistics Business sales were in line with the previous year, and despite rising labor costs profit increased on higher turnover in the joint delivery business and the impact of shipping fee revisions.
| Segment (Billions of yen) | Net sales FY2/2025 | Net sales FY2/2026 | Net sales YoY Change | Operating profit FY2/2025 | Operating profit FY2/2026 | Operating profit YoY Change |
|---|---|---|---|---|---|---|
| Food Production Business | 198.4 | 209.9 | +11.5 | 4.24 | 7.00 | +2.75 |
| Food Materials Business | 11.3 | 11.1 | (0.1) | 0.51 | 0.48 | (0.02) |
| Logistics Business | 12.6 | 12.6 | (0.0) | 0.68 | 0.93 | +0.25 |
| Consolidation adjustment | – | – | – | (0.92) | (0.97) | (0.05) |
| Total | 222.4 | 233.8 | +11.3 | 4.51 | 7.44 | +2.92 |
In the breakdown of the year-on-year change in operating profit, an increase in manufacturing costs of 10.78 billion yen (raw materials prices 8.50 billion yen, personnel expenses 1.63 billion yen, utility and logistics expenses 0.65 billion yen) was offset by 12.64 billion yen from changing product standards and higher sales, 1.20 billion yen from the Iruma Plant, 0.24 billion yen from the Isesaki Plant and 1.02 billion yen from lower plant reorganization costs, while plant maintenance costs and other items reduced profit by 1.11 billion yen and the overseas business by 0.46 billion yen. Group Business and other items added 0.17 billion yen, taking operating profit from 4.51 billion yen to 7.44 billion yen.
In the domestic Food Production Business, net sales by product reached 183,101 million yen. Cooked Rice Products were 124,185 million yen (up 8,557 million yen), of which Onigiri Rice Balls were 62,816 million yen (up 5,795 million yen), Chilled Bento Meal Boxes 34,586 million yen (up 4,349 million yen), Bento Meal Boxes 15,098 million yen (down 2,924 million yen) and Sushi 11,684 million yen (up 1,337 million yen). Side Dishes and Cooked Noodles rose 3,316 million yen to 25,792 million yen, while Bread Products (Chilled Bread) fell 1,044 million yen to 13,631 million yen. The number of stores supplied was 18,415, an increase of 142. Overseas, U.S. sales were 26,876 million yen on a yen basis and 179,525 thousand dollars on a dollar basis, with 2,167 stores supplied.
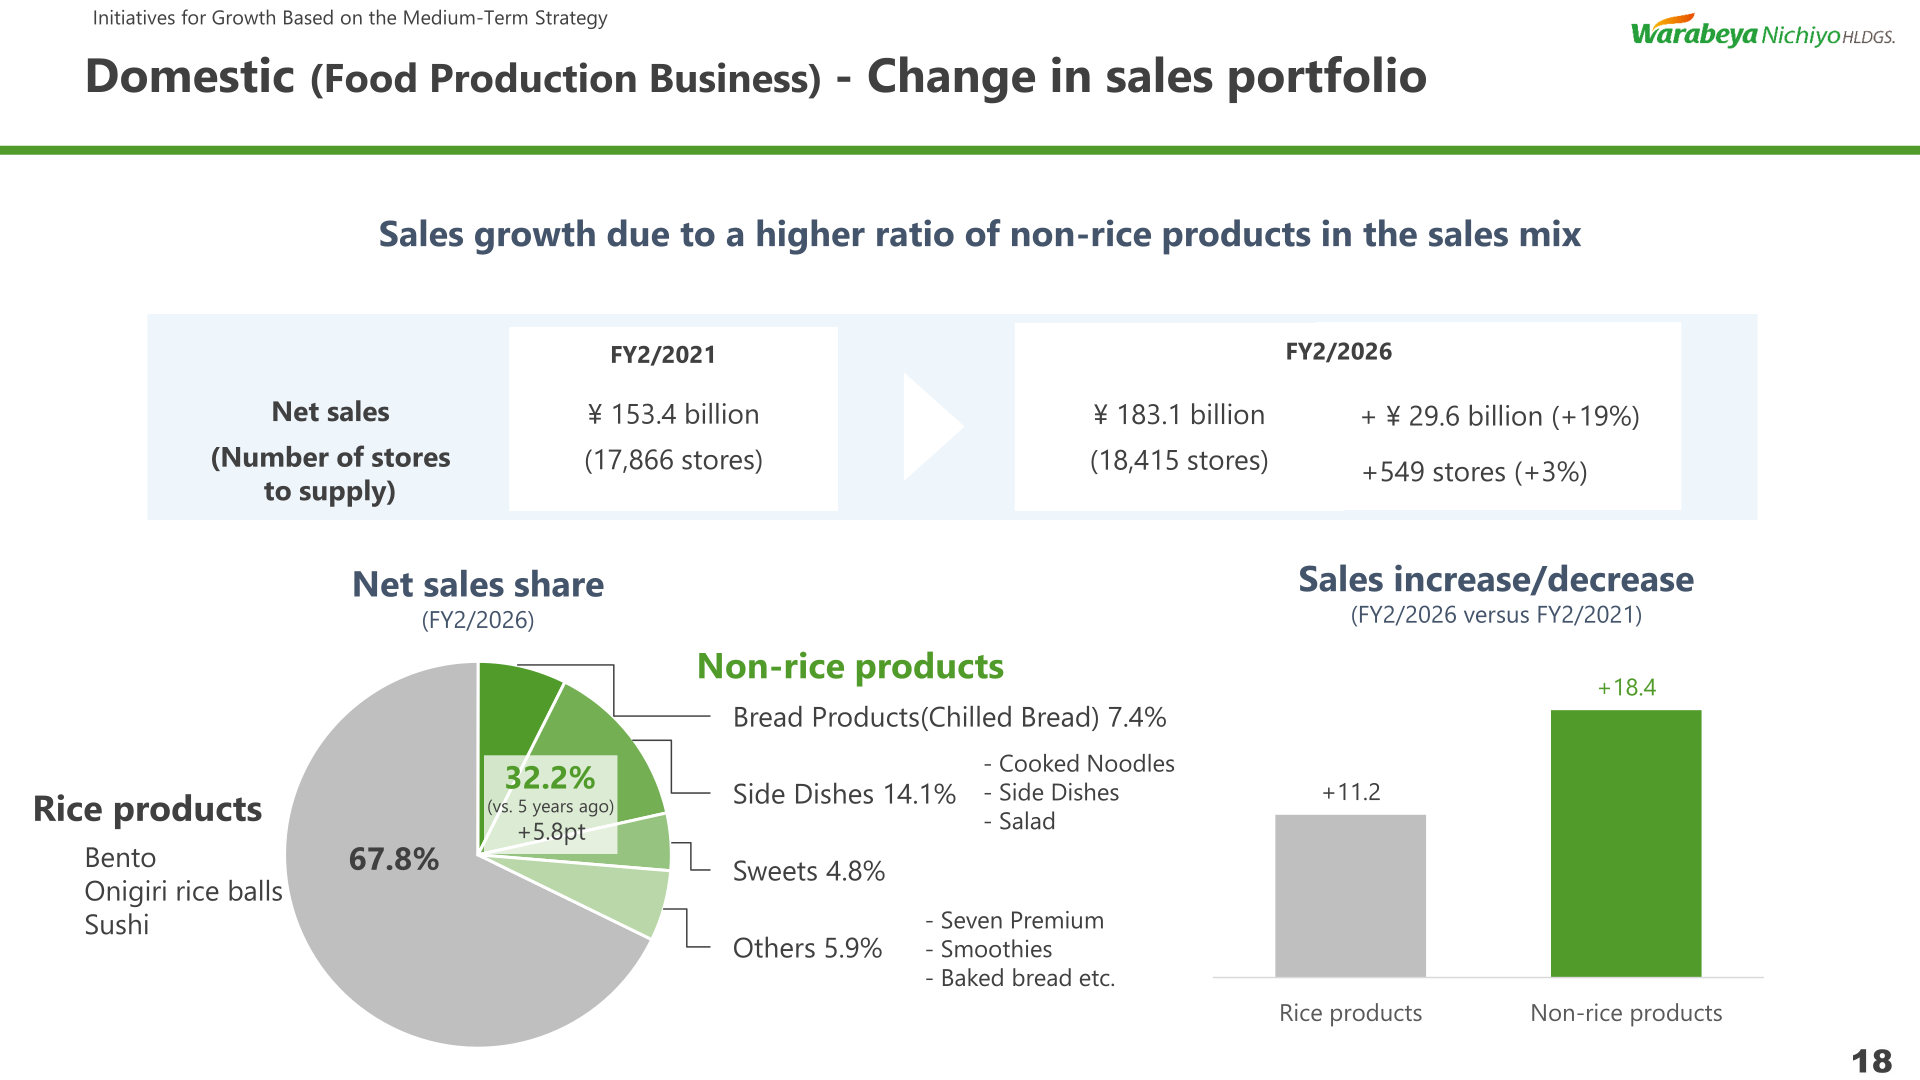
By sales mix in FY2/2026, rice products accounted for 67.8% of domestic Food Production Business sales and non-rice products for 32.2%, with Side Dishes at 14.1%, Bread Products (Chilled Bread) at 7.4%, Sweets at 4.8% and Others at 5.9%. Domestic net sales rose from 153.4 billion yen with 17,866 stores supplied in FY2/2021 to 183.1 billion yen with 18,415 stores in FY2/2026, an increase of 29.6 billion yen (+19%) and 549 stores (+3%), with the non-rice ratio up 5.8 points versus five years earlier.
Full-Year Forecast (FY2/2027)
The company forecasts higher sales and increases in operating profit and ordinary profit, factoring in the impact of the Sapporo Plant fire and the fact that the Ohio Plant has not started operations. Since there is no timeline for resuming operations, the company does not anticipate a restart of the Sapporo Plant in FY2/2027; the stated year-on-year impact is net sales of minus 6.00 billion yen, operating profit of minus 0.33 billion yen and ordinary profit of minus 0.53 billion yen. As the start-up date of the Ohio Plant is undetermined, its operation has not been factored into the forecast (the previous assumption was net sales of minus 5.00 billion yen and operating profit of minus 0.50 billion yen). Profit is projected to decrease year on year due to higher tax expenses, following a temporary decrease in tax expenses in the previous period of minus 0.40 billion yen.
| Item (Millions of yen) | FY2/2026 Result | FY2/2027 Forecast | YoY Change (Amount) | YoY Change (%) |
|---|---|---|---|---|
| Net sales | 233,833 | 241,000 | +7,166 | +3.1% |
| Operating profit | 7,441 | 7,700 | +258 | +3.5% |
| Operating profit margin | 3.2% | 3.2% | – | – |
| Ordinary profit | 7,414 | 7,650 | +235 | +3.2% |
| Profit (attributable to owners of parent) | 5,339 | 4,800 | (539) | (10.1)% |
| EPS (yen) | 307.34 | 277.20 | (30.14) | – |
| ROE | 9.2% | 7.9% | (1.3)pt | – |
| US$ Exchange rate (yen) | 149.7 | 155.0 | – | – |
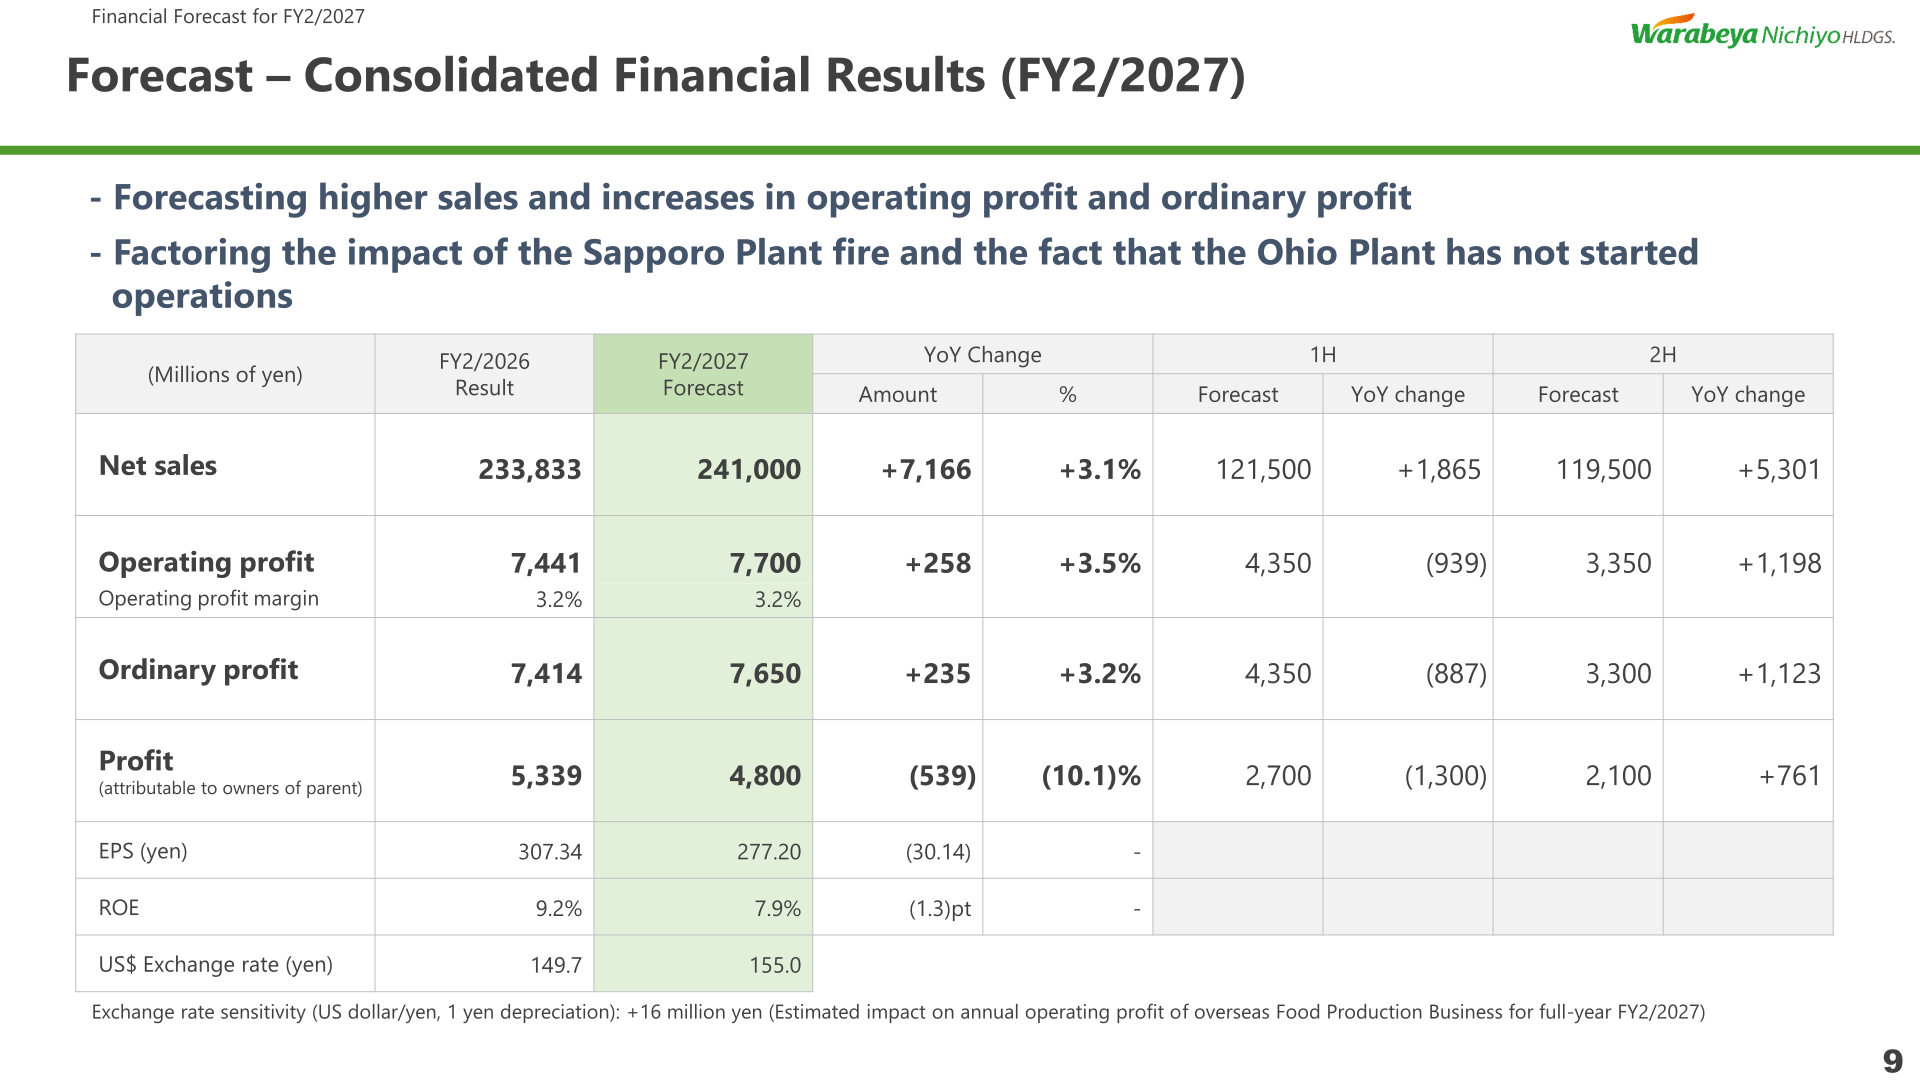
By half year, the company forecasts first-half net sales of 121,500 million yen (up 1,865 million yen) and second-half net sales of 119,500 million yen (up 5,301 million yen). First-half operating profit is forecast at 4,350 million yen (down 939 million yen) and second-half operating profit at 3,350 million yen (up 1,198 million yen). Exchange rate sensitivity is given as plus 16 million yen for each 1 yen depreciation of the yen against the US dollar, as the estimated impact on annual operating profit of the overseas Food Production Business for full-year FY2/2027.
Shareholder Returns
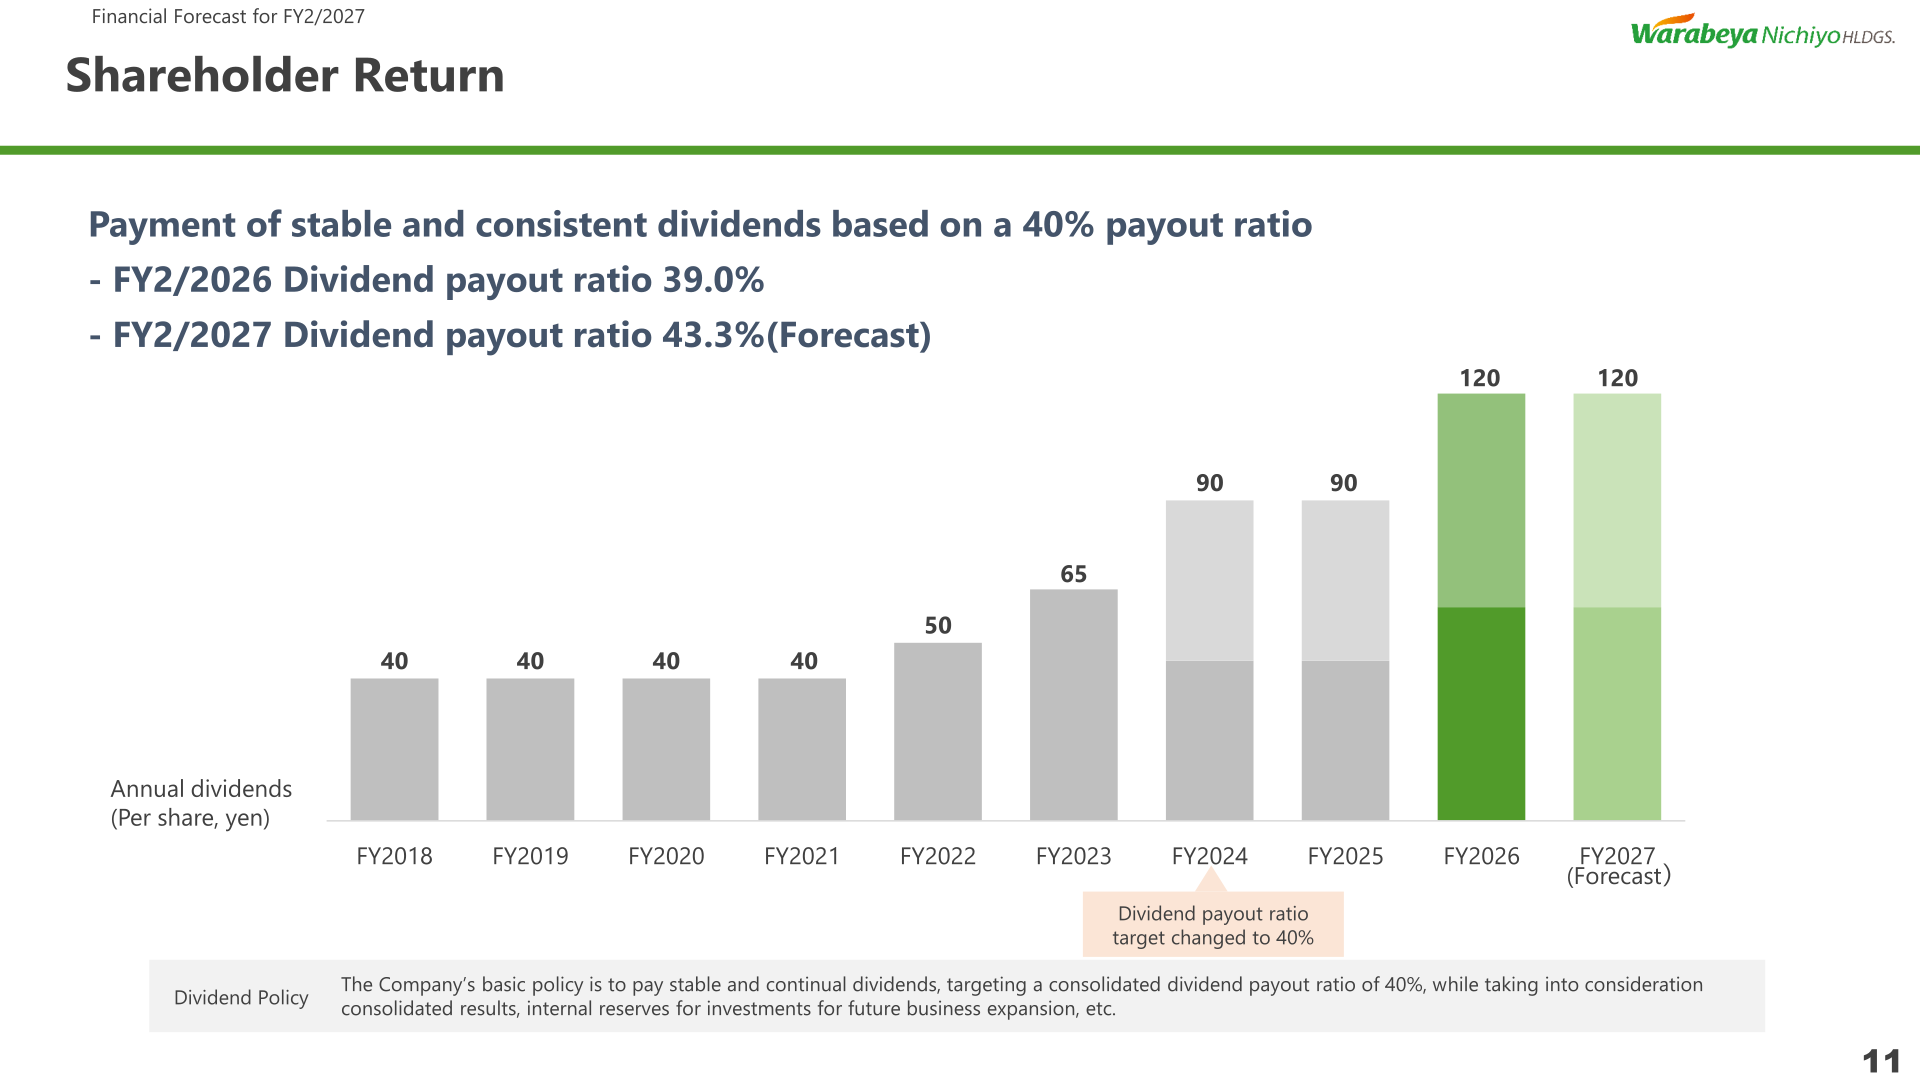
The company’s basic policy is to pay stable and continual dividends, targeting a consolidated dividend payout ratio of 40%, while taking into consideration consolidated results and internal reserves for investments for future business expansion. The annual dividend for FY2/2026 was 120 yen per share, for a payout ratio of 39.0%, and the company forecasts an annual dividend of 120 yen per share for FY2/2027, for a payout ratio of 43.3%.
| Item | FY2/2025 | FY2/2026 | FY2/2027 (Forecast) |
|---|---|---|---|
| Annual dividend per share (yen) | 90 | 120 | 120 |
| Dividend payout ratio | 58.7% | 39.0% | 43.3% |
Medium-Term Plan and Topics
The medium-term targets for FY2/2028 are net sales of 250 billion yen, operating profit of 10 billion yen and ROE of 10% or more. FY2/2026 was the third year of the plan, during which the Isesaki Plant started operations in March 2025 and maintenance was strengthened to ensure stable operation of existing plants. Operating profit by segment over the plan period moved from 5.04 billion yen in FY2/2023 to 7.00 billion yen in FY2/2026 for the Food Production Business, and from 0.73 billion yen to 1.41 billion yen for Food Materials and Logistics combined, with Other and consolidation adjustment at negative 0.97 billion yen in FY2/2026.
With two years remaining to achieve the plan’s goals, the company will focus on strengthening the domestic business, the overseas supply structure and the response to rising costs. Site reorganization under the current medium-term plan will be completed with the closure of the Murayama Plant No. 2, scheduled for February 2027, with manufacturing transferred to the Sagamihara Plant. Effective March 1, 2026, Warabeya Nichiyo Foods will be split to newly establish Warabeya Chubu, Warabeya Kansai and Warabeya Hokkaido, delegating decision-making authority to conduct agile business operations on a regional basis.
In North America, the company supplied 2,100 stores as of the end of December 2025 and is test-marketing a frozen counter product, “Ookii Bun,” offered in three flavors, having decided to install equipment with a view to a full-scale roll-out in the next fiscal year. In the Group businesses, frozen warehouses are scheduled to start operation in spring 2027. The Food Science Center, a core site for quality control located in Yoshikawa-shi, Saitama, opened in January 2026 to centralize quality inspection and evaluation functions.
This article is an analysis based on publicly available information and is not a recommendation to buy or sell any specific securities. Investment decisions are your own responsibility.
















