
This article is based on publicly available IR materials and is not a recommendation to buy or sell any specific securities.
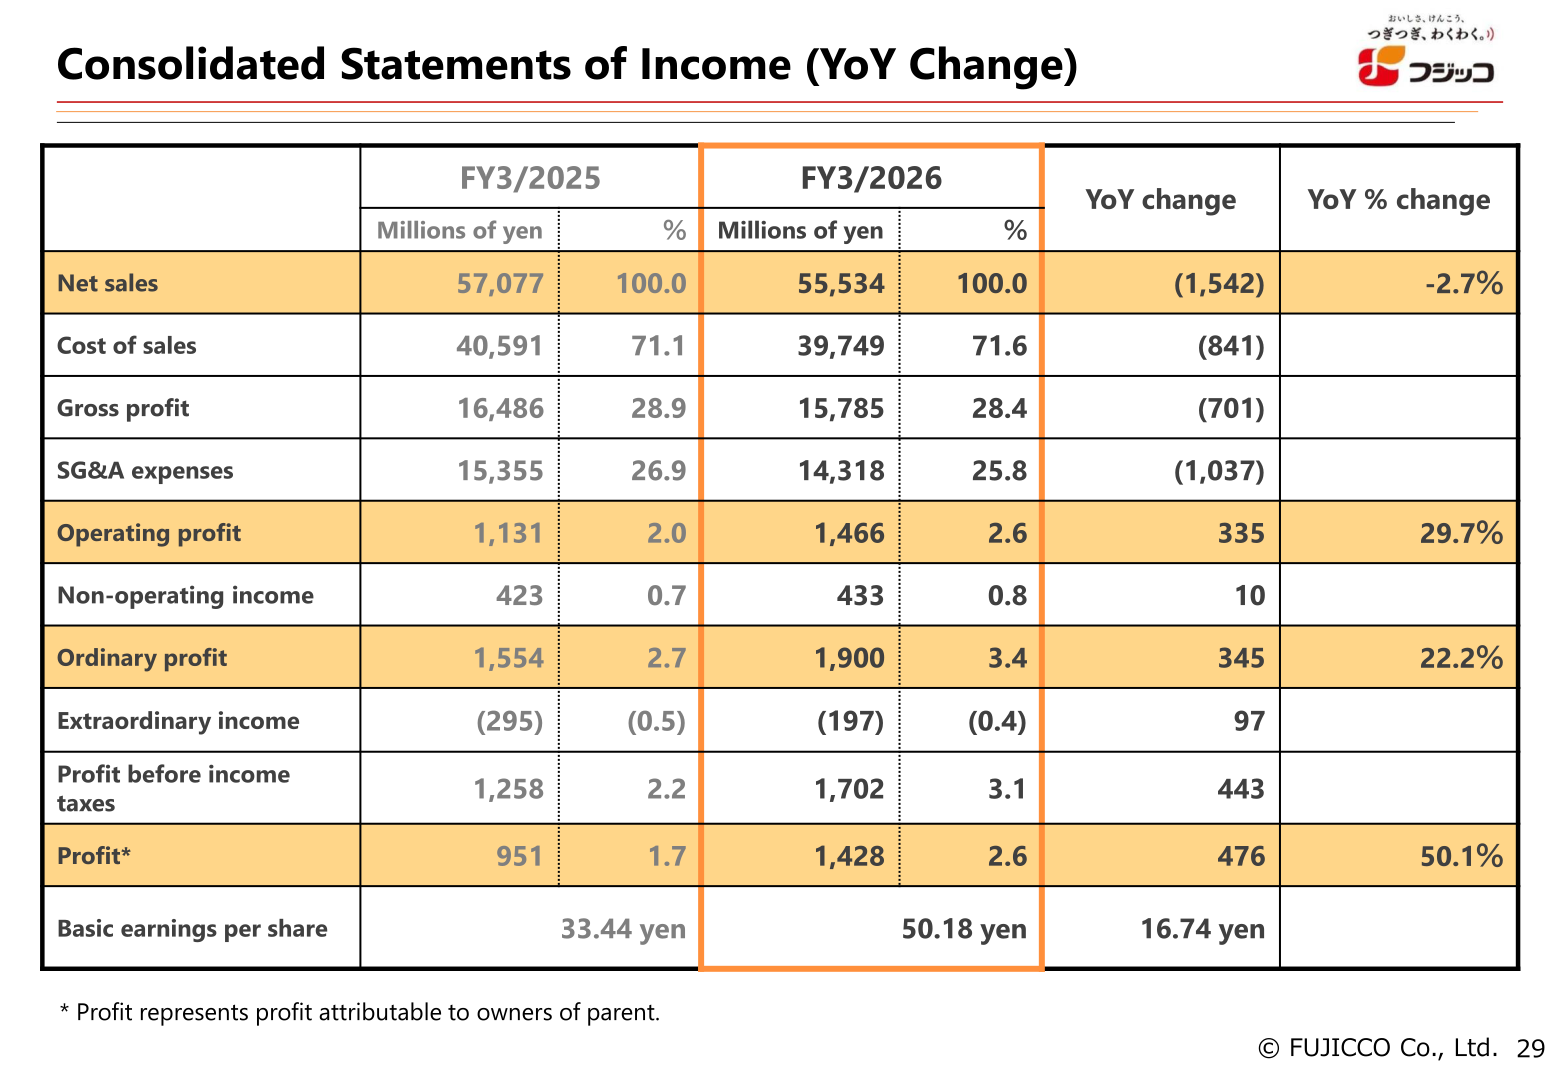
FUJICCO Co., Ltd. reported net sales of 55,534 million yen for the fiscal year ended March 31, 2026, down 1,542 million yen or 2.7% year on year, while operating profit rose 335 million yen or 29.7% to 1,466 million yen. Ordinary profit increased 22.2% to 1,900 million yen and profit attributable to owners of parent rose 50.1% to 1,428 million yen. The company states that the curb on fixed SG&A expenses through structural transformation and ROI-focused advertising proved successful, absorbing the impact of lower sales and resulting in an increase in operating profit. Basic earnings per share was 50.18 yen.
Note on year labels: the company labels the fiscal year ended March 31, 2026 as “FY3/2026” and the following year as “FY3/2027”; this site classifies the most recent completed fiscal year as FY2025, and the labels used in the text, tables and segment data below follow the source materials.
Consolidated Results (Full-Year Actual)
Cost of sales was 39,749 million yen, or 71.6% of net sales, against 71.1% a year earlier, and gross profit fell 701 million yen to 15,785 million yen. SG&A expenses declined 1,037 million yen to 14,318 million yen, or 25.8% of net sales versus 26.9% in the previous year, lifting the operating profit margin from 2.0% to 2.6%.
| Item (Millions of yen) | FY3/2025 | FY3/2026 | YoY change | YoY % change |
|---|---|---|---|---|
| Net sales | 57,077 | 55,534 | (1,542) | -2.7% |
| Cost of sales | 40,591 | 39,749 | (841) | — |
| Gross profit | 16,486 | 15,785 | (701) | — |
| SG&A expenses | 15,355 | 14,318 | (1,037) | — |
| Operating profit | 1,131 | 1,466 | 335 | 29.7% |
| Non-operating income | 423 | 433 | 10 | — |
| Ordinary profit | 1,554 | 1,900 | 345 | 22.2% |
| Profit before income taxes | 1,258 | 1,702 | 443 | — |
| Profit attributable to owners of parent | 951 | 1,428 | 476 | 50.1% |
| Basic earnings per share | 33.44 yen | 50.18 yen | 16.74 yen | — |
On extraordinary items, the materials show extraordinary income of 492 million yen in FY3/2025 and 141 million yen in FY3/2026, and extraordinary loss of 788 million yen and 339 million yen respectively, for a net balance of (295) million yen and (197) million yen — an improvement of 97 million yen.
Results by Product Category
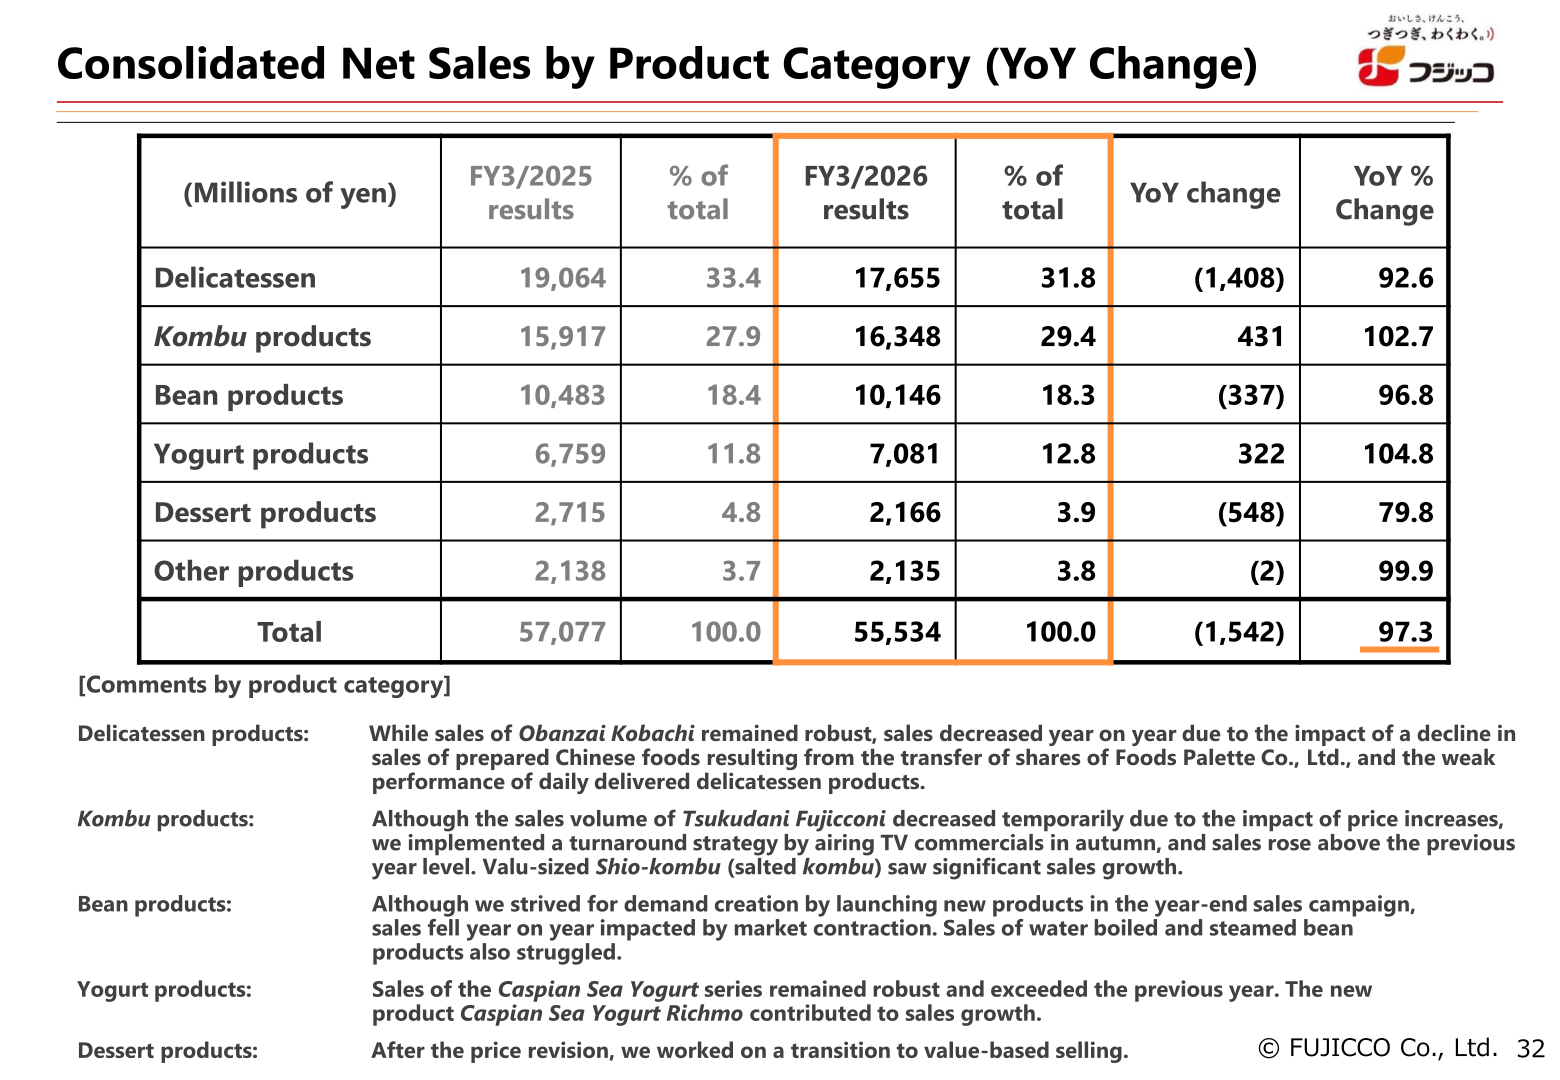
Kombu products and yogurt products grew year on year, while delicatessen, bean and dessert products declined. In the following table, the right-hand column is presented in the materials as an index of net sales against the previous fiscal year (the previous year equals 100), not as a rate of change.
| Product category (Millions of yen) | FY3/2025 results | % of total | FY3/2026 results | % of total | YoY change | % of previous year |
|---|---|---|---|---|---|---|
| Delicatessen | 19,064 | 33.4 | 17,655 | 31.8 | (1,408) | 92.6 |
| Kombu products | 15,917 | 27.9 | 16,348 | 29.4 | 431 | 102.7 |
| Bean products | 10,483 | 18.4 | 10,146 | 18.3 | (337) | 96.8 |
| Yogurt products | 6,759 | 11.8 | 7,081 | 12.8 | 322 | 104.8 |
| Dessert products | 2,715 | 4.8 | 2,166 | 3.9 | (548) | 79.8 |
| Other products | 2,138 | 3.7 | 2,135 | 3.8 | (2) | 99.9 |
| Total | 57,077 | 100.0 | 55,534 | 100.0 | (1,542) | 97.3 |
By category, the materials note that delicatessen sales decreased on a decline in prepared Chinese foods following the transfer of shares of Foods Palette Co., Ltd. and weak daily delivered delicatessen products; kombu product sales rose above the previous year level after a turnaround strategy centered on autumn TV commercials, with value-sized Shio-kombu (salted kombu) seeing significant growth; bean product sales fell on market contraction despite new products in the year-end sales campaign; yogurt product sales exceeded the previous year, with the new Caspian Sea Yogurt Richmo contributing to growth; and for dessert products the company worked on a transition to value-based selling after the price revision.
Quarterly Trend and Comparison with the Revised Forecast
Quarterly net sales were below the prior year in every quarter, while operating profit improved year on year in the first three quarters. In the table below, the right-hand columns are shown in the materials as an index against the same quarter of the previous year.
| Quarter (Millions of yen) | Net sales FY3/2025 | Net sales FY3/2026 | Net sales % of previous year | Operating profit FY3/2025 | Operating profit FY3/2026 | Operating profit margin FY3/2026 |
|---|---|---|---|---|---|---|
| Q1 (Apr.–Jun.) | 13,931 | 13,836 | 99.3% | 6 | 242 | 1.8% |
| Q2 (Jul.–Sept.) | 14,124 | 13,908 | 98.5% | 251 | 264 | 1.9% |
| Q3 (Oct.–Dec.) | 15,790 | 14,982 | 94.9% | 659 | 774 | 5.2% |
| Q4 (Jan.–Mar.) | 13,231 | 12,807 | 96.8% | 213 | 185 | 1.4% |
Against the forecast revised on October 24, net sales of 55,534 million yen fell 1,065 million yen (-1.9%) short of the 56,600 million yen plan and operating profit of 1,466 million yen was 183 million yen (-11.1%) below the 1,650 million yen plan, while ordinary profit matched the 1,900 million yen plan and profit attributable to owners of parent of 1,428 million yen exceeded the 1,350 million yen plan by 78 million yen (5.8%). The company explains that the decrease in contribution margin due to lower sales significantly impacted operating profit even as various costs were steadily reduced through structural transformation and management streamlining.
Financial Position
Total assets stood at 80,089 million yen as of March 31, 2026 against 79,429 million yen a year earlier, and net assets were 69,686 million yen against 68,596 million yen. The equity-to-asset ratio improved from 86.4% to 86.9%. Cash and deposits decreased 1,443 million yen from 11,692 million yen to 10,249 million yen, with inventories and other items rising from 13,250 million yen to 15,903 million yen. The materials cite profit before income taxes of 1,702 million yen and depreciation of 3,512 million yen as positive factors, and an increase in inventories of (2,417) million yen, purchase of non-current assets of (2,707) million yen, purchase of shares of subsidiaries of (869) million yen, contribution to a retirement benefit trust of (530) million yen and dividends of (1,313) million yen as negative factors, alongside a 1,000 million yen short-term transfer of long-term time deposits.
FY3/2027 Forecast
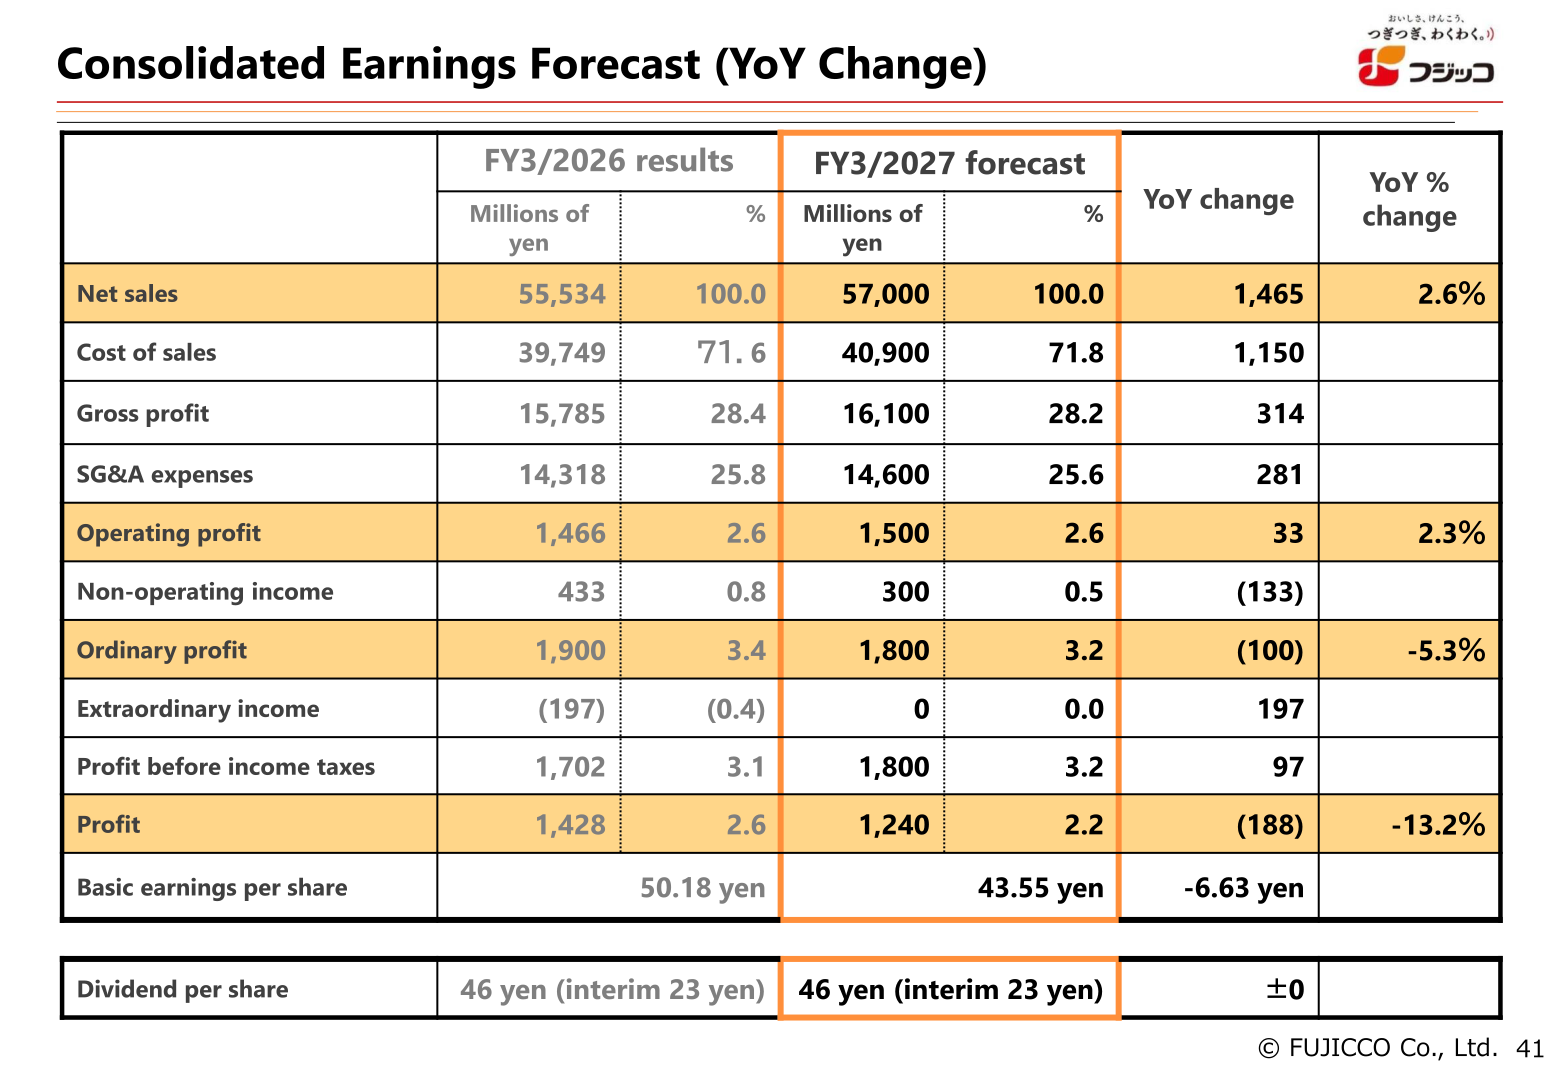
For the fiscal year ending March 31, 2027 the company forecasts higher sales and operating profit but lower ordinary profit and net profit. It states that it aims to increase both sales and profit for the full fiscal year by increasing the contribution margin including product price increases, absorbing the increase in material costs, and curbing labor costs through productivity improvements via DX investment.
| Item (Millions of yen) | FY3/2026 results | FY3/2027 forecast | YoY change | YoY % change |
|---|---|---|---|---|
| Net sales | 55,534 | 57,000 | 1,465 | 2.6% |
| Cost of sales | 39,749 | 40,900 | 1,150 | — |
| Gross profit | 15,785 | 16,100 | 314 | — |
| SG&A expenses | 14,318 | 14,600 | 281 | — |
| Operating profit | 1,466 | 1,500 | 33 | 2.3% |
| Non-operating income | 433 | 300 | (133) | — |
| Ordinary profit | 1,900 | 1,800 | (100) | -5.3% |
| Profit before income taxes | 1,702 | 1,800 | 97 | — |
| Profit | 1,428 | 1,240 | (188) | -13.2% |
| Basic earnings per share | 50.18 yen | 43.55 yen | -6.63 yen | — |
| Dividend per share | 46 yen (interim 23 yen) | 46 yen (interim 23 yen) | ±0 | — |
| Product category (Millions of yen) | FY3/2026 results | % of total | FY3/2027 forecast | % of total | YoY change | % of previous year |
|---|---|---|---|---|---|---|
| Delicatessen | 17,655 | 31.8 | 19,521 | 34.2 | 1,866 | 110.6 |
| Kombu products | 16,348 | 29.4 | 15,929 | 28.0 | (419) | 97.4 |
| Bean products | 10,146 | 18.3 | 9,952 | 17.5 | (193) | 98.1 |
| Yogurt products | 7,081 | 12.8 | 7,597 | 13.3 | 515 | 107.3 |
| Dessert products | 2,166 | 3.9 | 2,116 | 3.7 | (49) | 97.7 |
| Other products | 2,135 | 3.8 | 1,882 | 3.3 | (253) | 88.1 |
| Total | 55,534 | 100.0 | 57,000 | 100.0 | 1,465 | 102.6 |
On capital spending, the materials state that in FY3/2026 the company made an investment in establishing a production line for Richmo, and that in FY3/2027 it plans investments of 3.3 billion yen such as for facility renewals and labor-saving aimed at streamlining each plant, with depreciation projected to be at the same level as the previous fiscal year at 3.5 billion yen.
Shareholder Returns
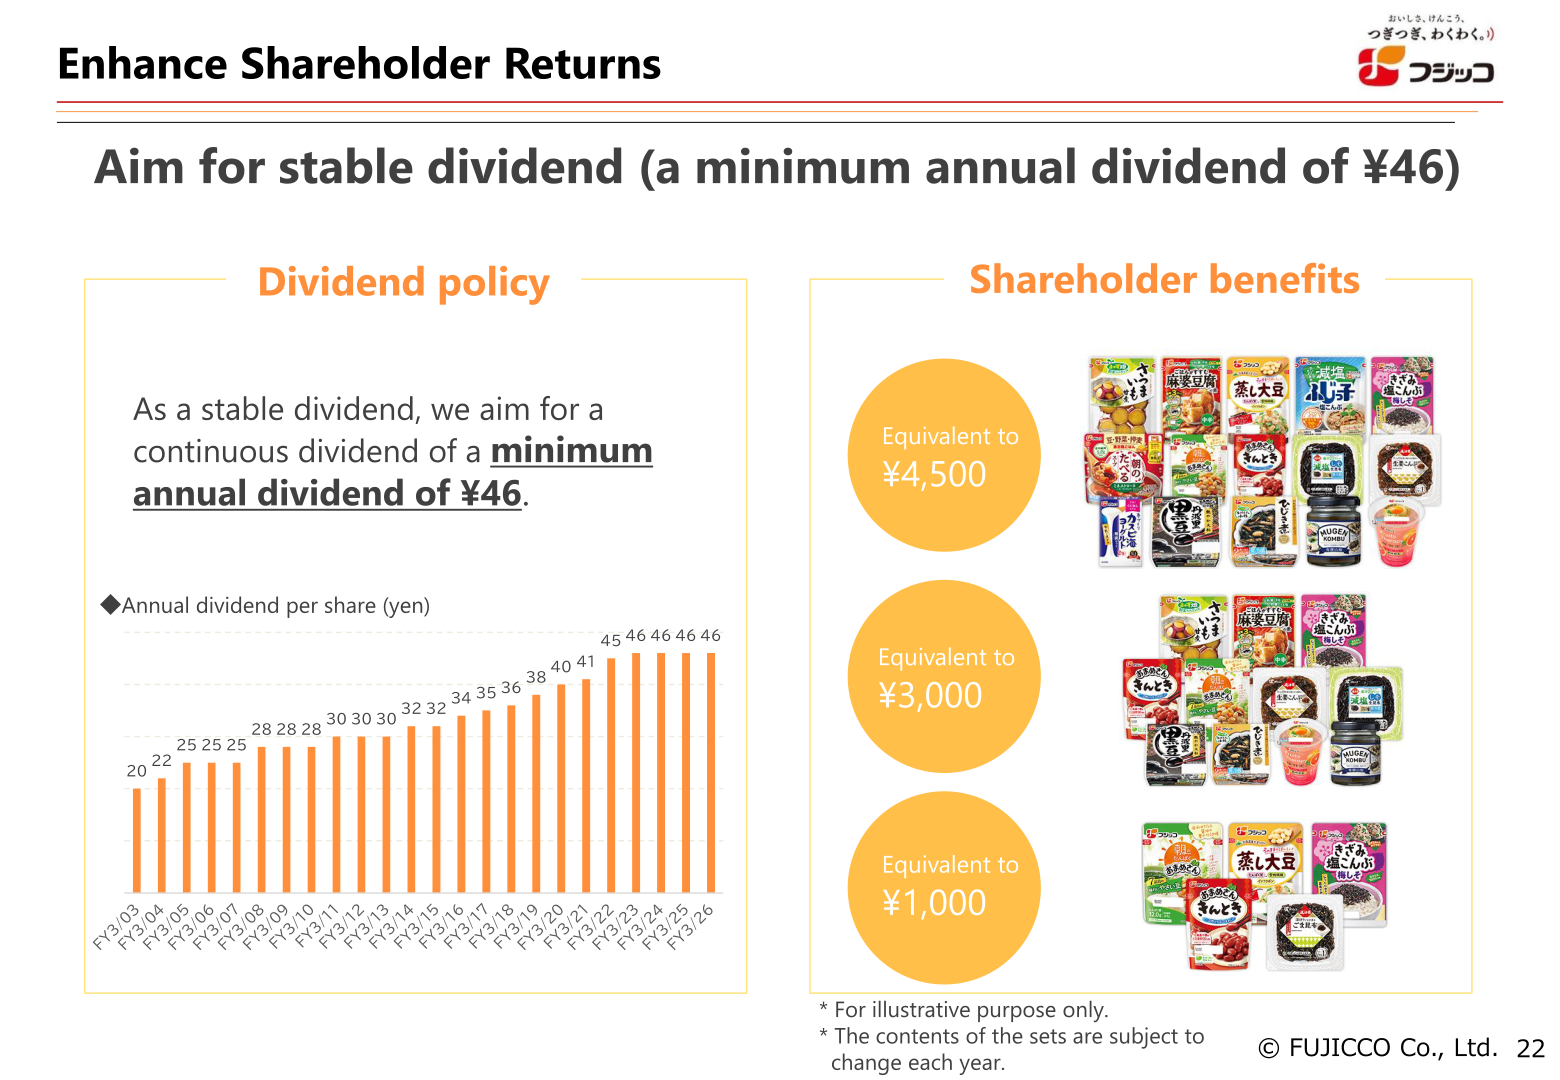
The dividend policy stated in the materials is that, as a stable dividend, the company aims for a continuous dividend of a minimum annual dividend of 46 yen. The annual dividend per share was 46 yen for FY3/2026 and the forecast for FY3/2027 is also 46 yen, including an interim dividend of 23 yen, unchanged year on year. The company also offers shareholder benefits, with sets described in the materials as equivalent to 1,000 yen, 3,000 yen and 4,500 yen. Under its capital allocation approach, the company seeks to maximize operating cash flow and, within that scope, perform growth investment and shareholder returns while further accumulating cash. The cash flow chart shows share buybacks of 1.6 billion yen and 1.3 billion yen in the periods indicated.
Medium-Term Management Plan and Topics
FY3/2026 was the first year of the 2025–2027 Medium-term Management Plan. The company says it improved management efficiency through structural transformation, promoting business restructuring, plant consolidation and cost reduction, and secured profit growth and a lower break-even point despite sluggish sales. It set the yogurt business as the third pillar and started forming a strategy to double sales, with the new product Caspian Sea Yogurt Richmo performing better than planned, and acquired a Thai frozen food firm for its overseas business. It also started operation of eight DX tools and established an environment where employees can utilize generative AI. The challenge identified was a decrease in sales volume as the number of customers fell: despite higher unit prices from the March price increase, sales volume dropped sharply and product value enhancement failed to keep pace with price increases.
Topics during the year included the decision in May to close the Hamasaka Plant (to be closed in March 2027), the transfer of Foods Palette Co., Ltd. in August, the acquisition of FB Food Service (2017) Co., Ltd., a Thailand-based delicatessen company, and the release of Caspian Sea Yogurt Richmo in September, and the absorption-type merger of FUJICCO NEW DELICA CO., LTD. in October. For FY3/2027 the company set three major policies — completely restore earning power, execute the growth strategy moving from defense to offense, and carry out strengthening of the business foundation and job satisfaction reform — supported by six priority items including accelerating growth with yogurt as the third pillar and shifting the overseas business to an autonomous growth phase. Job satisfaction indicators cited for FY3/2025 to FY3/2026 include employee engagement of 6.70 to 6.79, paid leave usage rate of 61.3% to 62.3%, ratio of female managers of 10.3% to 11.0% and ratio of male employees taking childcare leave of 53.3% to 86.4%, the latter two calculated on a non-consolidated basis.
This article is an analysis based on publicly available information and is not a recommendation to buy or sell any specific securities. Investment decisions are your own responsibility.
















