
This article is based on publicly available IR materials and is not a recommendation to buy or sell any specific securities.
Note: NISSIN FOODS HOLDINGS labels the fiscal year ended March 31, 2026 as “FY 3/2026” in its presentation materials; this site classifies the most recent completed fiscal year as FY2025. Figures and fiscal-year labels below follow the company’s materials.
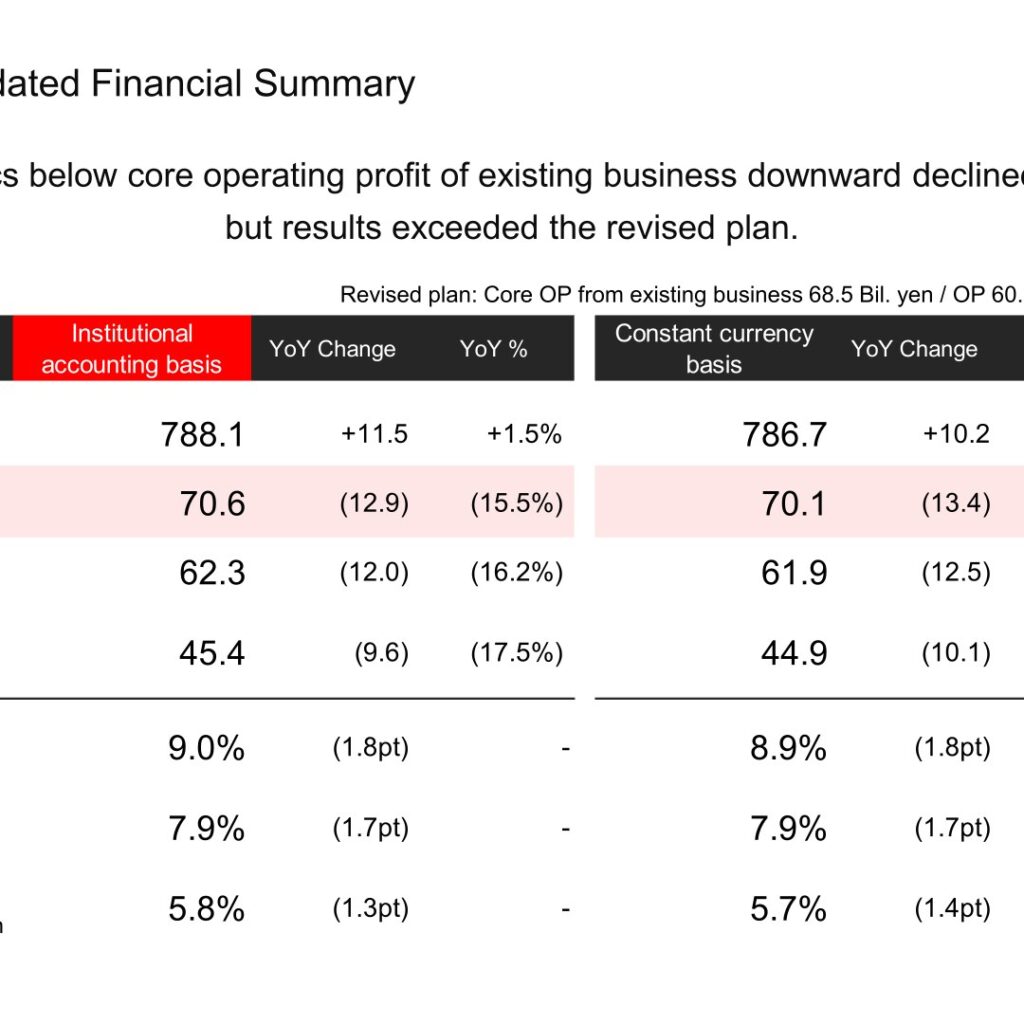
NISSIN FOODS HOLDINGS CO., LTD. (TSE Stock Code: 2897) presented its financial results for FY 3/2026 on May 13, 2026. Revenue was ¥788.1 Bil. (+1.5% YoY), while core operating profit of existing businesses declined 15.5% to ¥70.6 Bil., exceeding the revised forecast of ¥68.5 Bil. Domestically, profit at NISSIN FOOD PRODUCTS declined on higher raw material costs even as price revisions and anniversary initiatives drove volume share gains; overseas, the decline was mainly due to the revenue drop in the U.S. business since H2 FY 3/2025. For FY 3/2027, the company targets mid-single-digit profit growth, positioning FY 3/2026 as the bottom year.
Consolidated Results (Full-Year Actual)
All profit metrics from core operating profit of existing businesses downward declined year on year, but results exceeded the revised plan (core operating profit from existing businesses ¥68.5 Bil. / operating profit ¥60.5 Bil. / net profit ¥43.0 Bil.). On a constant currency basis, revenue rose 1.3% and core operating profit of existing businesses fell 16.1%.
| Item (Bil. yen) | FY 3/2026 | YoY Change | YoY % | Previous year |
|---|---|---|---|---|
| Revenue | 788.1 | +11.5 | +1.5% | 776.6 |
| Core operating profit of existing businesses | 70.6 | (12.9) | (15.5%) | 83.5 |
| Operating profit | 62.3 | (12.0) | (16.2%) | 74.4 |
| Profit attributable to owners of the parent | 45.4 | (9.6) | (17.5%) | 55.0 |
| Core OP margin of existing businesses | 9.0% | (1.8pt) | – | 10.8% |
| OP margin | 7.9% | (1.7pt) | – | 9.6% |
| Profit attributable to owners of the parent margin | 5.8% | (1.3pt) | – | 7.1% |
Segment Results
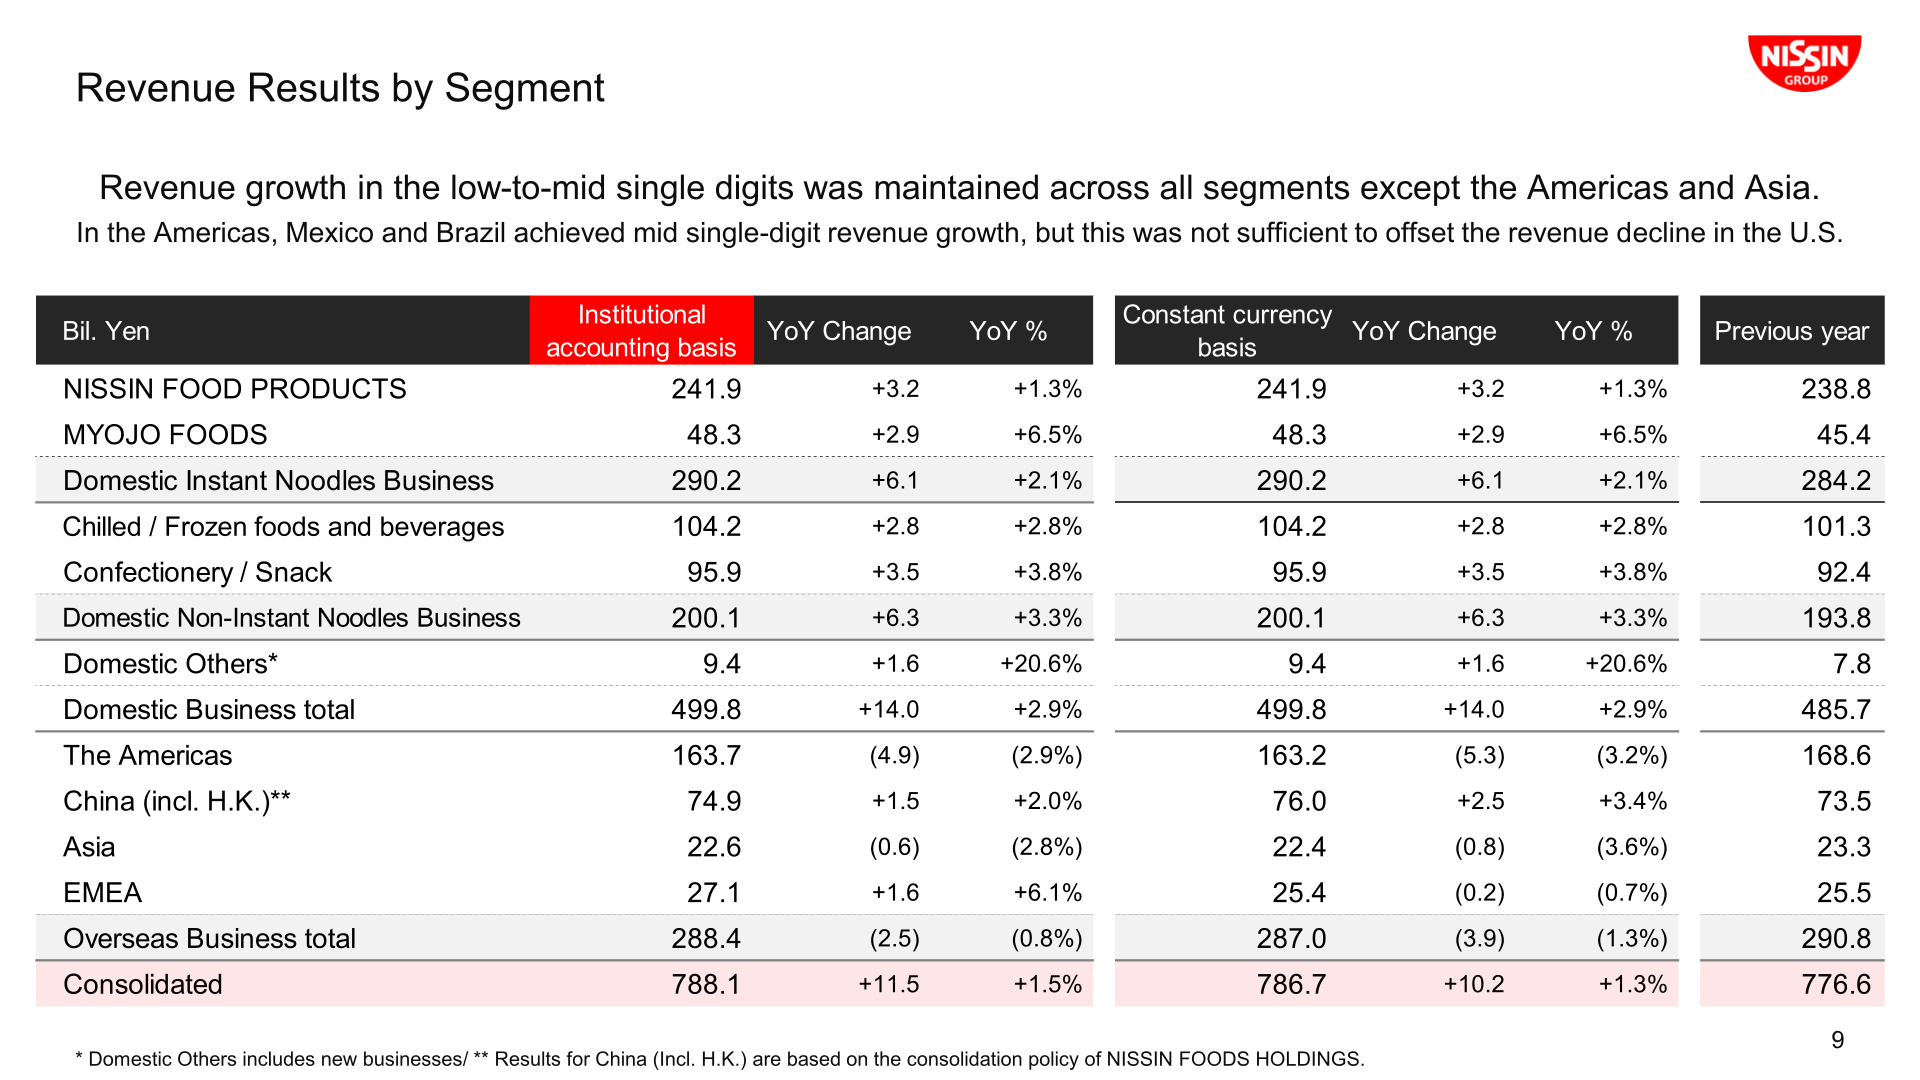
Revenue growth in the low-to-mid single digits was maintained across all segments except the Americas and Asia. On profit, all businesses and regions posted declines except MYOJO FOODS, China (incl. H.K.) and EMEA, with the Americas accounting for 40% of the total profit decrease. In the Overseas Business, about 80% of the approximately 6 bil. yen profit decline was due to decreased revenue in the U.S. business since the second half of the previous fiscal year; profit also declined at equity-method affiliates.
| Segment | Revenue (Bil. yen) | YoY % | Core OP (Bil. yen) | YoY % |
|---|---|---|---|---|
| NISSIN FOOD PRODUCTS | 241.9 | +1.3% | 32.6 | (3.9%) |
| MYOJO FOODS | 48.3 | +6.5% | 3.4 | +9.6% |
| Domestic Instant Noodles Business | 290.2 | +2.1% | 36.0 | (2.8%) |
| Chilled / Frozen foods and beverages | 104.2 | +2.8% | 7.8 | (9.6%) |
| Confectionery / Snack | 95.9 | +3.8% | 5.7 | (1.2%) |
| Domestic Non-Instant Noodles Business | 200.1 | +3.3% | 13.5 | (6.2%) |
| The Americas | 163.7 | (2.9%) | 10.5 | (34.6%) |
| China (incl. H.K.) | 74.9 | +2.0% | 9.0 | +7.5% |
| Asia | 22.6 | (2.8%) | 7.0 | (12.6%) |
| EMEA | 27.1 | +6.1% | 8.9 | +1.4% |
| Overseas Business total | 288.4 | (0.8%) | 35.3 | (14.1%) |
FY 3/2027 Forecast
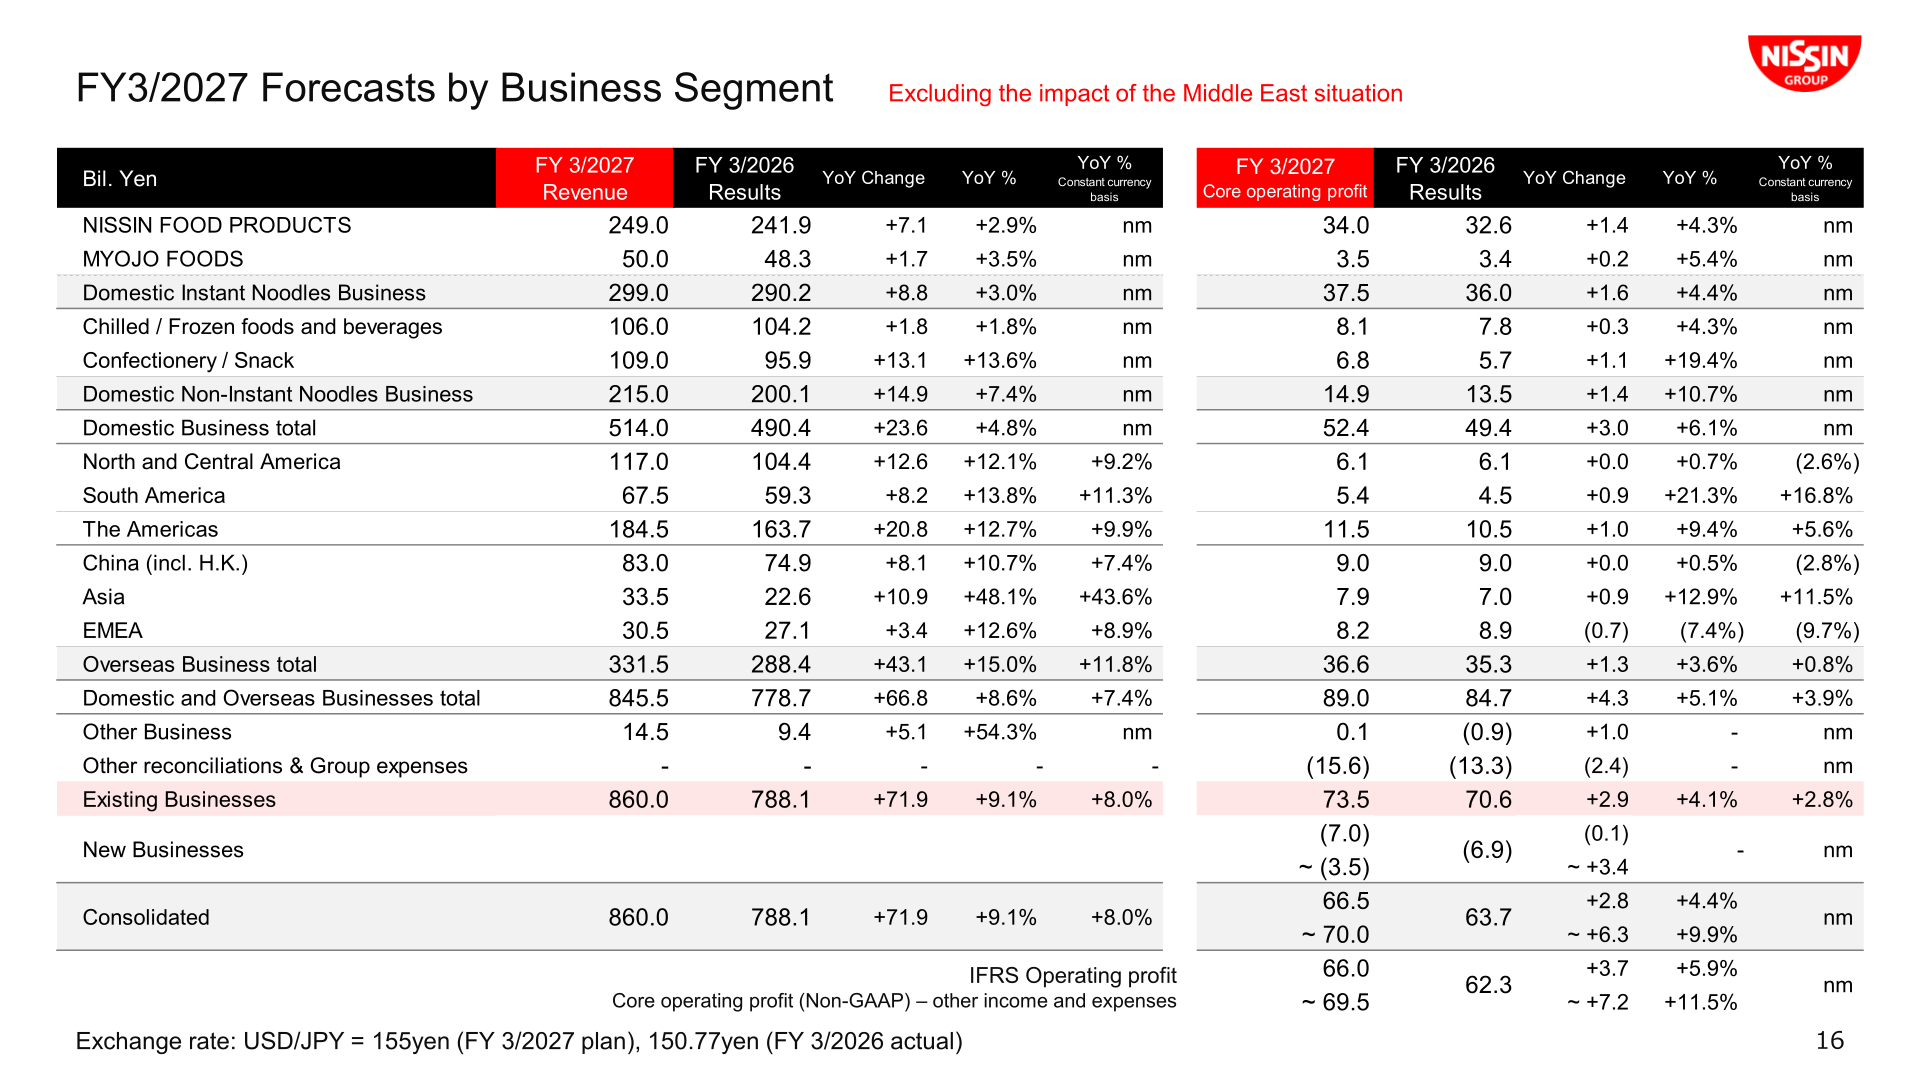
For FY 3/2027, the company forecasts revenue of ¥860.0 Bil. (+9.1%) and core operating profit of existing businesses of ¥73.5 Bil. (+4.1%, equivalent to a high single-digit increase before depreciation), rebounding from FY 3/2026 as the bottom year. The forecast assumes USD/JPY of 155 yen (versus 150.77 yen actual in FY 3/2026) and reflects approx. ¥3 bn of cost savings. The impact of the Middle East situation is not included in the forecast; as reference information, Q1 supply chain-related cost increases are estimated at approximately JPY 2.5 billion for the Group as a whole (assumptions: crude oil USD 100/bbl; USD/JPY 158).
| Item | FY 3/2027 Forecast | Change vs. FY 3/2026 Results (%) |
|---|---|---|
| Revenue | 860.0 Bil. yen | +9.1% |
| Core operating profit of existing businesses | 73.5 Bil. yen | +4.1% |
| Operating profit | 66.0 ~ 69.5 Bil. yen | +5.9% ~ +11.5% |
| Profit attributable to owners of the parent | 45.5 ~ 48.0 Bil. yen | +0.3% ~ +5.8% |
| EPS | 159 ~ 167 yen per share | – |
By segment (excluding the impact of the Middle East situation), the Domestic Business total is planned at revenue of ¥514.0 Bil. (+4.8%) and core operating profit of ¥52.4 Bil. (+6.1%), and the Overseas Business total at revenue of ¥331.5 Bil. (+15.0%) and core operating profit of ¥36.6 Bil. (+3.6%). From FY 3/2027, the Americas disclosure is split into North & Central America and South America, and “Domestic Others” is renamed “Other Businesses.”
| Segment | Revenue Forecast (Bil. yen) | YoY % | Core OP Forecast (Bil. yen) | YoY % |
|---|---|---|---|---|
| Domestic Business total | 514.0 | +4.8% | 52.4 | +6.1% |
| North and Central America | 117.0 | +12.1% | 6.1 | +0.7% |
| South America | 67.5 | +13.8% | 5.4 | +21.3% |
| The Americas | 184.5 | +12.7% | 11.5 | +9.4% |
| China (incl. H.K.) | 83.0 | +10.7% | 9.0 | +0.5% |
| Asia | 33.5 | +48.1% | 7.9 | +12.9% |
| EMEA | 30.5 | +12.6% | 8.2 | (7.4%) |
| Overseas Business total | 331.5 | +15.0% | 36.6 | +3.6% |
Shareholder Returns
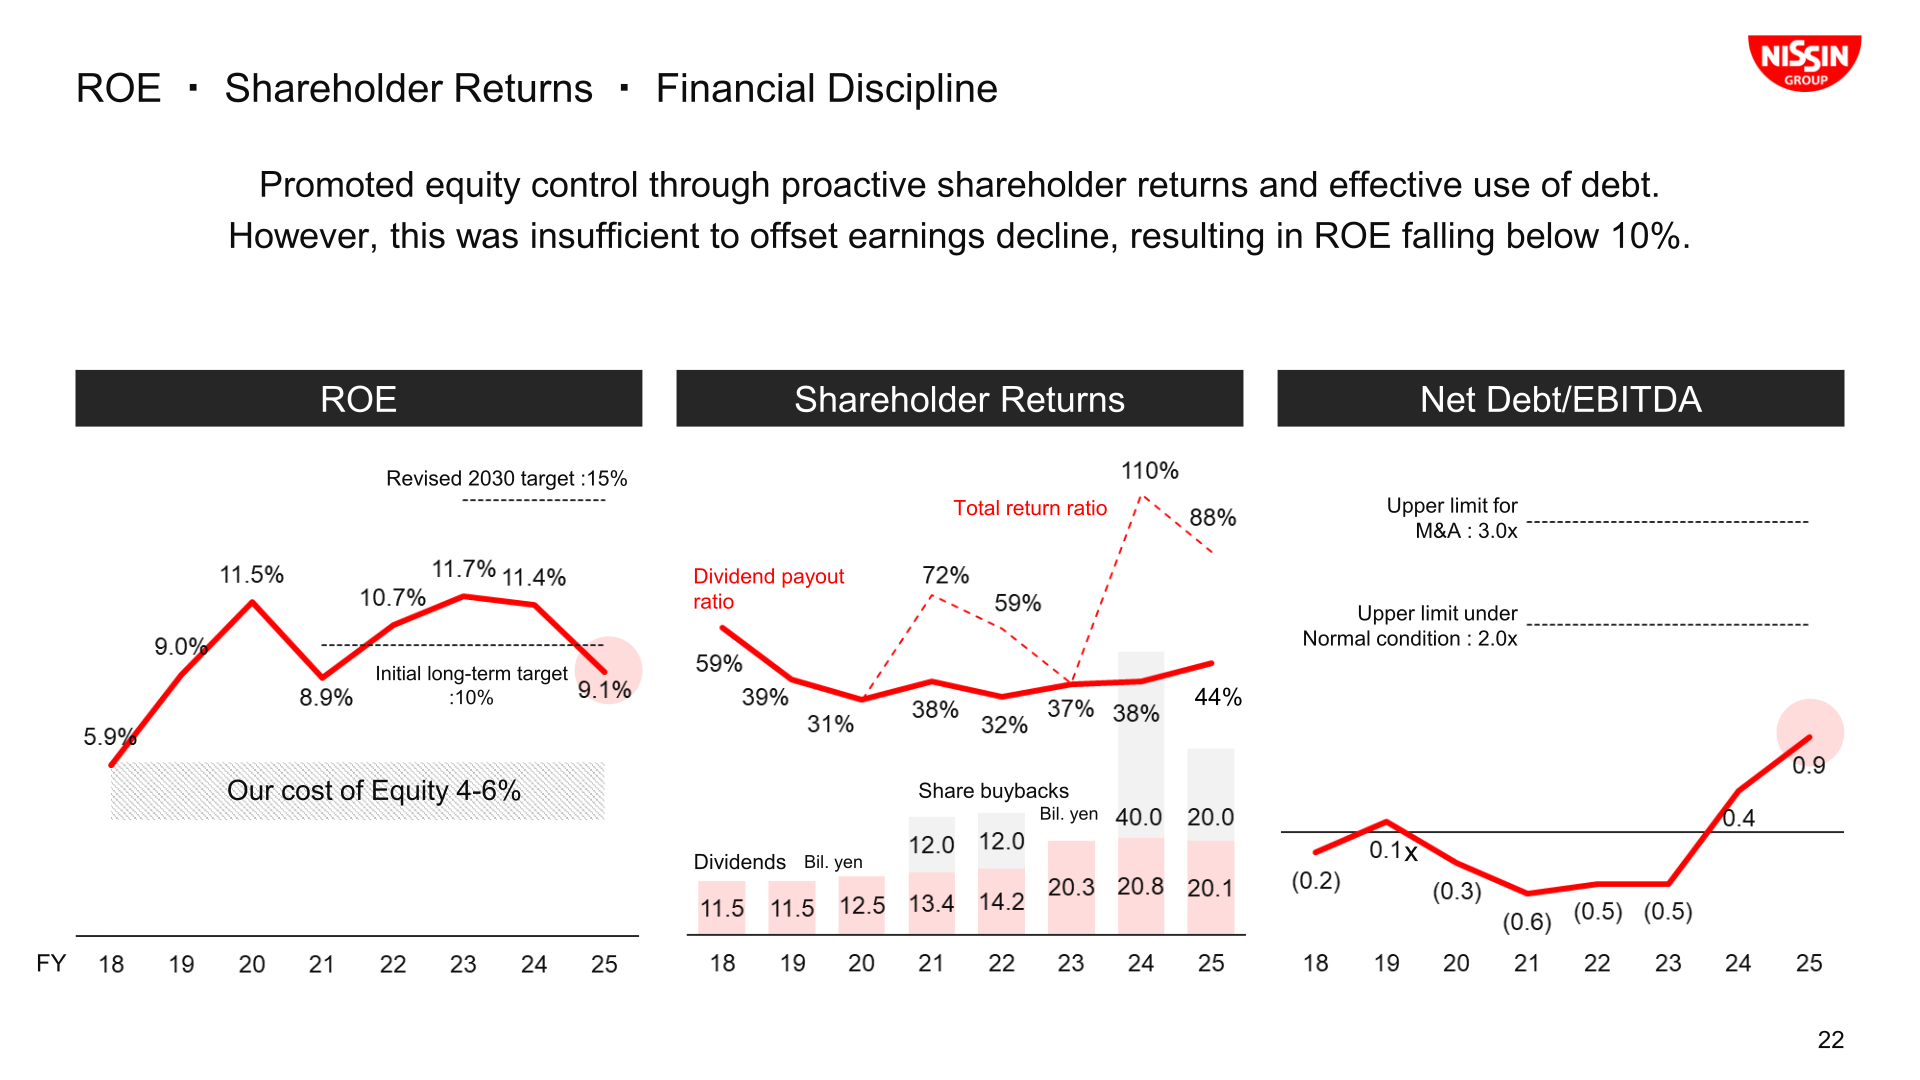
Under the progressive dividend policy, despite the profit decline, the annual dividend was maintained at ¥70 per share, unchanged from FY 3/2025, corresponding to a dividend payout ratio of approximately 44%. Together with the ¥20.0 Bil. share repurchase already executed, the total payout ratio reached 88.4%. The company promoted equity control through proactive shareholder returns and effective use of debt; however, this was insufficient to offset the earnings decline, and ROE fell below 10%. Financial discipline is set at Net Debt/EBITDA with an upper limit of 2.0x under normal conditions and 3.0x for M&A.
Medium-Term Plan / Topics
In light of the recent decline in returns and heightened uncertainty, the company is returning to the fundamentals of the “Medium- to Long-Term Growth Strategy 2030” originally announced in May 2021. Financial KPIs were partially revised: the ROE target was reset to a long-term target of 15%, with 10% by 2030, and the next milestone is to achieve mid-single-digit growth in core operating profit of existing businesses (constant currency, organic). Other KPIs include progressive dividends, relative TSR above 1x versus TOPIX Foods, and Net Debt/EBITDA of 2x or less (flexibly considering up to 3x for M&A).
As a new initiative, the company announced a full-scale entry into Japanese-style ramen under the concept “BOLD TASTES of TOKYO,” rolling out to the U.S. from July 2026, Brazil from October 2026, and three European countries from February 2027. In new businesses, KANZEN MESHI reached sales of 10 billion yen in FY 3/2026 (based on market prices) with a brand recognition rate of 52%, and the domestic new business is planned to turn profitable in FY 3/2029. In the capital allocation plan for FY 3/2027–FY 3/2031, operating cash flow of approx. 450~500 Bil. yen is allocated to CAPEX (current estimate approx. 400 Bil. yen) and progressive dividends of approx. 100 Bil. yen plus share buybacks, while capital expenditures are comprehensively reassessed with a focus on scale and timing.
This article is an analysis based on publicly available information and is not a recommendation to buy or sell any specific securities. Investment decisions are your own responsibility.
![[Obayashi] Investors’ Guide 2026 — The Complete 24-Article Breakdown](https://japan-equity.com/wp-content/uploads/2026/07/hub_cover-1024x1024.png)
![[Obayashi] IR & SR Policy — Feeding Dialogue Back into Management](https://japan-equity.com/wp-content/uploads/2026/07/p32_sq-1024x1024.jpg)
![[Obayashi] Real Estate Development — 18.7% Margin, ¥287.7bn Unrealized Gains](https://japan-equity.com/wp-content/uploads/2026/07/p20_sq-1024x1024.jpg)
![[Obayashi] Domestic Civil Engineering — Resilience Spending Supports 9.6% Margin](https://japan-equity.com/wp-content/uploads/2026/07/p11_sq-1024x1024.jpg)
![[Obayashi] Share Price & External Ratings — vs TOPIX, ESG Index Inclusion](https://japan-equity.com/wp-content/uploads/2026/07/p40_sq-1024x1024.jpg)
![[Construction] ¥75.5tn Investment, Shrinking Workforce — Big-5 Market Share](https://japan-equity.com/wp-content/uploads/2026/07/p12_sq-1024x1024.jpg)



![[Obayashi] Capital Policy & Shareholder Returns — ROE 10%+, DOE ~5%, ¥100bn Buyback](https://japan-equity.com/wp-content/uploads/2026/07/p27_sq-1024x1024.jpg)
![[Obayashi] Reducing Cross-Shareholdings — ¥285.2bn Sold in Five Years](https://japan-equity.com/wp-content/uploads/2026/07/p29_sq-1024x1024.jpg)
![[Obayashi] ¥750bn Investment Plan — ¥300bn to Development, ¥190bn to Tech/DX](https://japan-equity.com/wp-content/uploads/2026/07/p30_sq-1024x1024.jpg)
![[Obayashi] MTP2022 KPIs — Operating Profit ~2x Target, ROE 14.4%](https://japan-equity.com/wp-content/uploads/2026/07/p25_sq-1024x1024.jpg)
![[Obayashi] Cash Allocation — ¥420bn Investment CF Over Five Years](https://japan-equity.com/wp-content/uploads/2026/07/p26_sq-1024x1024.jpg)
![[Obayashi] Green Energy — 44 Plants, 344MW, and the Green Hydrogen Challenge](https://japan-equity.com/wp-content/uploads/2026/07/p21_sq-1024x1024.jpg)
![[Obayashi] Tackling the Labor Shortage — Robotics Construction®](https://japan-equity.com/wp-content/uploads/2026/07/p14_sq-1024x1024.jpg)
