
This article is based on publicly available IR materials and is not a recommendation to buy or sell any specific securities.
Toyo Suisan Kaisha, Ltd. (TSE Prime, securities code 2875), the food company behind the Maruchan brand, released its Financial Presentation Materials for the Fiscal Year Ended March 31, 2026 on May 15, 2026. In the company’s presentation, FY2025 refers to the fiscal year ended March 31, 2026, and FY2026 to the fiscal year ending March 31, 2027. FY2025 net sales were ¥536.6 billion (104.8% of the prior year) and operating profit was ¥85.8 billion (112.1%), with the company reporting record-high net sales achieved across all segments and record-high operating profit as higher sales absorbed ongoing cost increases in Japan and overseas.
Consolidated Results (Full-Year Actual)
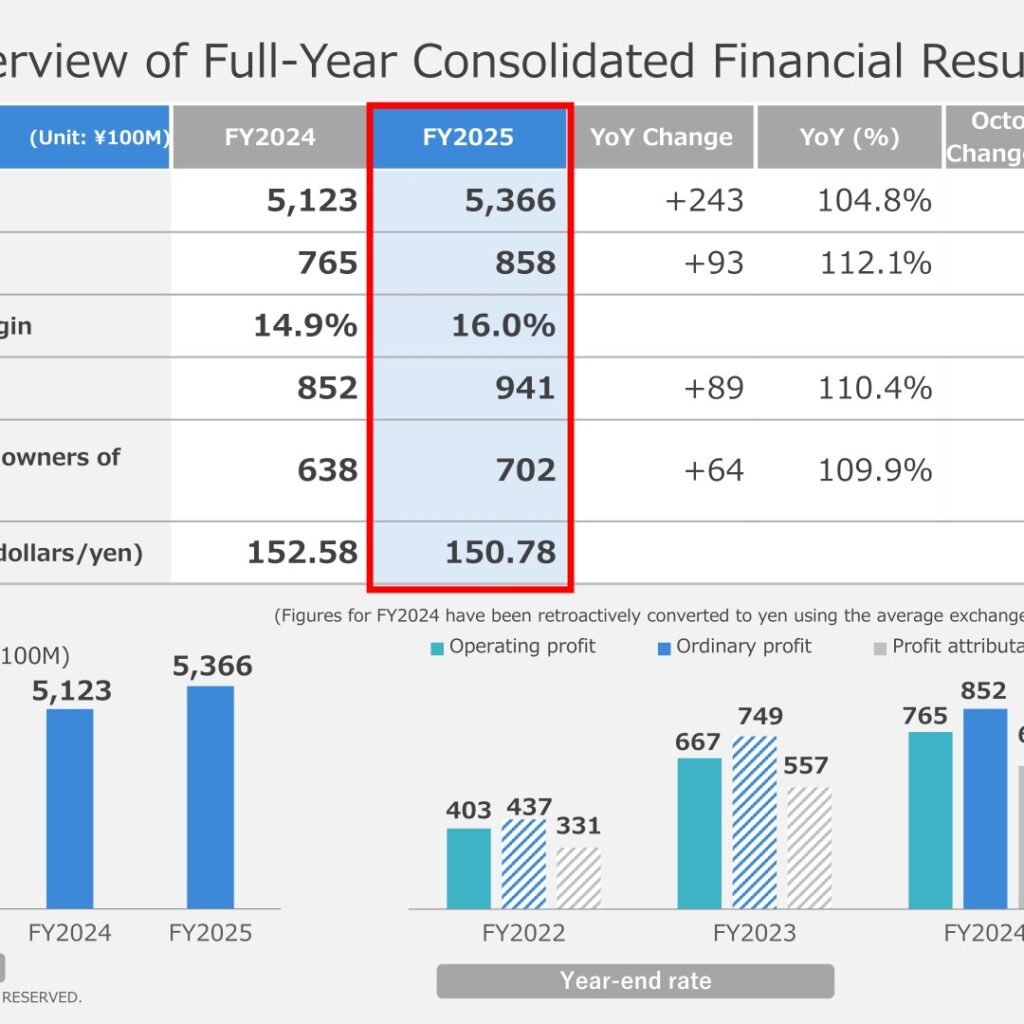
Net sales reached ¥536.6 billion (104.8% year on year), driven by higher volumes, price revisions, and other factors. Operating profit increased to ¥85.8 billion (112.1%), lifting the operating profit margin from 14.9% to 16.0%. Ordinary profit was ¥94,050 million (110.4%) and profit attributable to owners of parent was ¥70.2 billion (109.9%). The average exchange rate was ¥150.78 to the U.S. dollar versus ¥152.58 in FY2024, and the company notes that FY2024 figures have been retroactively converted to yen using the average exchange rate during the year.
| Item (Unit: ¥100M) | FY2025 | FY2024 | YoY Change | YoY (%) |
|---|---|---|---|---|
| Net sales | 5,366 | 5,123 | +243 | 104.8% |
| Operating profit | 858 | 765 | +93 | 112.1% |
| Operating profit margin | 16.0% | 14.9% | – | – |
| Ordinary profit | 941 | 852 | +89 | 110.4% |
| Profit attributable to owners of parent | 702 | 638 | +64 | 109.9% |
| Exchange rate (U.S. dollars/yen) | 150.78 | 152.58 | – | – |
Segment Results
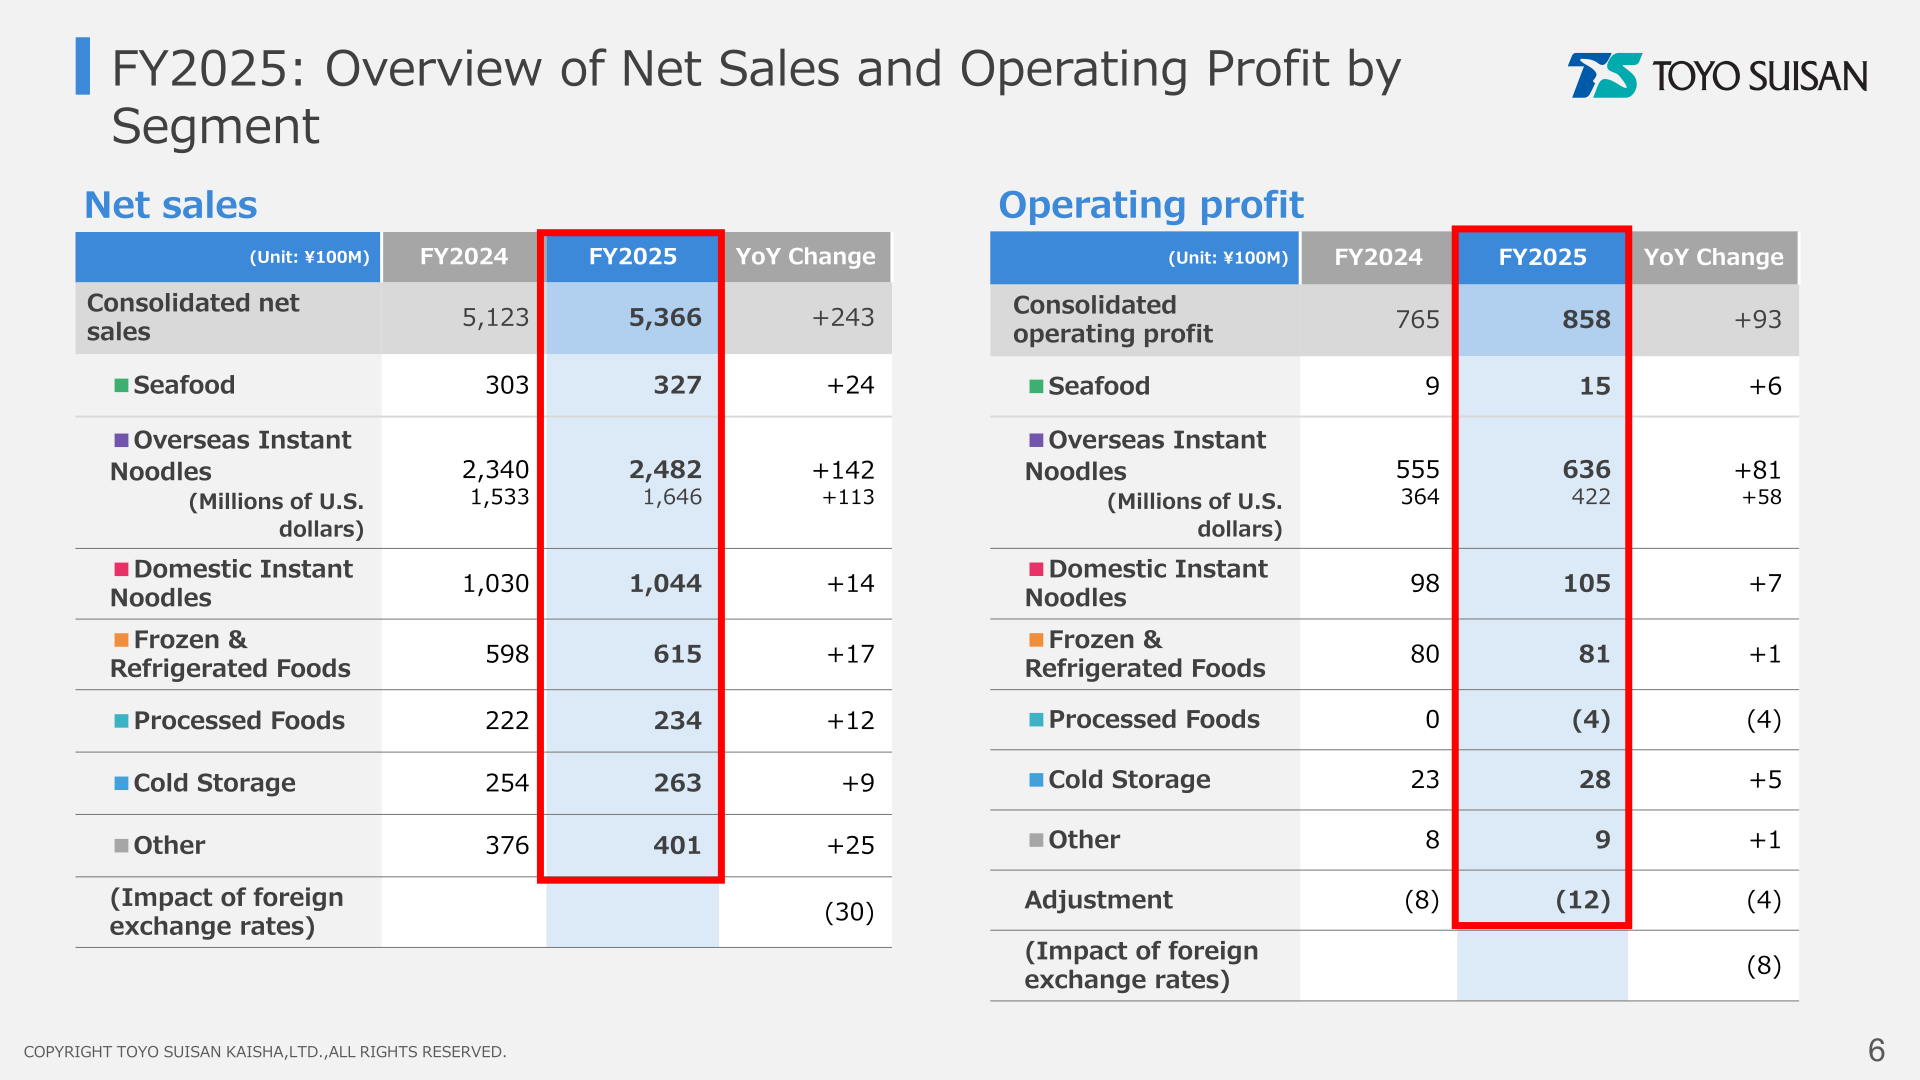
All segments posted higher net sales. The Overseas Instant Noodles segment was the largest contributor, with net sales of 2,482 (¥100M), up 142 year on year, and operating profit of 636 (¥100M), up 81; in U.S. dollar terms, segment net sales were 1,646 million U.S. dollars (up 113) and operating profit was 422 million U.S. dollars (up 58). Domestic Instant Noodles increased both sales and profit on higher sales volumes of flagship brand products, and Frozen & Refrigerated Foods secured sales and profits by strengthening promotions centered on flagship yakisoba products. Processed Foods posted an operating loss of (4) (¥100M).
| Segment | Net sales FY2025 (¥100M) | Net sales FY2024 (¥100M) | Operating profit FY2025 (¥100M) | Operating profit FY2024 (¥100M) |
|---|---|---|---|---|
| Consolidated total | 5,366 | 5,123 | 858 | 765 |
| Seafood | 327 | 303 | 15 | 9 |
| Overseas Instant Noodles | 2,482 | 2,340 | 636 | 555 |
| (Millions of U.S. dollars) | 1,646 | 1,533 | 422 | 364 |
| Domestic Instant Noodles | 1,044 | 1,030 | 105 | 98 |
| Frozen & Refrigerated Foods | 615 | 598 | 81 | 80 |
| Processed Foods | 234 | 222 | (4) | 0 |
| Cold Storage | 263 | 254 | 28 | 23 |
| Other | 401 | 376 | 9 | 8 |
| Adjustment | – | – | (12) | (8) |
FY2026 Forecast
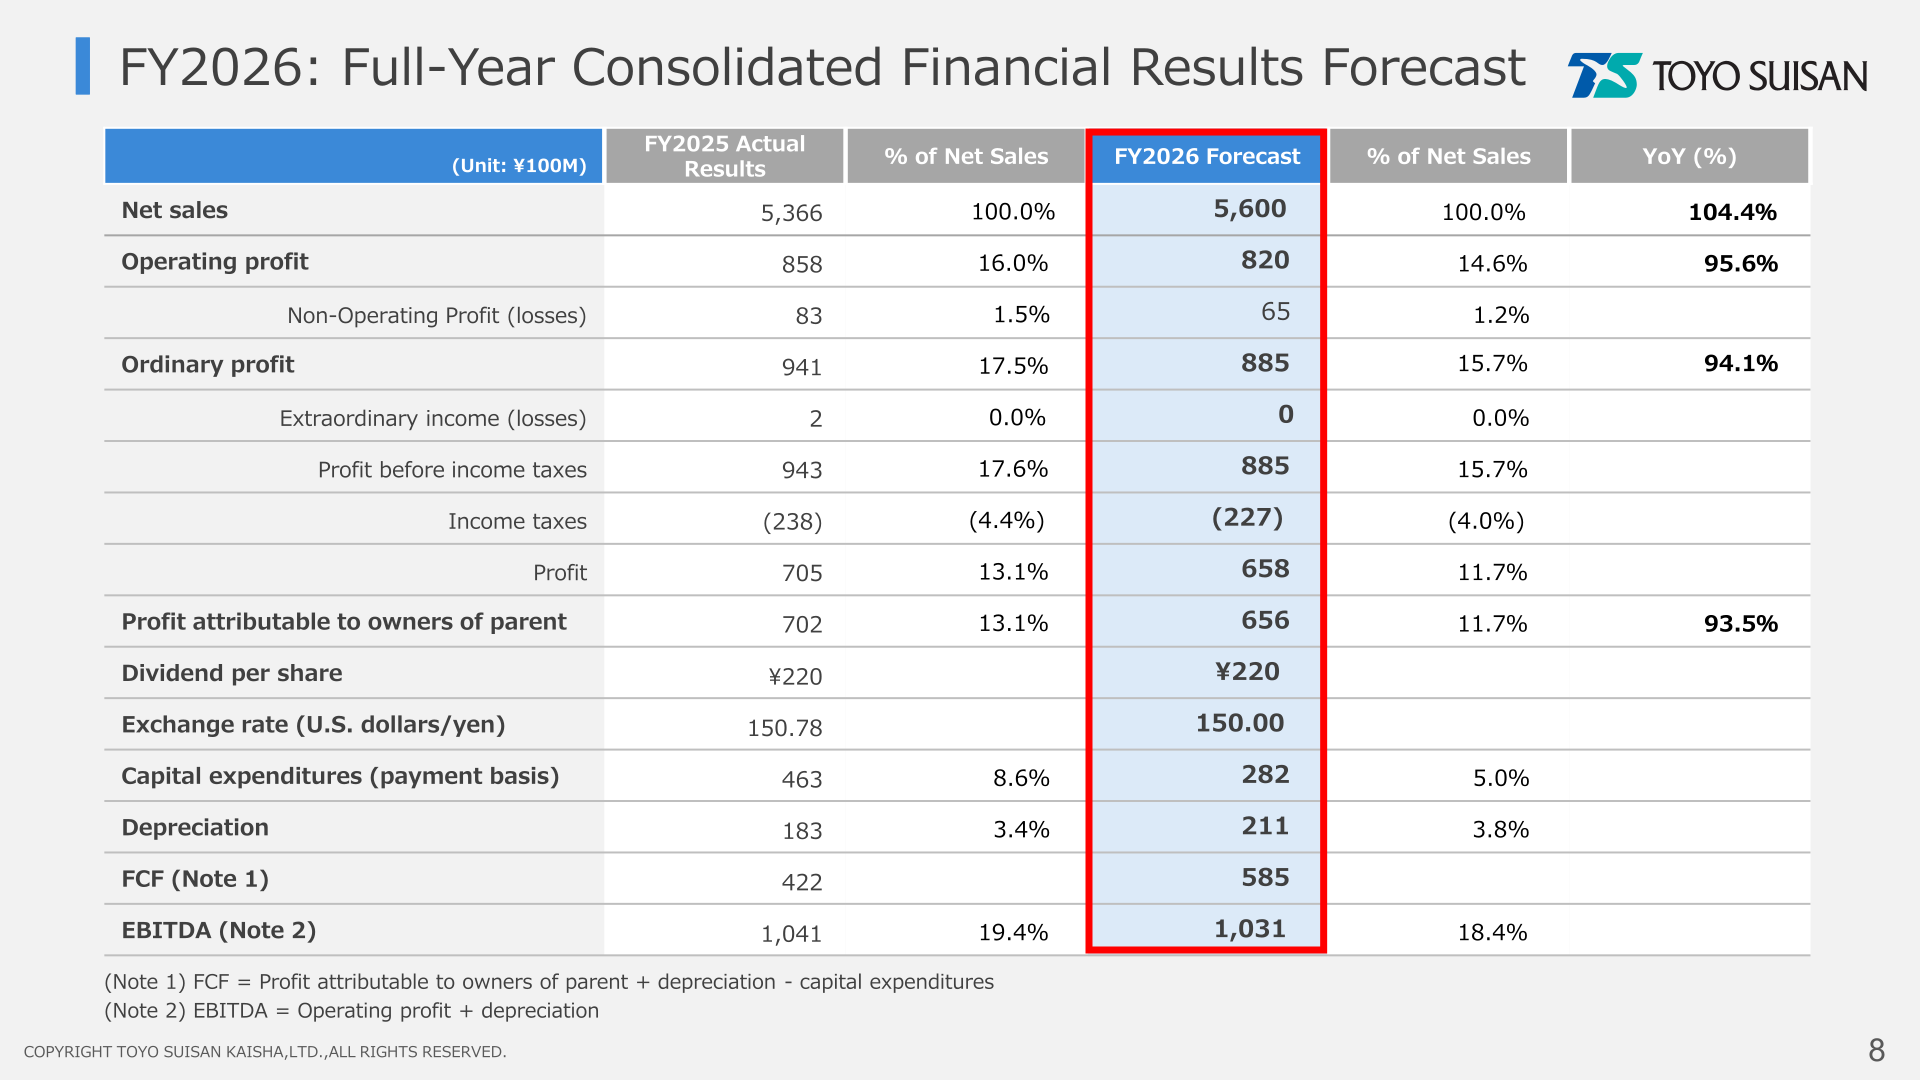
For FY2026 (the fiscal year ending March 31, 2027), the company forecasts net sales of ¥560 billion (104.4%) with sales expected to increase across all segments due to a recovery in sales in the overseas instant noodle segment and the effect of price revisions in Japan and overseas. Operating profit is forecast at ¥82 billion (95.6%), a decrease attributed to soaring raw material prices in domestic and overseas operations and higher depreciation expenses associated with the startup of the new plant. The assumed exchange rate is ¥150.00 to the U.S. dollar.
| Item (Unit: ¥100M) | FY2026 Forecast | FY2025 (Actual) | YoY (%) |
|---|---|---|---|
| Net sales | 5,600 | 5,366 | 104.4% |
| Operating profit | 820 | 858 | 95.6% |
| Ordinary profit | 885 | 941 | 94.1% |
| Profit attributable to owners of parent | 656 | 702 | 93.5% |
| Dividend per share | ¥220 | ¥220 | – |
| EBITDA | 1,031 | 1,041 | – |
| Capital expenditures (payment basis) | 282 | 463 | – |
| Depreciation | 211 | 183 | – |
The company separately flags the situation in the Middle East since February 2026: it estimates the impact of cost increases for packaging materials, utilities, logistics, and other items in FY2026 at approximately ¥8–10 billion, assuming such costs continue throughout the fiscal year. This impact is not reflected in the full-year forecast at this time; the impact on 1Q has been limited so far, with full-scale cost increases expected from 2Q onward.
Shareholder Returns
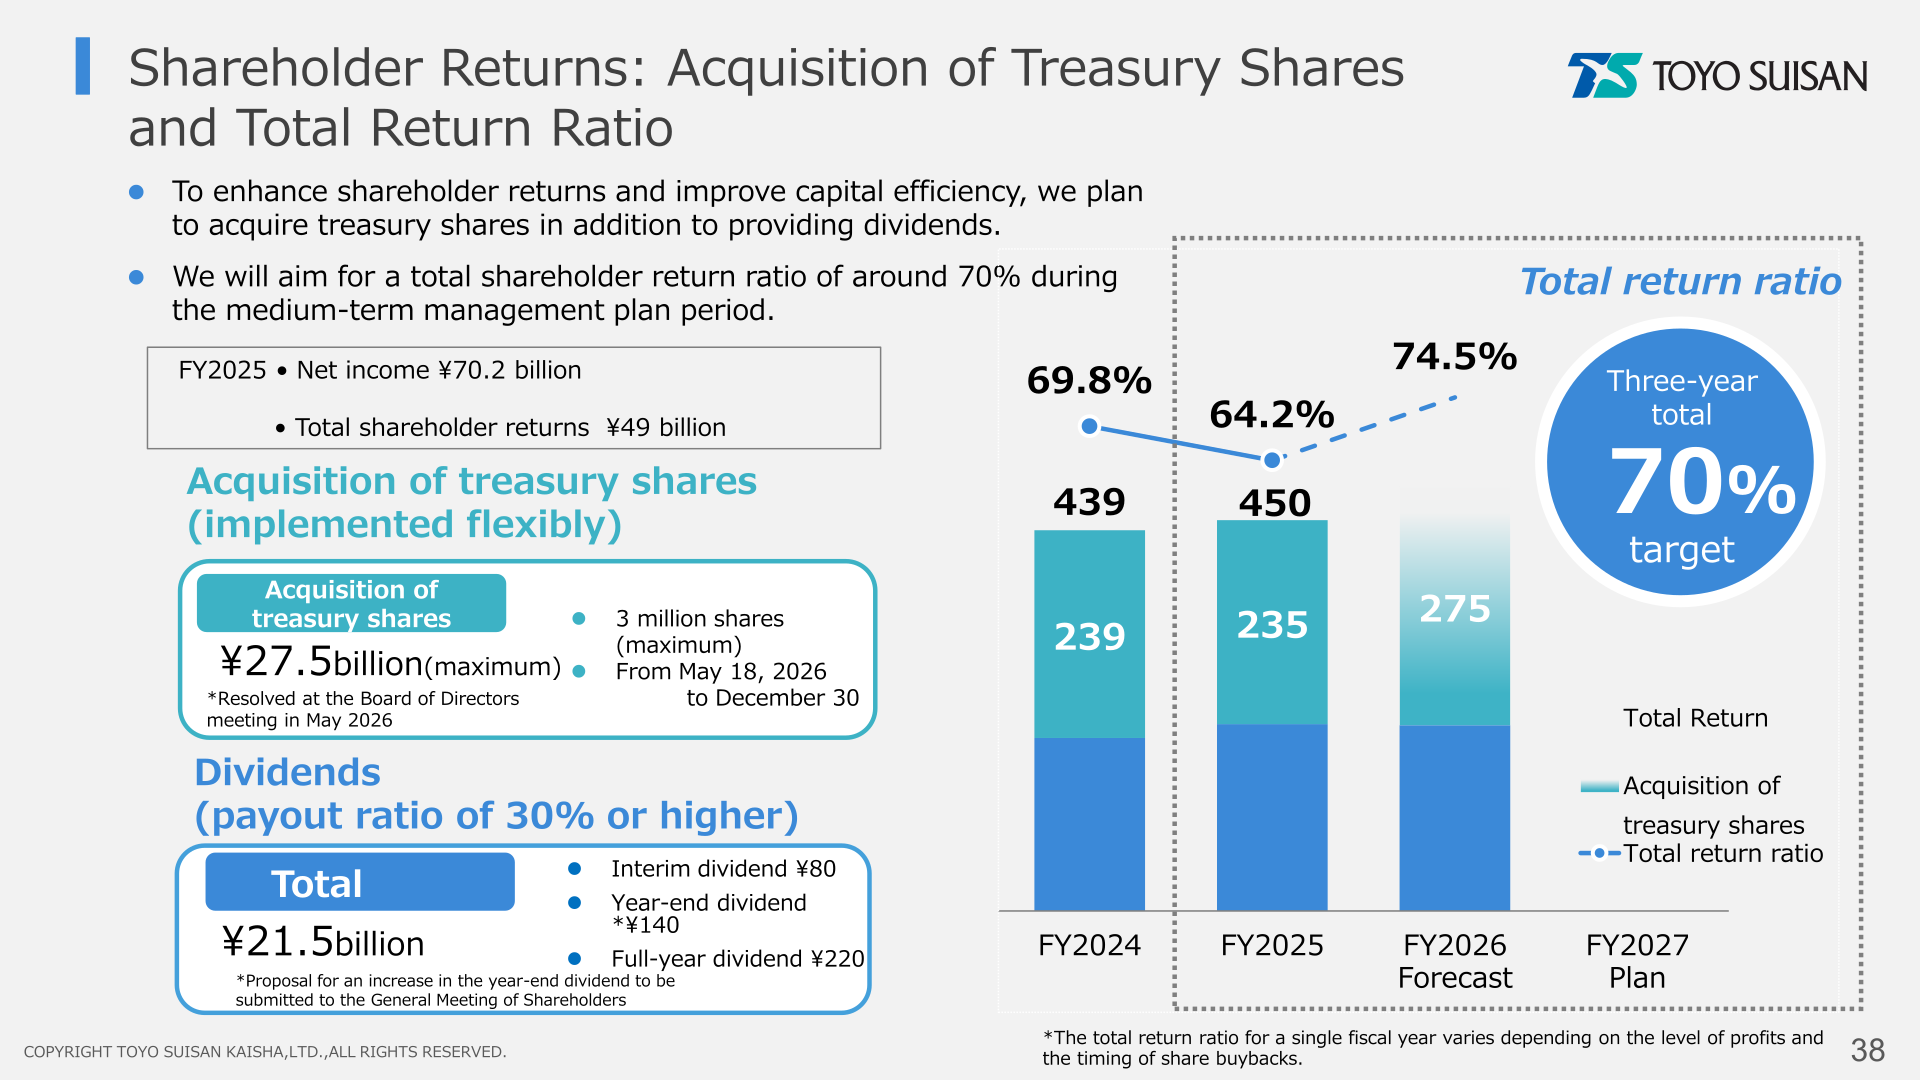
The FY2025 full-year dividend is ¥220 per share, consisting of an interim dividend of ¥80 and a year-end dividend of ¥140, with a proposal for an increase in the year-end dividend to be submitted to the General Meeting of Shareholders. The dividend policy is based on a dividend payout ratio of 30% or higher. In addition, the Board of Directors resolved in May 2026 to acquire treasury shares of up to ¥27.5 billion (up to 3 million shares) from May 18, 2026 to December 30. For FY2025, net income was ¥70.2 billion and total shareholder returns were ¥49 billion. The company aims for a total shareholder return ratio of around 70% during the medium-term management plan period. The FY2026 dividend forecast is ¥220 per share.
Medium-Term Plan / Topics
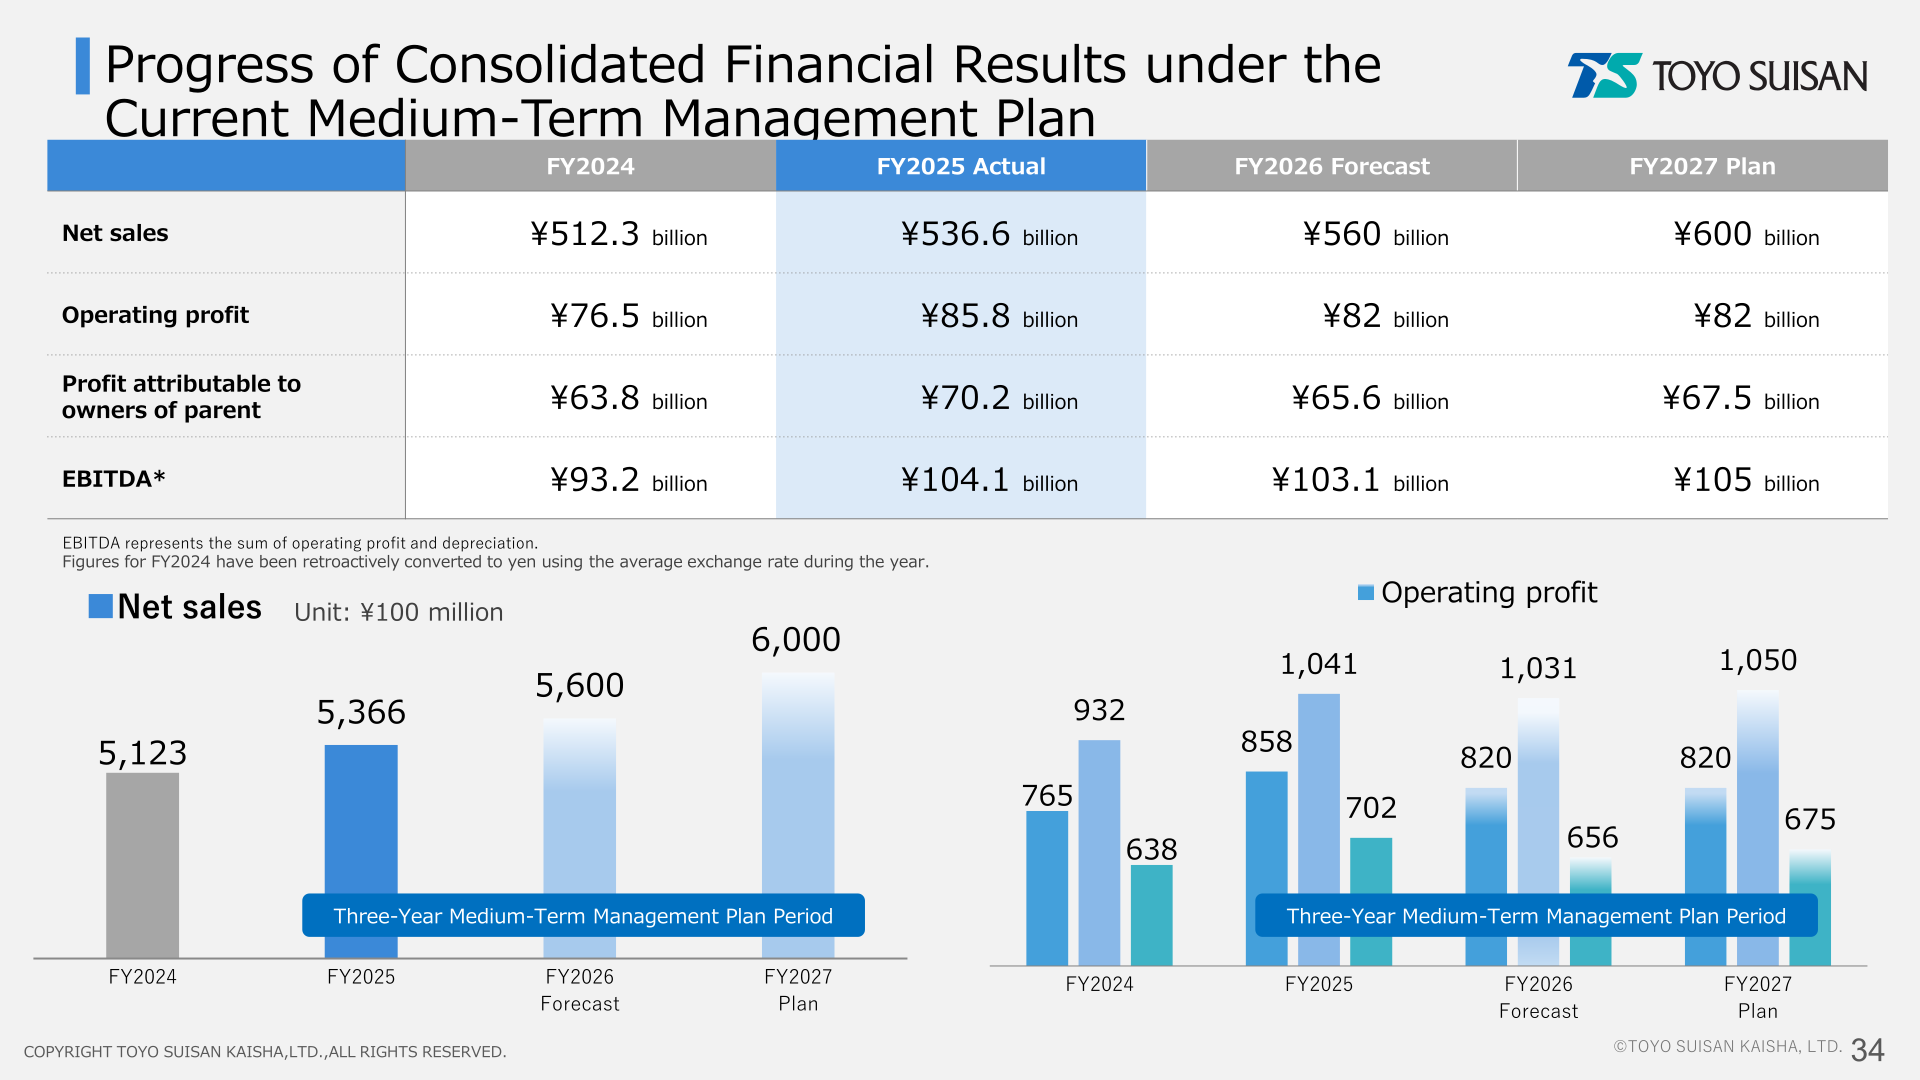
FY2025 was the first year of the three-year medium-term management plan covering FY2025–FY2027. The plan calls for net sales of ¥600 billion, operating profit of ¥82 billion, profit attributable to owners of parent of ¥67.5 billion, and EBITDA of ¥105 billion in FY2027. ROE was 13.9% in FY2025 against an FY2027 target of 10% or more, with a long-term target of approximately 15%. Major capital investments include the California plant expansion (phase II and III), a freeze-dried food plant expansion (phase II), and building a new plant in Mexico. In the overseas business, the company aims for bag-type noodles to reach 20% of sales mix in Mexico by FY2030 and centers its medium- to long-term overseas profitability on a 20% operating profit margin.
| Item | FY2024 | FY2025 Actual | FY2026 Forecast | FY2027 Plan |
|---|---|---|---|---|
| Net sales | ¥512.3 billion | ¥536.6 billion | ¥560 billion | ¥600 billion |
| Operating profit | ¥76.5 billion | ¥85.8 billion | ¥82 billion | ¥82 billion |
| Profit attributable to owners of parent | ¥63.8 billion | ¥70.2 billion | ¥65.6 billion | ¥67.5 billion |
| EBITDA | ¥93.2 billion | ¥104.1 billion | ¥103.1 billion | ¥105 billion |
This article is an analysis based on publicly available information and is not a recommendation to buy or sell any specific securities. Investment decisions are your own responsibility.
![[Obayashi] Investors’ Guide 2026 — The Complete 24-Article Breakdown](https://japan-equity.com/wp-content/uploads/2026/07/hub_cover-1024x1024.png)
![[Obayashi] IR & SR Policy — Feeding Dialogue Back into Management](https://japan-equity.com/wp-content/uploads/2026/07/p32_sq-1024x1024.jpg)
![[Obayashi] Real Estate Development — 18.7% Margin, ¥287.7bn Unrealized Gains](https://japan-equity.com/wp-content/uploads/2026/07/p20_sq-1024x1024.jpg)
![[Obayashi] Domestic Civil Engineering — Resilience Spending Supports 9.6% Margin](https://japan-equity.com/wp-content/uploads/2026/07/p11_sq-1024x1024.jpg)
![[Obayashi] Share Price & External Ratings — vs TOPIX, ESG Index Inclusion](https://japan-equity.com/wp-content/uploads/2026/07/p40_sq-1024x1024.jpg)
![[Construction] ¥75.5tn Investment, Shrinking Workforce — Big-5 Market Share](https://japan-equity.com/wp-content/uploads/2026/07/p12_sq-1024x1024.jpg)



![[Obayashi] Capital Policy & Shareholder Returns — ROE 10%+, DOE ~5%, ¥100bn Buyback](https://japan-equity.com/wp-content/uploads/2026/07/p27_sq-1024x1024.jpg)
![[Obayashi] Reducing Cross-Shareholdings — ¥285.2bn Sold in Five Years](https://japan-equity.com/wp-content/uploads/2026/07/p29_sq-1024x1024.jpg)
![[Obayashi] ¥750bn Investment Plan — ¥300bn to Development, ¥190bn to Tech/DX](https://japan-equity.com/wp-content/uploads/2026/07/p30_sq-1024x1024.jpg)
![[Obayashi] MTP2022 KPIs — Operating Profit ~2x Target, ROE 14.4%](https://japan-equity.com/wp-content/uploads/2026/07/p25_sq-1024x1024.jpg)
![[Obayashi] Cash Allocation — ¥420bn Investment CF Over Five Years](https://japan-equity.com/wp-content/uploads/2026/07/p26_sq-1024x1024.jpg)
![[Obayashi] Green Energy — 44 Plants, 344MW, and the Green Hydrogen Challenge](https://japan-equity.com/wp-content/uploads/2026/07/p21_sq-1024x1024.jpg)
![[Obayashi] Tackling the Labor Shortage — Robotics Construction®](https://japan-equity.com/wp-content/uploads/2026/07/p14_sq-1024x1024.jpg)
