
This article is based on publicly available IR materials and is not a recommendation to buy or sell any specific securities.
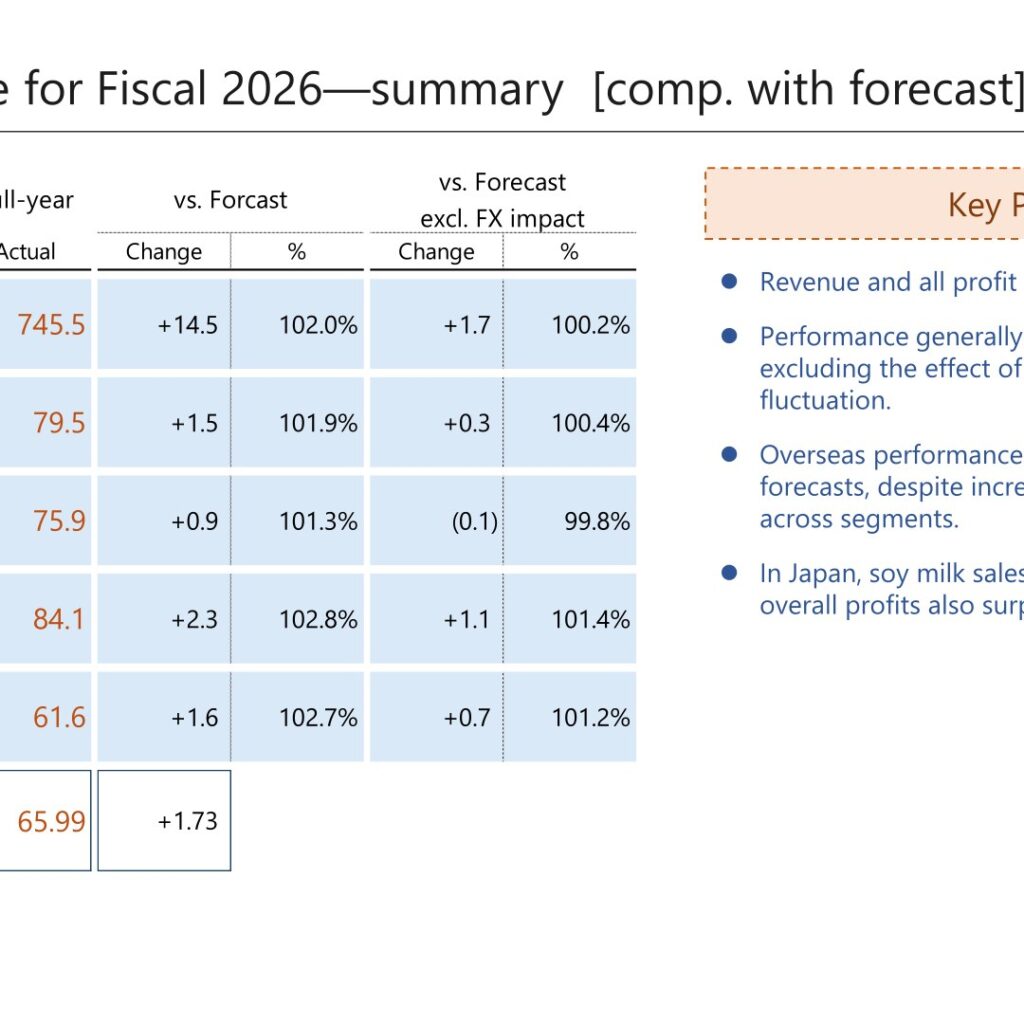
Note: Kikkoman labels the fiscal year ended March 31, 2026 as ‘Fiscal 2026’ in its own materials; the tables and figures below follow the company’s labels. In Fiscal 2026 (fiscal year ended March 31, 2026), Kikkoman’s revenue and all profit levels exceeded the company’s forecast, and revenue and business profit also increased year on year even excluding the effect of foreign exchange fluctuation. Overseas performance was overall in line with forecasts despite increases and decreases across segments, while in Japan soy milk sales exceeded forecasts and overall profits also surpassed forecasts. Revenue rose to ¥745.5 billion (+¥14.5 billion vs. forecast, 102.0%) and business profit rose to ¥79.5 billion (+¥1.5 billion vs. forecast, 101.9%), while profit attributable to owners of the parent was ¥61.6 billion (+¥1.6 billion vs. forecast, 102.7%).
Consolidated Results (Fiscal 2026 Actual)
On a year-on-year basis, Fiscal 2026 revenue increased to ¥745.5 billion (+¥36.6 billion, 105.2%) and business profit increased to ¥79.5 billion (+¥2.2 billion, 102.9%), with business profit margin of 10.7% (down 0.2pt year on year). Profit attributable to owners of the parent was essentially flat year on year at ¥61.6 billion (99.9%), while EPS was ¥65.99 (+¥1.00 year on year). Although performance got off to a slow start in H1 due to factors including US tariff policies, overall growth proceeded as planned in H2.
| Item | FY2026 Actual (Bn yen) | YoY Change | YoY % | YoY % (excl. FX Impact) |
|---|---|---|---|---|
| Revenue | 745.5 | +36.6 | 105.2% | 105.2% |
| Business Profit | 79.5 | +2.2 | 102.9% | 103.6% |
| BP Margin | 10.7% | (0.2)pt | – | – |
| Profit Attributable to Owners of the Parent | 61.6 | (0.1) | 99.9% | 100.7% |
| EPS (yen) | 65.99 | +1.00 | – | – |
Segment Results
By segment, Foods—Wholesale in North America and Business in Japan (including soy milk) were the main drivers of full-year growth, while Foods—Manufacturing and Sales in North America and Europe (soy sauce) also increased revenue and profit for the full year despite a slower H1. Overseas business profit increased ¥1.4 billion year on year to ¥71.6 billion, driven mainly by higher sales of soy sauce and wholesale, partly offset by higher SG&A expenses (higher marketing costs for food manufacturing and sales, and increased fixed costs for wholesale). Business profit in Japan increased ¥1.8 billion year on year to ¥11.5 billion, driven mainly by higher sales of soy sauce and food products, partly offset by higher advertising expenses tied to soy milk marketing and other fixed expenses such as labor costs.
| Segment | Revenue (Bn yen) | YoY Change | YoY % | Business Profit (Bn yen) | BP Margin | Source Page |
|---|---|---|---|---|---|---|
| Foods—Manufacturing and Sales in North America (Soy Sauce) | 103.4 | +2.2 | 102.1% | 29.0 | 28.0% | 17 |
| Foods—Manufacturing and Sales in Europe (Soy Sauce Business) | 35.3 | +2.1 | 106.9% | 8.0 | 22.6% | 18 |
| Foods—Wholesale in North America | 315.6 | +25.1 | 108.5% | 24.6 | 7.8% | 19 |
| Business in Japan | 169.6 | +6.0 | 103.7% | 11.5 | 6.8% | 21 |
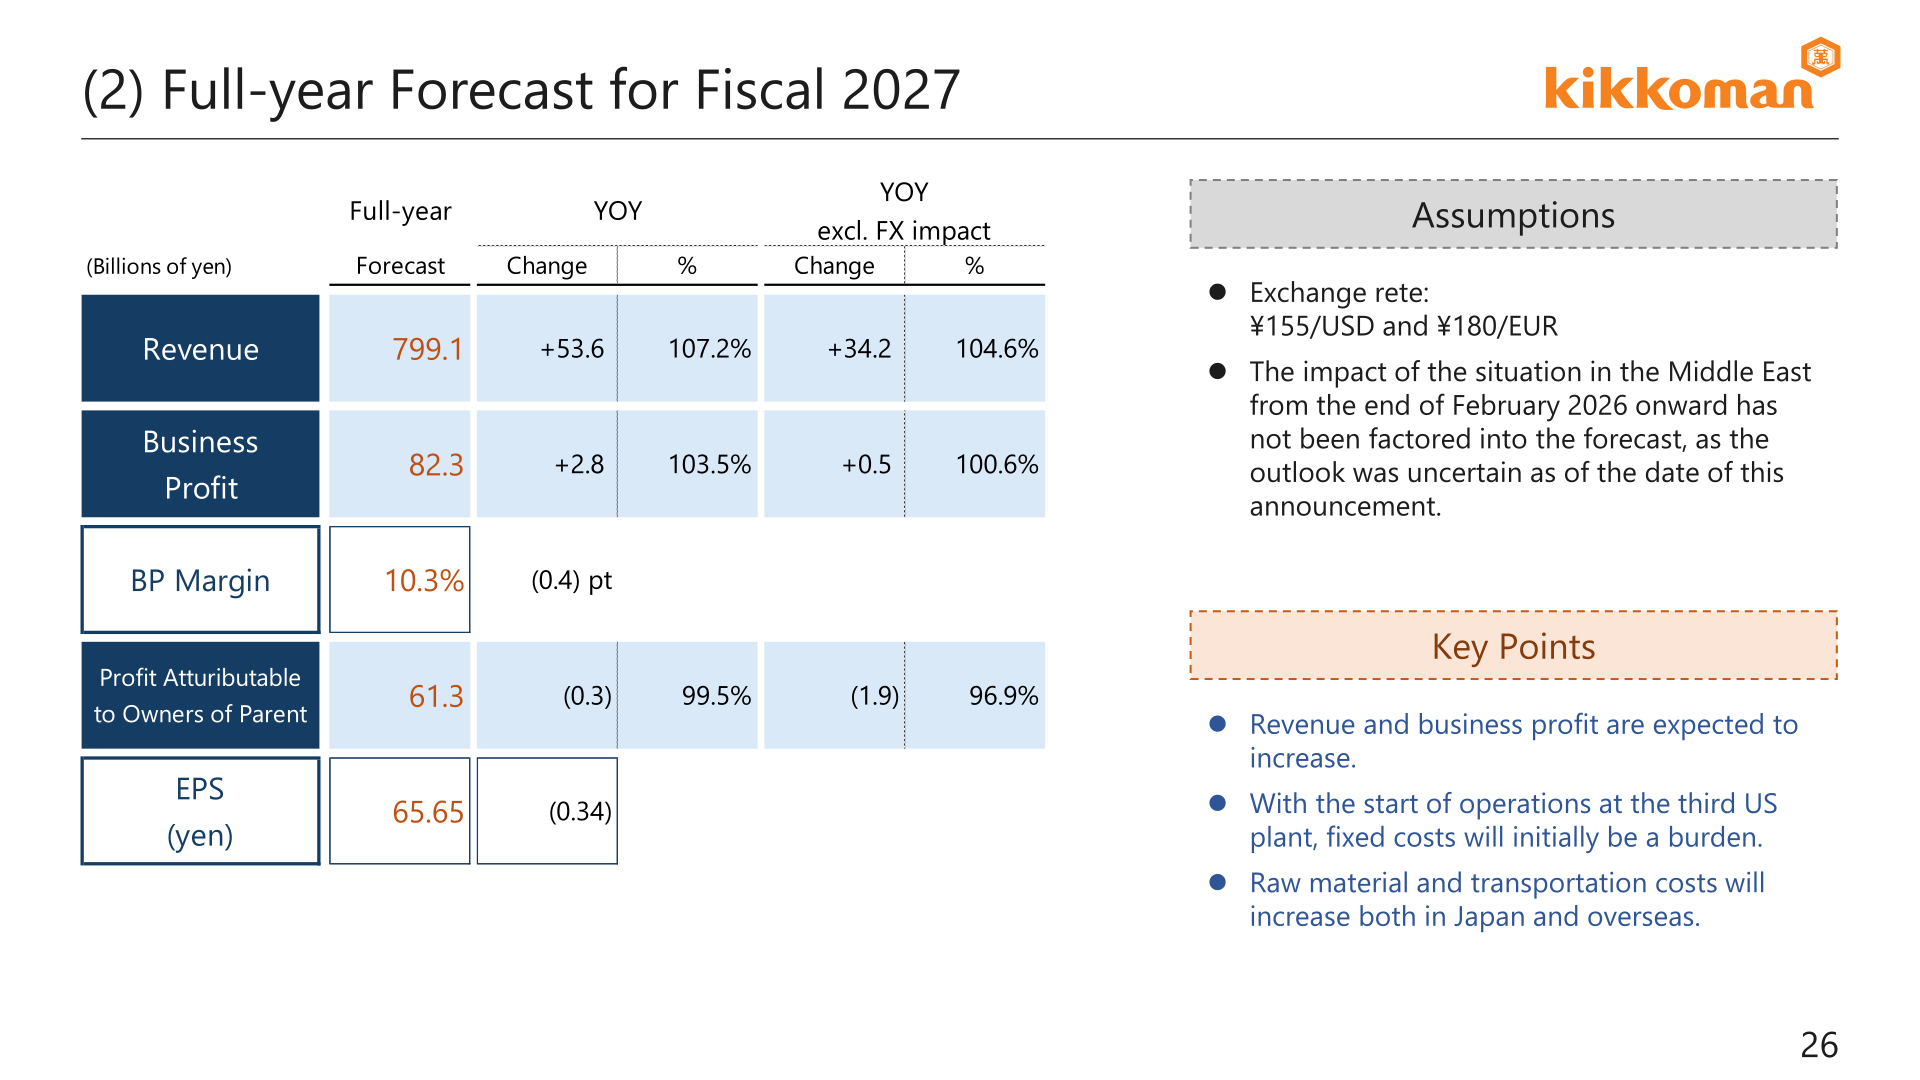
Full-Year Forecast for Fiscal 2027
For Fiscal 2027 (fiscal year ending March 31, 2027), Kikkoman forecasts revenue of ¥799.1 billion (+¥53.6 billion year on year, 107.2%) and business profit of ¥82.3 billion (+¥2.8 billion year on year, 103.5%), with business profit margin of 10.3% (down 0.4pt year on year). Profit attributable to owners of the parent is forecast at ¥61.3 billion (-¥0.3 billion year on year, 99.5%) and EPS at ¥65.65 (-¥0.34 year on year). The forecast assumes exchange rates of ¥155/USD and ¥180/EUR. With the start of operations at the third US plant, fixed costs will initially be a burden, and raw material and transportation costs are expected to increase both in Japan and overseas. The impact of the situation in the Middle East from the end of February 2026 onward has not been factored into the forecast, as the outlook was uncertain as of the date of the announcement.
| Item | FY2027 Forecast (Bn yen) | YoY Change | YoY % | YoY % (excl. FX Impact) |
|---|---|---|---|---|
| Revenue | 799.1 | +53.6 | 107.2% | 104.6% |
| Business Profit | 82.3 | +2.8 | 103.5% | 100.6% |
| BP Margin | 10.3% | (0.4)pt | – | – |
| Profit Attributable to Owners of the Parent | 61.3 | (0.3) | 99.5% | 96.9% |
| EPS (yen) | 65.65 | (0.34) | – | – |
By segment, shipments from the third US plant are planned to begin in September 2026, and the growth rate for Foods—Manufacturing and Sales in North America is expected to recover in H2, though fixed cost burdens from the plant investment will cause a temporary decline in profit margin. Foods—Manufacturing and Sales in Europe (soy sauce) is expected to return to double-digit revenue growth with an improving profit margin. Foods—Wholesale in North America is expected to continue top-line growth while profit margin is expected to decline. In Japan, all segments are expected to achieve revenue growth, supported in part by a soy milk price revision announced effective from September 2026.
| Segment | Revenue Forecast (Bn yen) | YoY Change | YoY % | Business Profit Forecast (Bn yen) | BP Margin | Source Page |
|---|---|---|---|---|---|---|
| Foods—Manufacturing and Sales in North America (Soy Sauce) | 109.8 | +6.4 | 106.2% | 28.2 | 25.7% | 27 |
| Foods—Manufacturing and Sales in Europe (Soy Sauce Business) | 40.1 | +4.8 | 113.5% | 9.4 | 23.5% | 28 |
| Foods—Wholesale in North America | 340.0 | +9.0 | 107.8% | 25.4 | 7.5% | 29 |
| Business in Japan | +176.3 | +6.7 | 104.0% | +12.2 | 6.9% | 31 |
Shareholder Returns
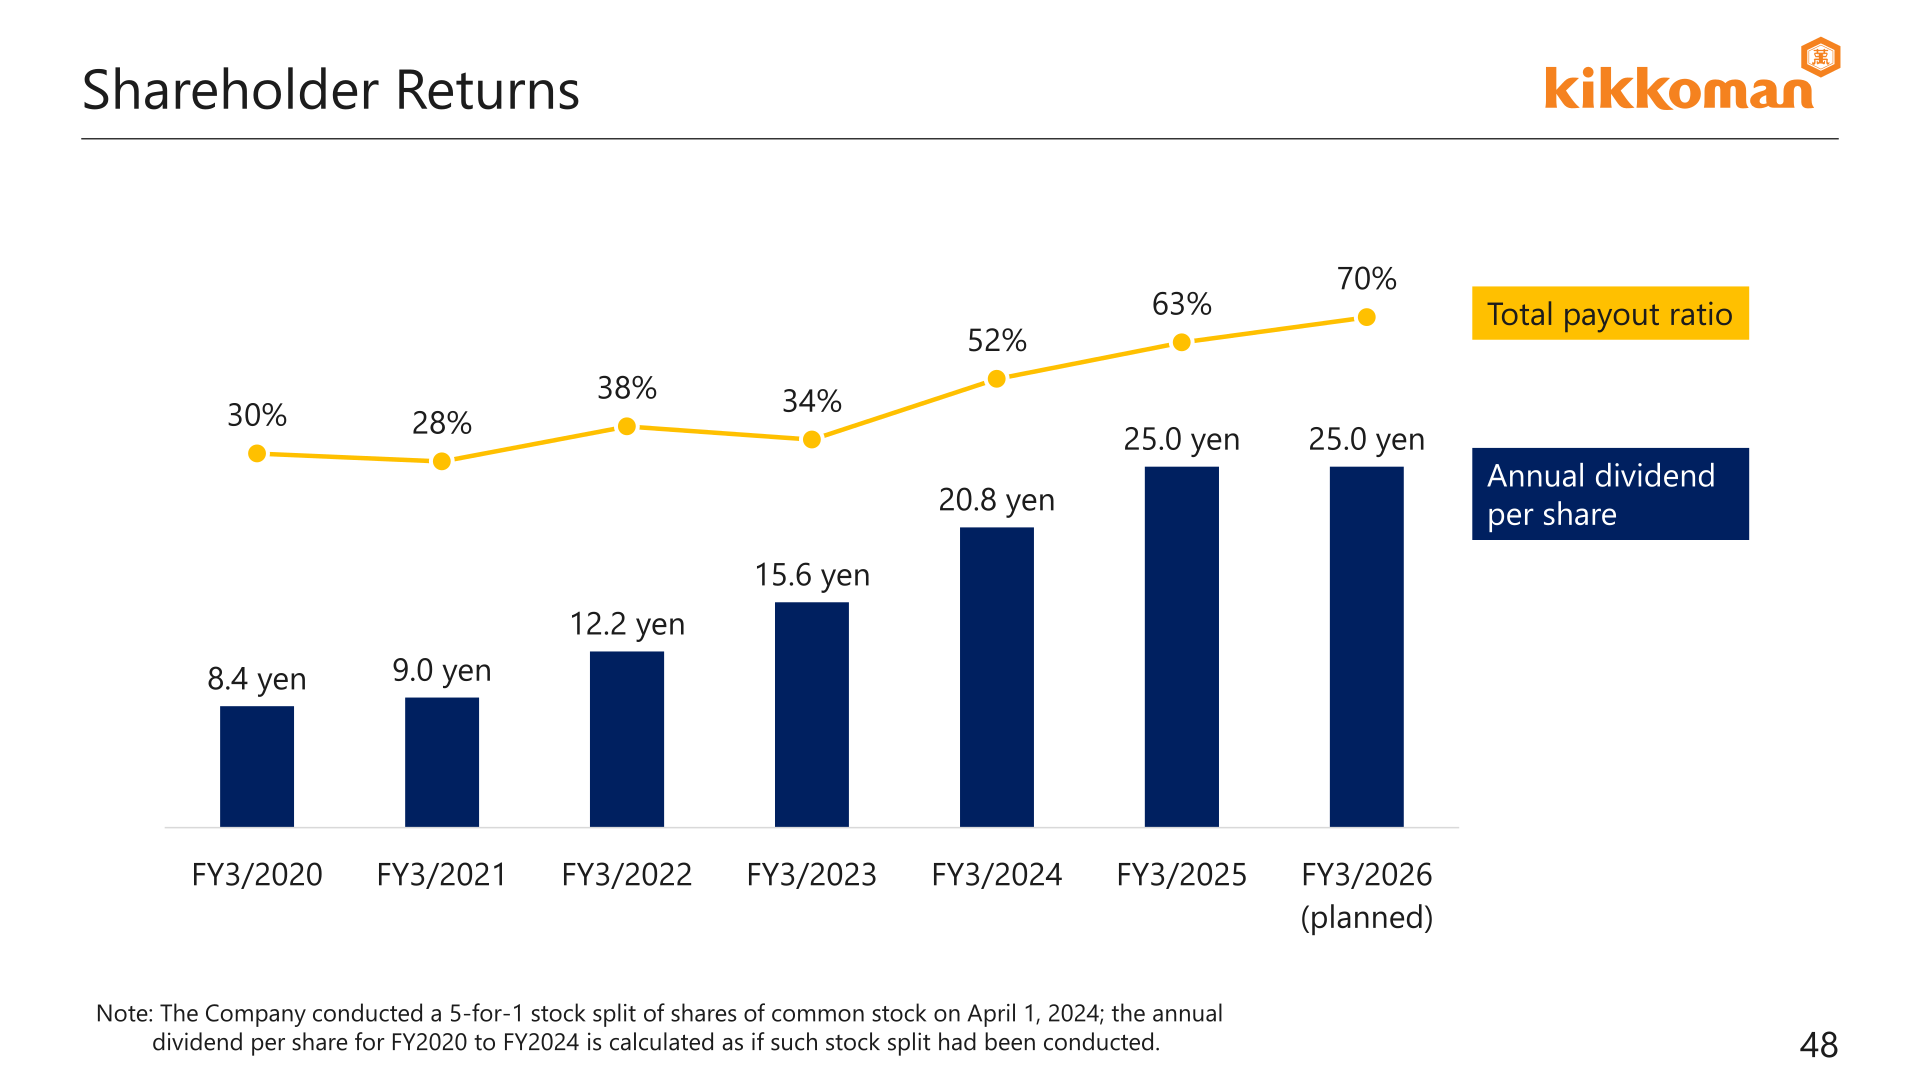
Kikkoman’s capital policy for the FY2026–2028 Medium-Term Management Plan targets a consolidated dividend payout ratio of 35% or more, with continued progressive dividends, and continued share repurchases. Annual dividend per share for FY3/2026 (planned) is ¥25.0, unchanged from FY3/2025, with a total payout ratio of 70% for FY3/2026 (planned), up from 63% in FY3/2025. Over the FY2026–2028 plan period, the company plans external capital-funded shareholder returns of ¥70.0 billion in dividends and capital investment of ¥170.0 billion (Soy sauce ¥80.0 billion, Wholesale ¥40.0 billion, split as Overseas ¥120.0 billion + Japan ¥50.0 billion), funded by operating cash flow of ¥280.0 billion and cash and deposits of ¥100.0 billion (as of March 2025).
Medium-Term Plan / Topics
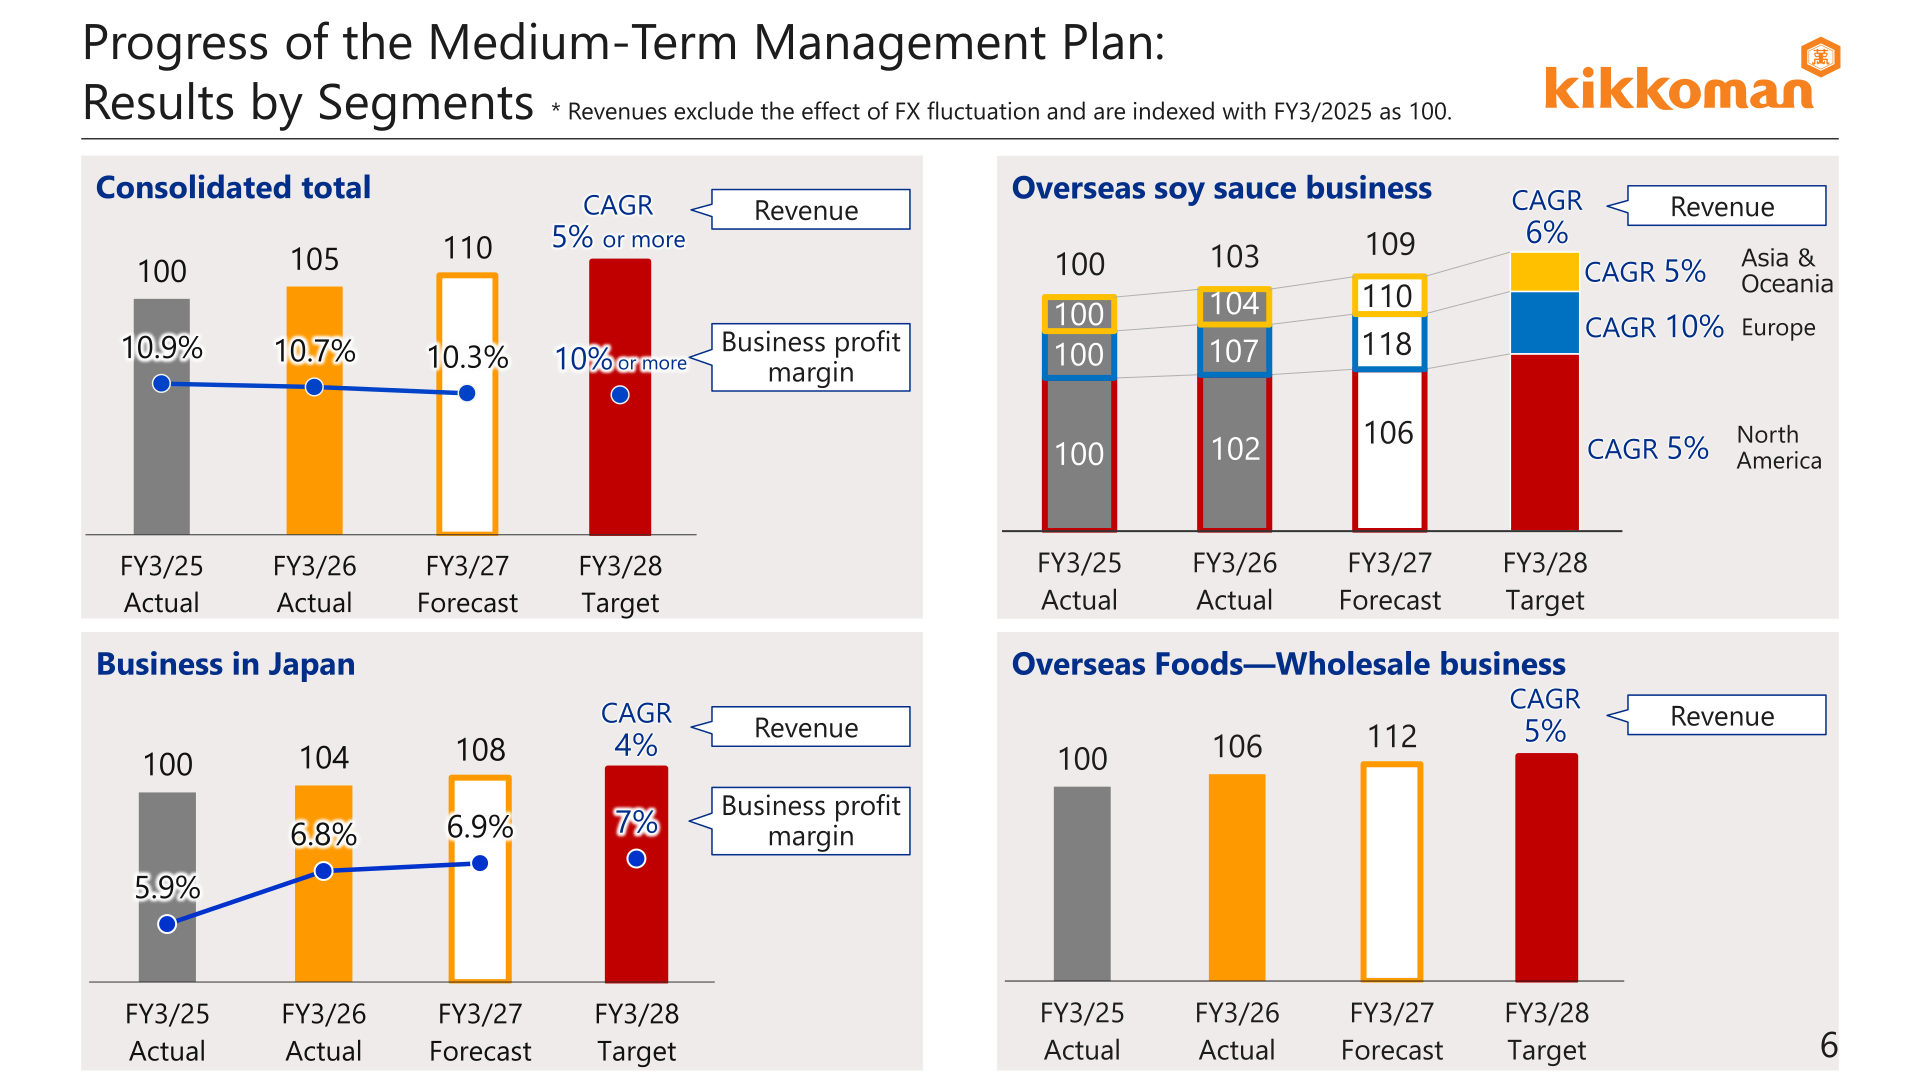
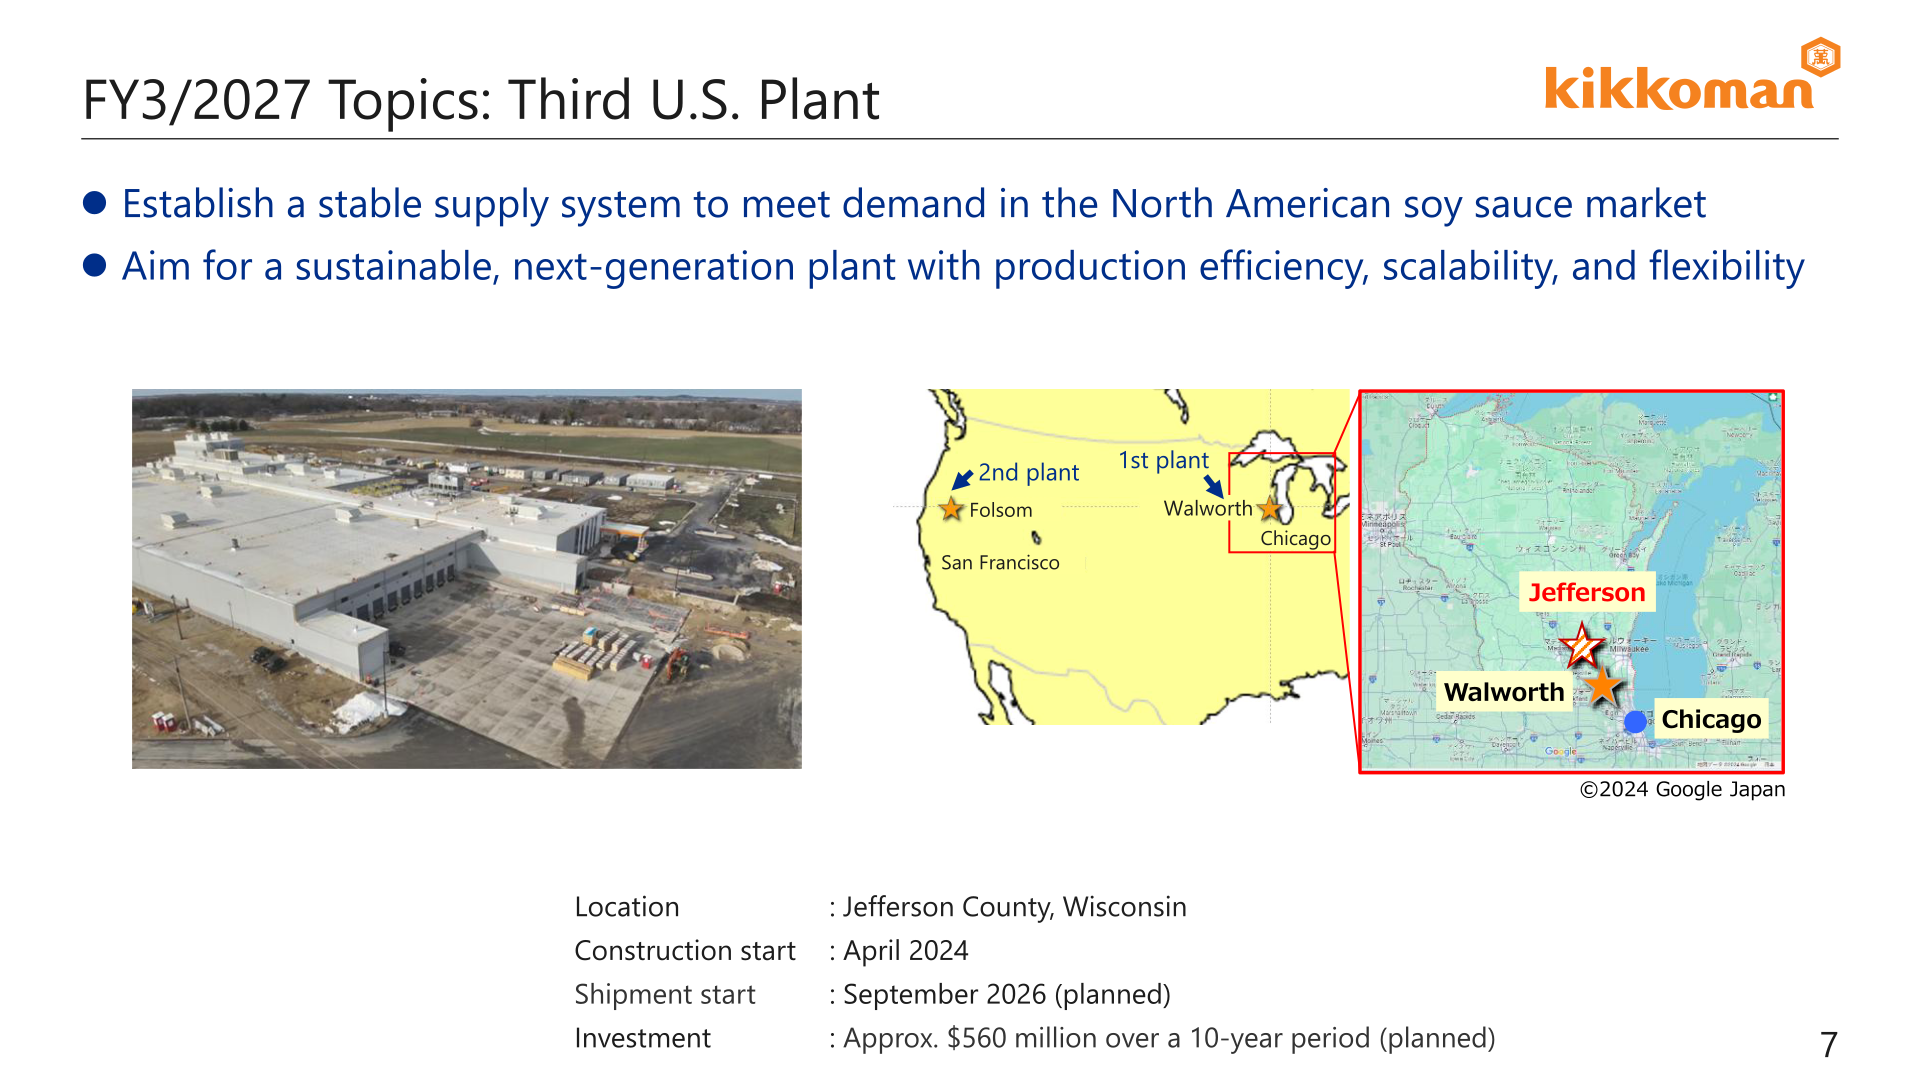
Under the FY2026–2028 Medium-Term Management Plan, Kikkoman targets sales growth CAGR of 5% or more (excl. FX fluctuation), business profit margin of 10% or more, and ROE of 12% or more by FY3/2028. As a topic for Fiscal 2027, the company is constructing a third US plant in Jefferson County, Wisconsin, with construction start in April 2024, planned shipment start in September 2026, and planned investment of approximately $560 million over a 10-year period, aimed at establishing a stable supply system to meet demand in the North American soy sauce market.
This article is an analysis based on publicly available information and is not a recommendation to buy or sell any specific securities. Investment decisions are your own responsibility.
![[Obayashi] Investors’ Guide 2026 — The Complete 24-Article Breakdown](https://japan-equity.com/wp-content/uploads/2026/07/hub_cover-1024x1024.png)
![[Obayashi] IR & SR Policy — Feeding Dialogue Back into Management](https://japan-equity.com/wp-content/uploads/2026/07/p32_sq-1024x1024.jpg)
![[Obayashi] Real Estate Development — 18.7% Margin, ¥287.7bn Unrealized Gains](https://japan-equity.com/wp-content/uploads/2026/07/p20_sq-1024x1024.jpg)
![[Obayashi] Domestic Civil Engineering — Resilience Spending Supports 9.6% Margin](https://japan-equity.com/wp-content/uploads/2026/07/p11_sq-1024x1024.jpg)
![[Obayashi] Share Price & External Ratings — vs TOPIX, ESG Index Inclusion](https://japan-equity.com/wp-content/uploads/2026/07/p40_sq-1024x1024.jpg)
![[Construction] ¥75.5tn Investment, Shrinking Workforce — Big-5 Market Share](https://japan-equity.com/wp-content/uploads/2026/07/p12_sq-1024x1024.jpg)



![[Obayashi] Capital Policy & Shareholder Returns — ROE 10%+, DOE ~5%, ¥100bn Buyback](https://japan-equity.com/wp-content/uploads/2026/07/p27_sq-1024x1024.jpg)
![[Obayashi] Reducing Cross-Shareholdings — ¥285.2bn Sold in Five Years](https://japan-equity.com/wp-content/uploads/2026/07/p29_sq-1024x1024.jpg)
![[Obayashi] ¥750bn Investment Plan — ¥300bn to Development, ¥190bn to Tech/DX](https://japan-equity.com/wp-content/uploads/2026/07/p30_sq-1024x1024.jpg)
![[Obayashi] MTP2022 KPIs — Operating Profit ~2x Target, ROE 14.4%](https://japan-equity.com/wp-content/uploads/2026/07/p25_sq-1024x1024.jpg)
![[Obayashi] Cash Allocation — ¥420bn Investment CF Over Five Years](https://japan-equity.com/wp-content/uploads/2026/07/p26_sq-1024x1024.jpg)
![[Obayashi] Green Energy — 44 Plants, 344MW, and the Green Hydrogen Challenge](https://japan-equity.com/wp-content/uploads/2026/07/p21_sq-1024x1024.jpg)
![[Obayashi] Tackling the Labor Shortage — Robotics Construction®](https://japan-equity.com/wp-content/uploads/2026/07/p14_sq-1024x1024.jpg)
