
This article is based on publicly available IR materials and is not a recommendation to buy or sell any specific securities.
Note: Fujio Food Group does not publish an English results presentation; this article is an English translation of the Japanese-language article on our sister site Investalk, which is based on the company’s Japanese-language IR materials, with figures transcribed as reported.
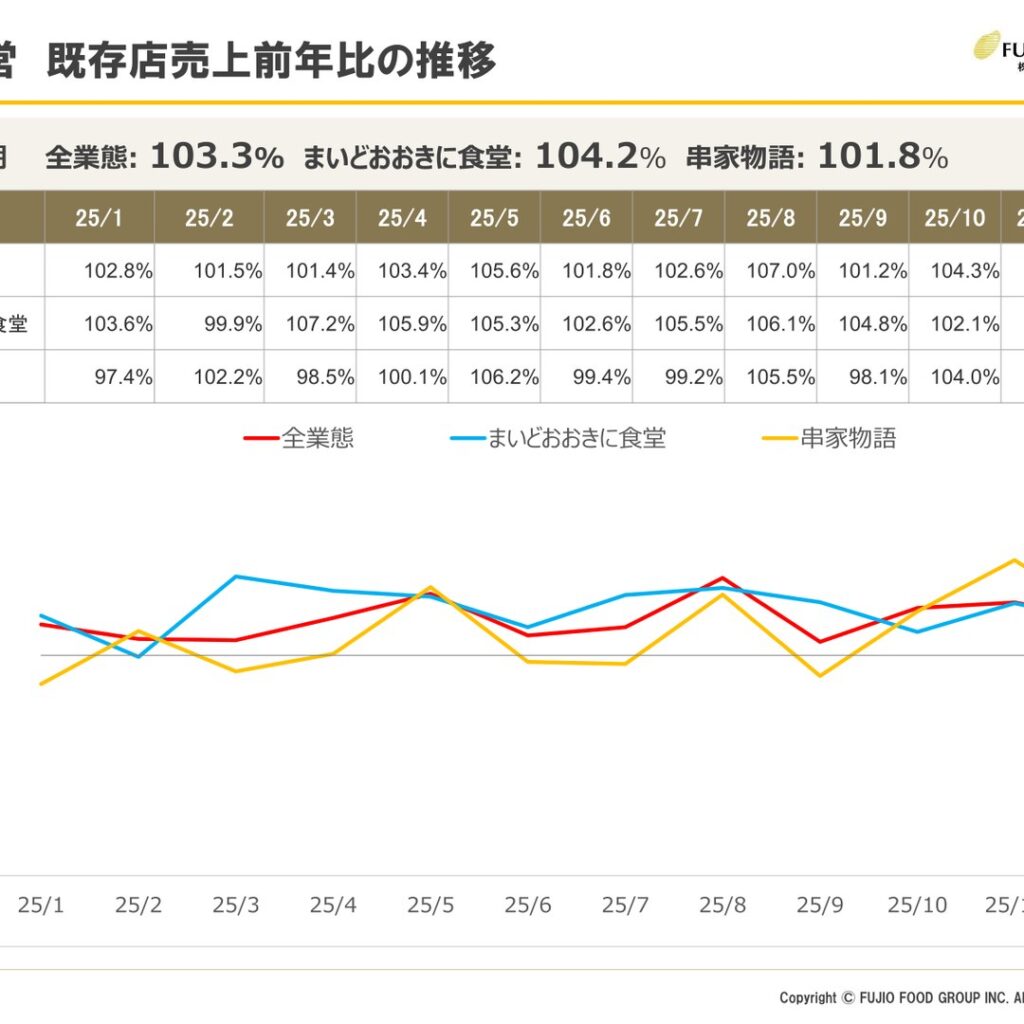
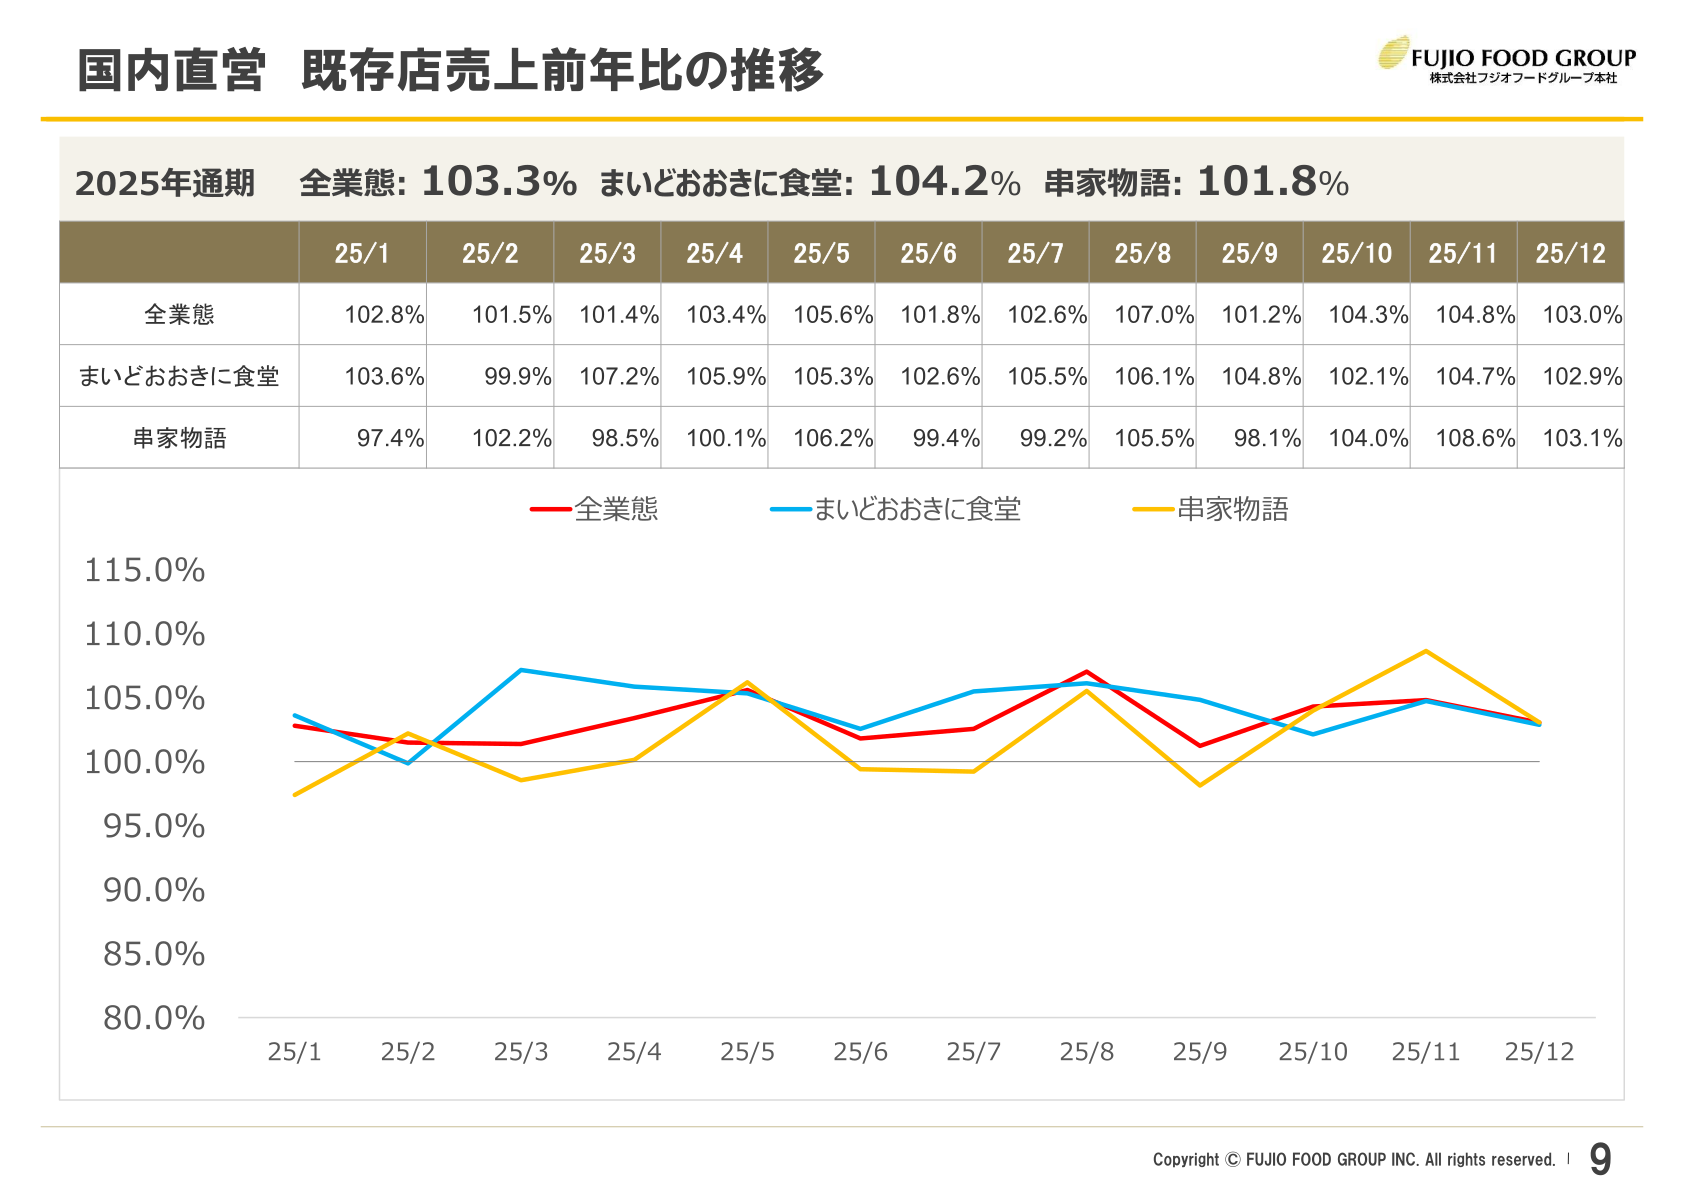
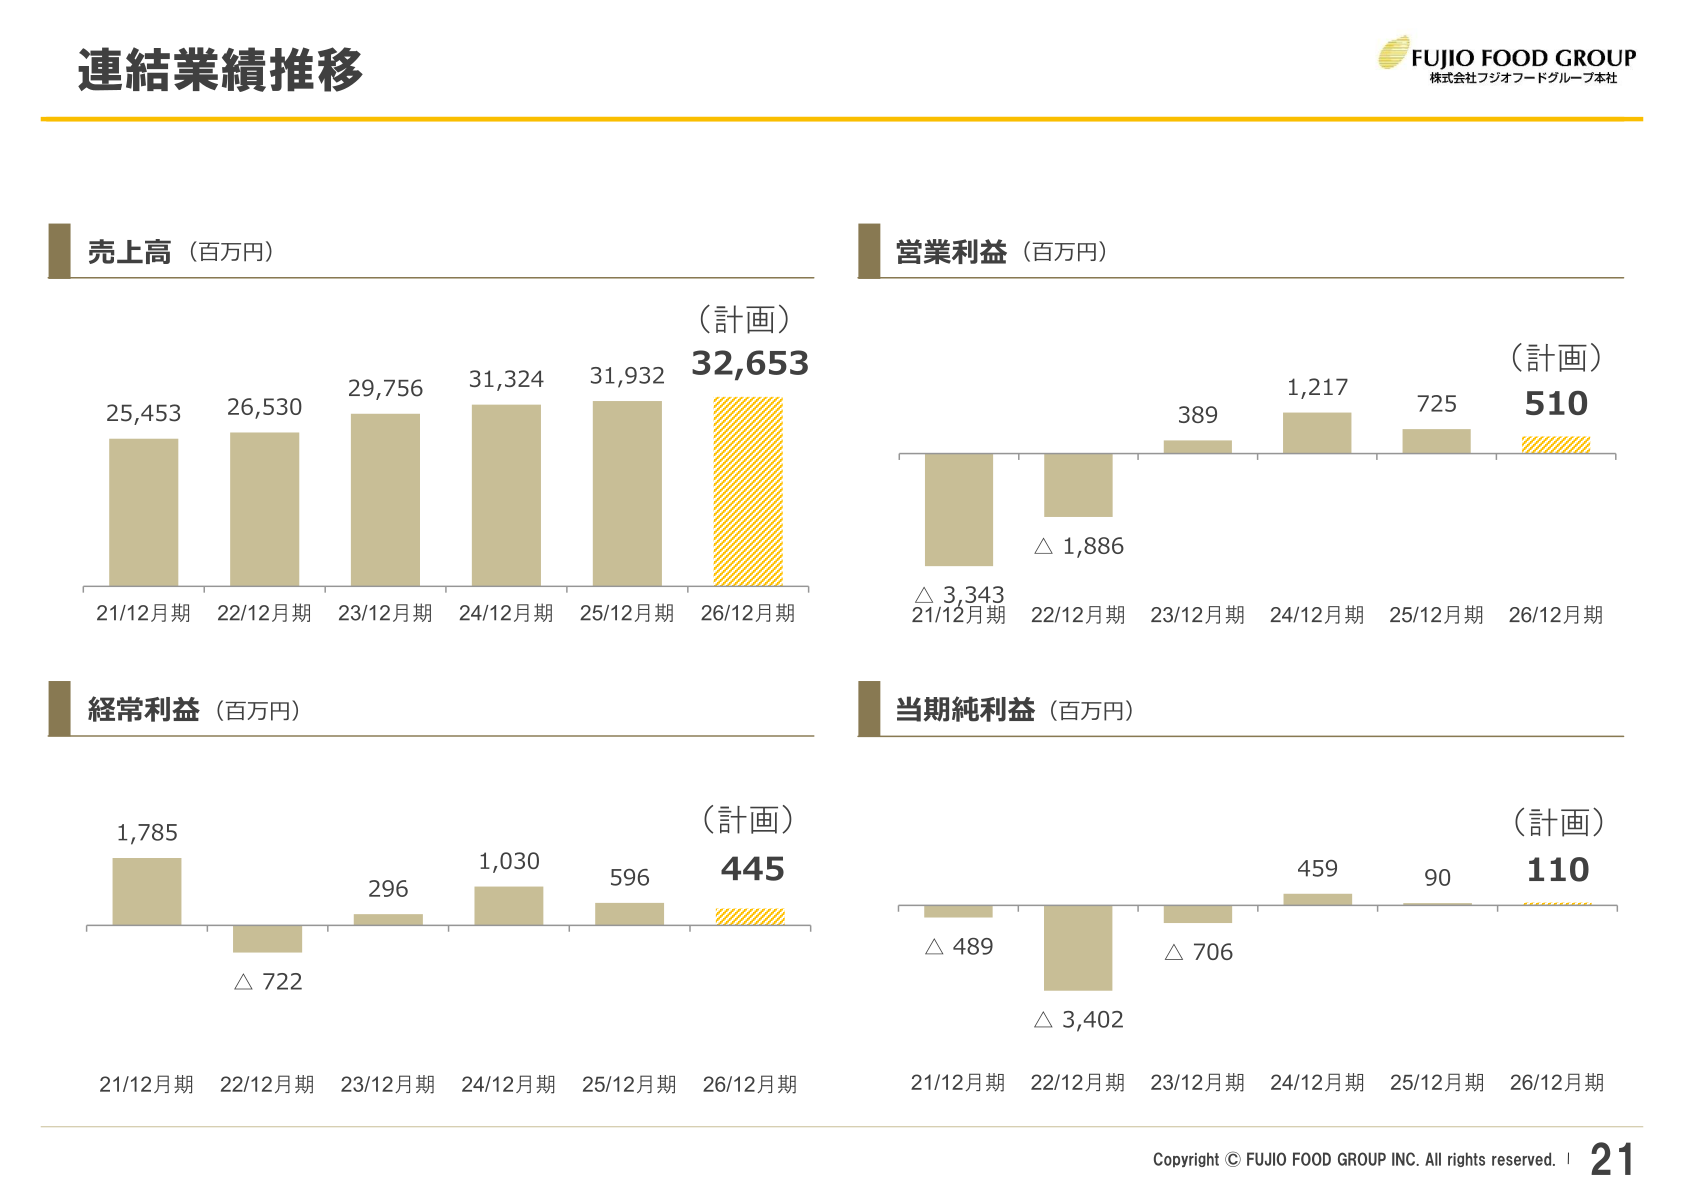
In FY December 2025, although the number of customers at Fujio Food Group temporarily decreased as it passed on higher raw material prices, sales rose to 31,932 million yen (up 1.9% year on year) on growth in existing-store sales and other factors. On the other hand, rising costs such as labor weighed on earnings, and operating profit came to 725 million yen (down 40.4% year on year), while net income attributable to owners of the parent was held to 90 million yen (down 80.3% year on year). Year-on-year sales at domestic directly-managed existing stores grew to 103.3%, and 104.4% on an all-store basis, and second-half operating profit improved to a level on par with the previous year.
Consolidated Results (FY December 2025 Actual)
By business, sales were 30,341 million yen in the directly-managed business (up 2.3% year on year) and 1,590 million yen in the franchised business (down 3.7% year on year). The cost of sales ratio was 35.4% (up 0.4pt year on year) and the SG&A expense ratio was 62.3% (up 1.2pt year on year), with the labor cost ratio also rising 0.5pt. Extraordinary losses included an impairment loss of 436 million yen and a store cancellation loss of 33 million yen. EBITDA (operating profit plus depreciation) was 1,280 million yen (down 27.6% year on year). Against the initial forecast (sales of 32,291 million yen and operating profit of 617 million yen), actual sales came in 358 million yen below the forecast, while the operating margin improved, and operating profit exceeded the forecast by 108 million yen (17.6%), ordinary profit by 128 million yen (27.3%) and net income by 44 million yen (97.8%).
| Item | FY December 2025 | FY December 2024 | Change |
|---|---|---|---|
| Sales | 31,932 million yen | 31,324 million yen | +607 million yen (+1.9%) |
| Directly-managed business | 30,341 million yen | 29,672 million yen | +668 million yen (+2.3%) |
| Franchised business | 1,590 million yen | 1,651 million yen | △61 million yen (△3.7%) |
| Gross profit | 20,622 million yen | 20,347 million yen | +274 million yen (+1.3%) |
| Selling, general and administrative expenses | 19,896 million yen | 19,130 million yen | +765 million yen (+4.0%) |
| Operating profit | 725 million yen | 1,217 million yen | △491 million yen (△40.4%) |
| Ordinary profit | 596 million yen | 1,030 million yen | △434 million yen (△42.1%) |
| Net income attributable to owners of the parent | 90 million yen | 459 million yen | △368 million yen (△80.3%) |
| EBITDA | 1,280 million yen | 1,769 million yen | △489 million yen (△27.6%) |
Segment (By-Brand) Results
Looking at the directly-managed business by brand, TSURUMARU grew to sales of 1,694 million yen (up 31.1% year on year) on an increase in the number of stores and in existing-store sales. KUSHIYA MONOGATARI posted 7,612 million yen (up 1.8% year on year), SACHIFUKUYA 3,354 million yen (up 3.9% year on year), MAIDO OOKINI SHOKUDO 5,160 million yen (up 0.0% year on year) and EBINOYA 2,108 million yen (up 0.1% year on year). Year-on-year sales at domestic directly-managed existing stores for full-year 2025 were 103.3% for all brands, 104.2% for MAIDO OOKINI SHOKUDO and 101.8% for KUSHIYA MONOGATARI.
| Brand | FY December 2025 sales | Composition ratio | YoY change |
|---|---|---|---|
| MAIDO OOKINI SHOKUDO | 5,160 million yen | 17.0% | +0.0% |
| KUSHIYA MONOGATARI | 7,612 million yen | 25.1% | +1.8% |
| TSURUMARU | 1,694 million yen | 5.6% | +31.1% |
| SACHIFUKUYA | 3,354 million yen | 11.1% | +3.9% |
| EBINOYA | 2,108 million yen | 6.9% | +0.1% |
| Others | 10,411 million yen | 34.3% | +0.0% |
| Directly-managed business total | 30,341 million yen | 100.0% | +2.3% |
Full-Year Forecast (FY December 2026)
For FY December 2026, the company assumes existing-store sales of 103% year on year and plans sales of 32,653 million yen (up 2.3% year on year). On the other hand, reflecting factors such as an expected 240 million yen in closing costs for 25 stores, it plans operating profit of 510 million yen (down 29.7% year on year) and ordinary profit of 445 million yen (down 25.2% year on year). Net income is expected to be 110 million yen (up 22.3% year on year). By half, the plan calls for sales of 16,156 million yen and operating profit of 210 million yen in the first half and sales of 16,497 million yen and operating profit of 299 million yen in the second half, with the second half expected to account for 58.6% of full-year operating profit.
| Item | FY December 2025 (Actual) | FY December 2026 (Plan) | Change |
|---|---|---|---|
| Sales | 31,932 million yen | 32,653 million yen | +721 million yen (+2.3%) |
| Operating profit | 725 million yen | 510 million yen | △215 million yen (△29.7%) |
| Ordinary profit | 596 million yen | 445 million yen | △150 million yen (△25.2%) |
| Net income | 90 million yen | 110 million yen | +20 million yen (+22.3%) |
| Item | First-half plan | Second-half plan | Full-year plan |
|---|---|---|---|
| Sales | 16,156 million yen | 16,497 million yen | 32,653 million yen |
| Operating profit | 210 million yen | 299 million yen | 510 million yen |
| Ordinary profit | 179 million yen | 266 million yen | 445 million yen |
| Net income | 69 million yen | 41 million yen | 110 million yen |
Shareholder Returns
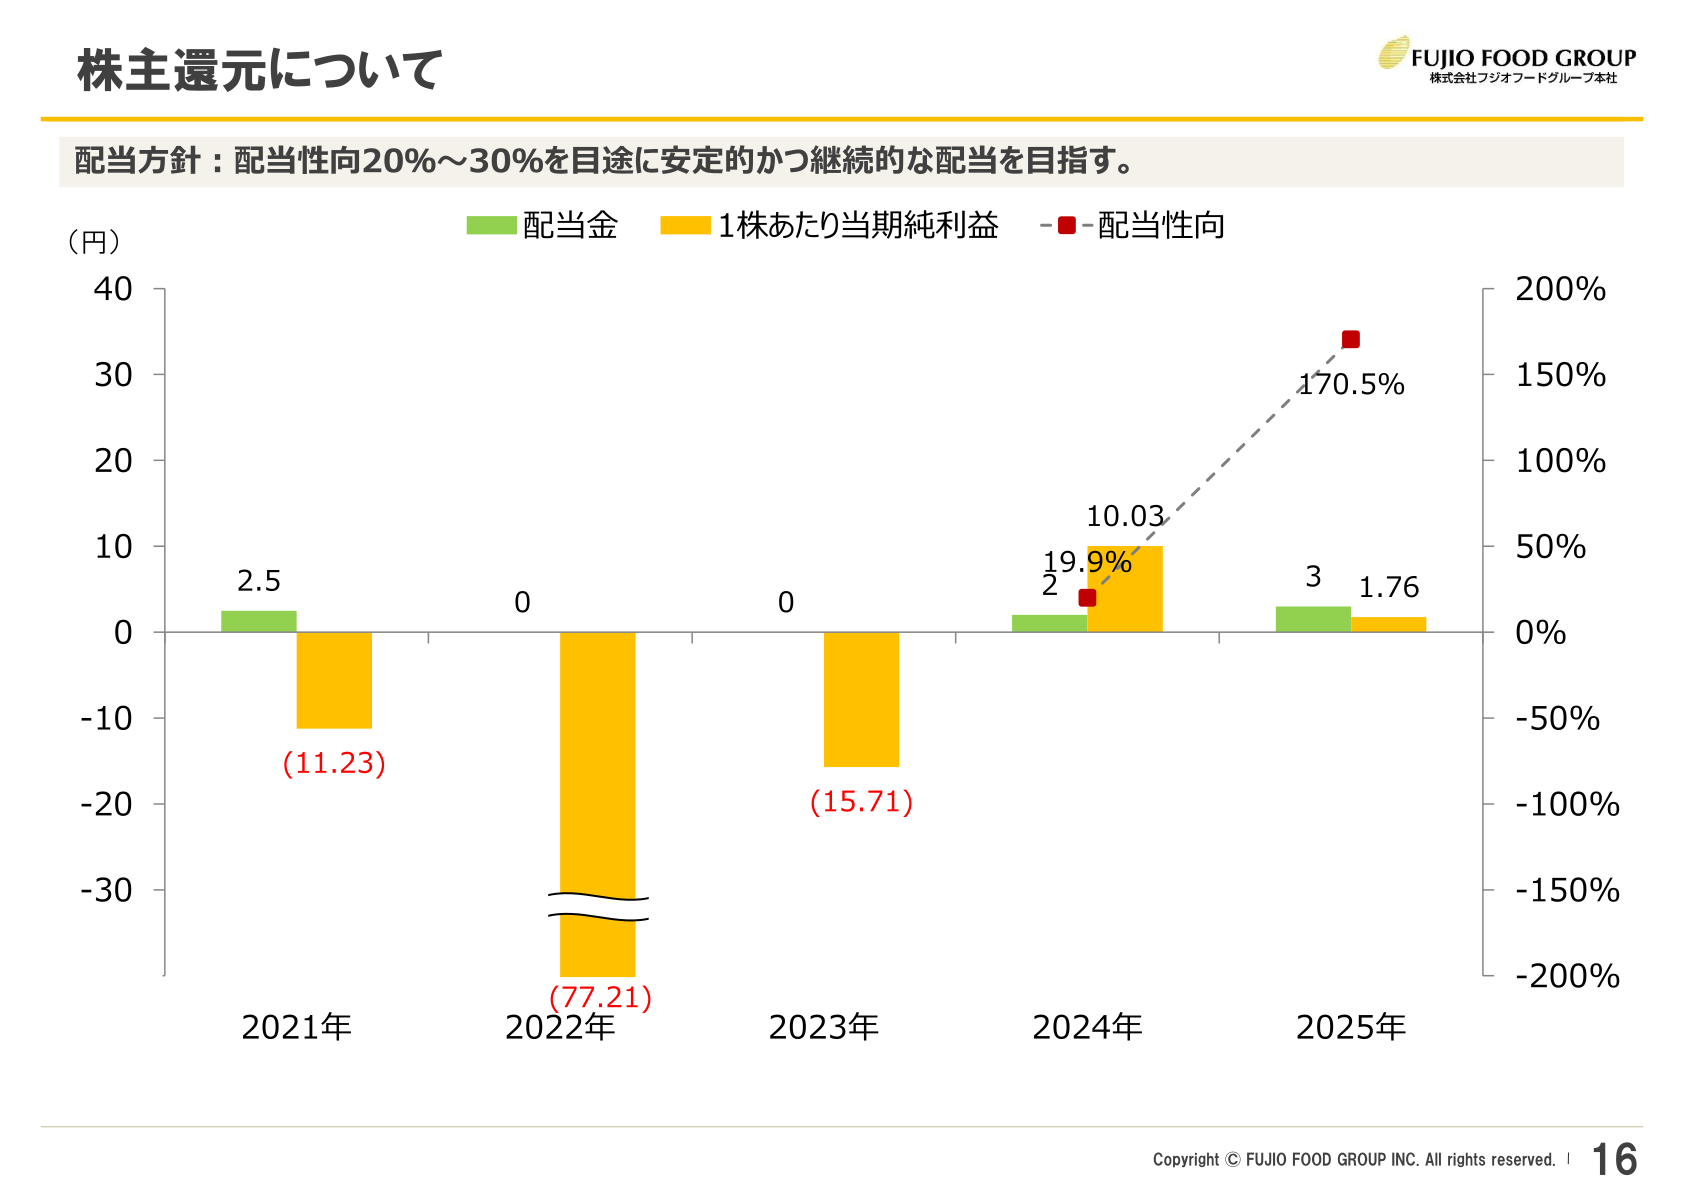
The dividend policy states that the company aims for stable and continuous dividends with a target payout ratio of 20% to 30%. In addition, part of the shareholder benefit items was changed from the entitlement at the end of December 2025. There is no change to the gift criteria (100 to 299 shares: goods equivalent to 3,000 yen; 300 to 999 shares: equivalent to 6,000 yen; 1,000 shares or more: equivalent to 12,000 yen, twice a year).
Medium-Term Plan / Topics
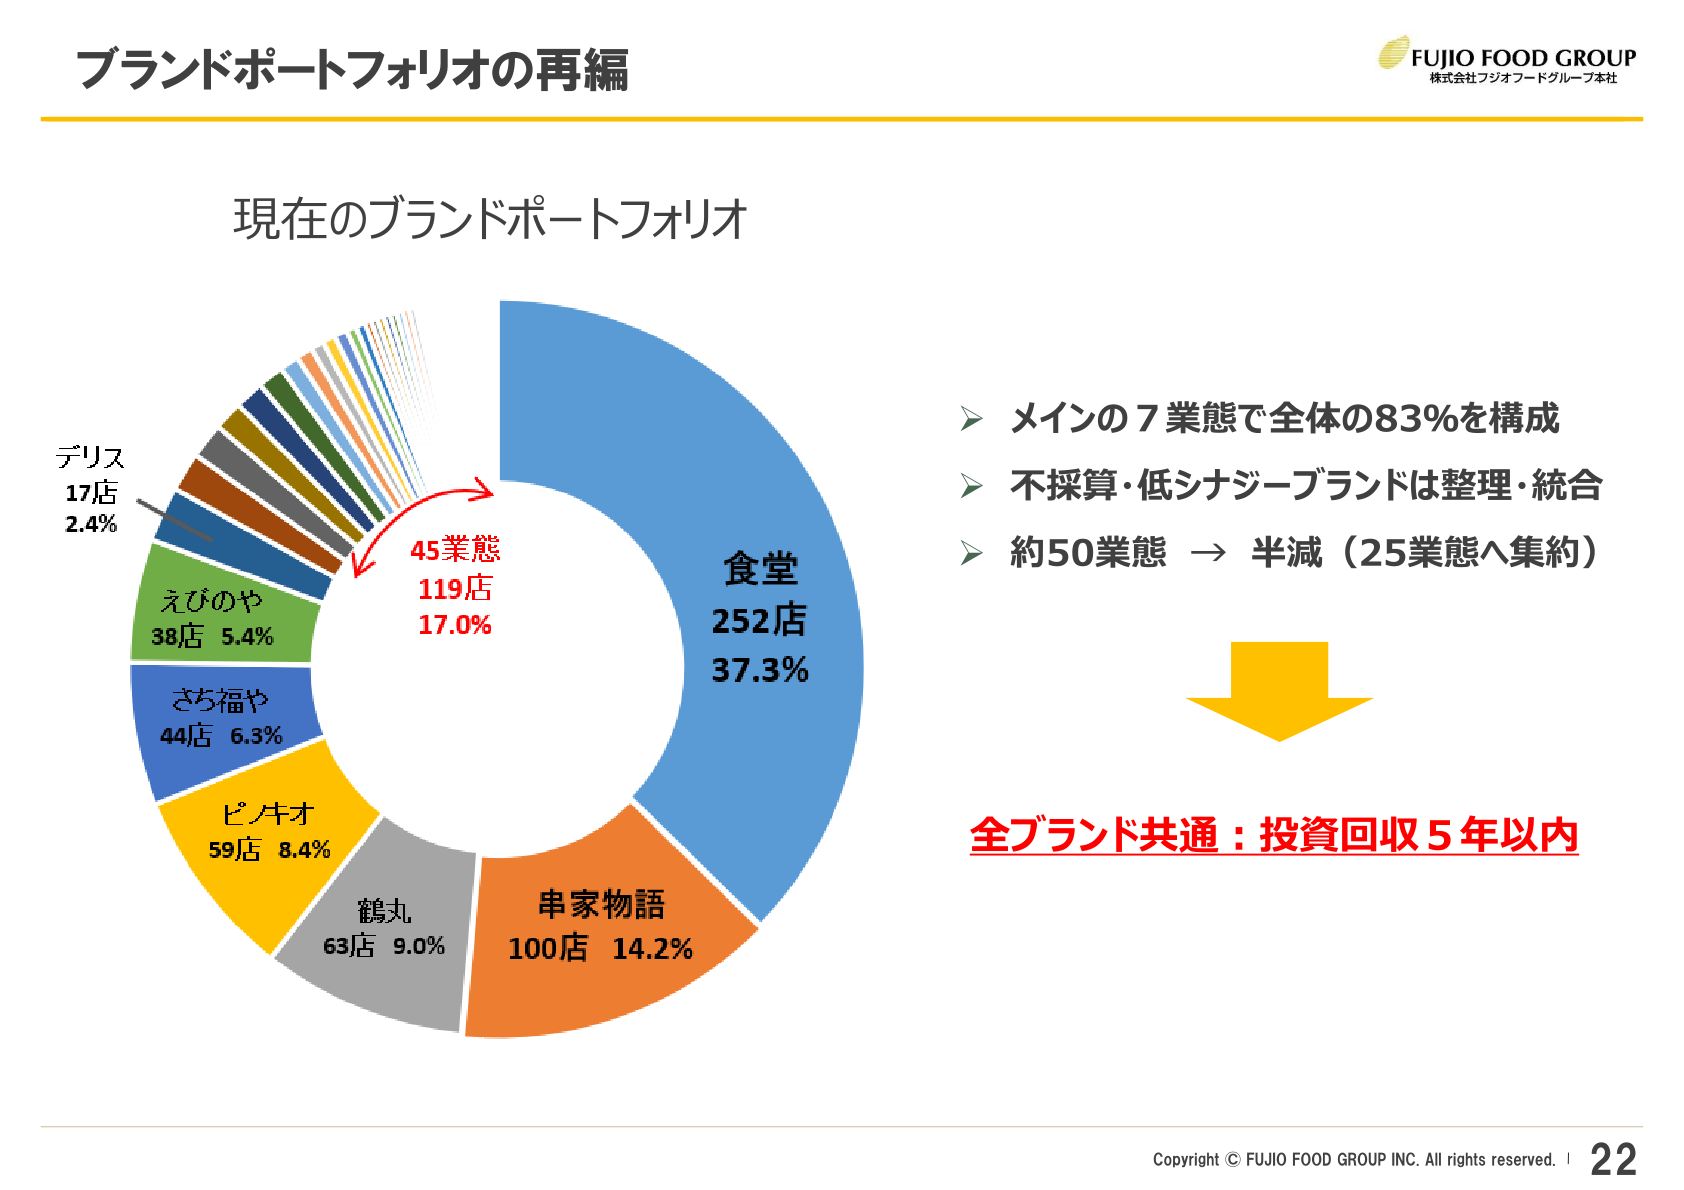
Regarding the brand portfolio, the seven main brands account for 83% of the total, while the company is proceeding with the reorganization and consolidation of unprofitable and low-synergy brands under a policy of halving approximately 50 brands to 25. A payback period within five years is applied as the common standard for all brands. The company is also pursuing DX through the renewal of its profit-and-loss management system, order management system and expense reimbursement system to improve operational efficiency. As of the end of December 2025, the group operated 702 outlets in total (398 directly-managed stores, 80 consignment stores and 224 franchised stores).
This article is an analysis based on publicly available information and is not a recommendation to buy or sell any specific securities. Investment decisions are your own responsibility.
















