
This article is based on publicly available IR materials and is not a recommendation to buy or sell any specific securities.
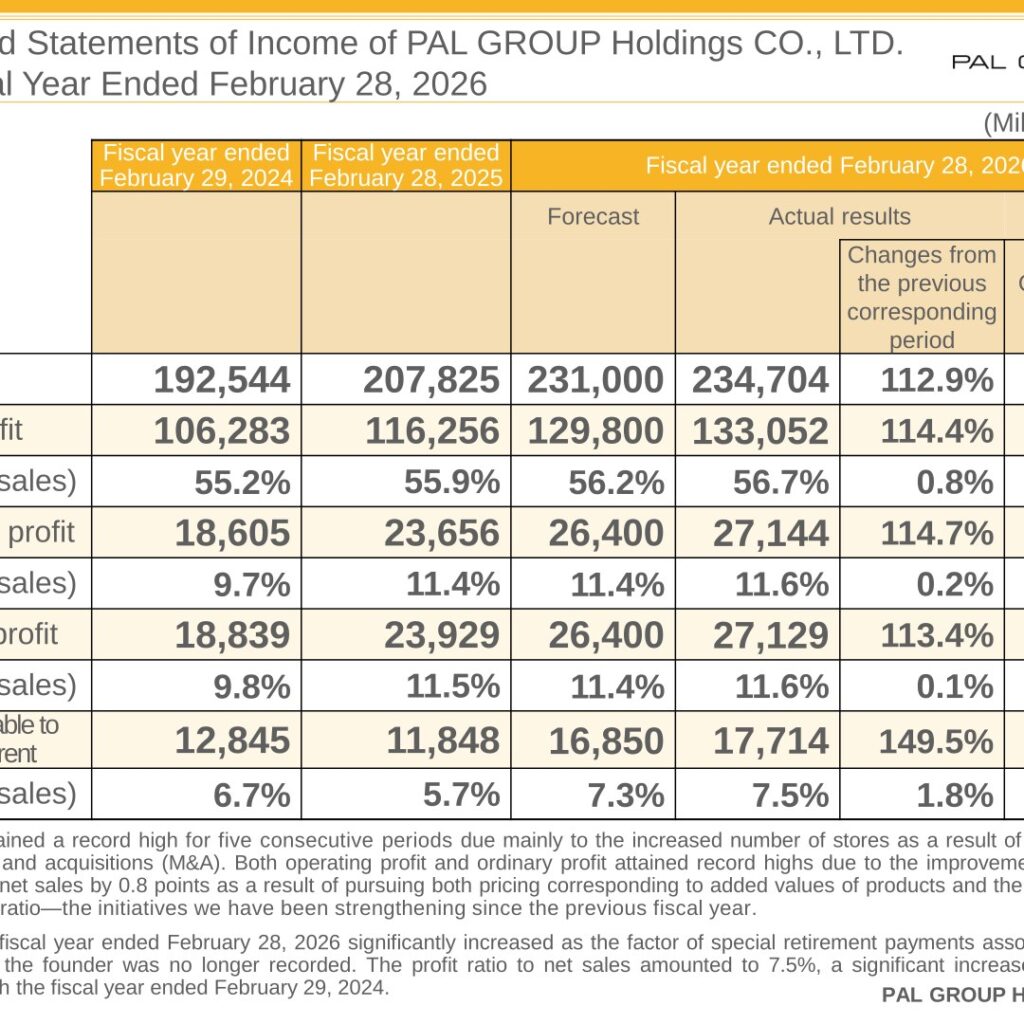
PAL GROUP Holdings CO., LTD. reported record results for the fiscal year ended February 28, 2026, with consolidated net sales of ¥234,704 million and operating profit of ¥27,144 million. Net sales attained a record high for five consecutive periods and operating profit for four consecutive years, supported by store openings, M&A and an improved gross profit ratio. Profit attributable to owners of parent rose to ¥17,714 million as the special retirement payments associated with the retirement of the founder recorded in the prior year were no longer incurred. Every line of the income statement also came in above the company’s own forecast.
Note on year labels: this site classifies each company’s most recently completed fiscal year as FY2025. PAL GROUP Holdings closes its books at the end of February, and the materials label this period “Fiscal year ended February 28, 2026”; the tables and text below keep the company’s own labels.
Consolidated Results (Full-Year Actual)
According to the company, net sales attained a record high for five consecutive periods due mainly to the increased number of stores as a result of store openings and mergers and acquisitions (M&A). Both operating profit and ordinary profit attained record highs due to the improvement of the gross profit ratio to net sales by 0.8 points, the result of pursuing both pricing corresponding to added values of products and an increase in the regular sales ratio. The profit ratio to net sales amounted to 7.5%. In the columns headed “Changes from the previous corresponding period” and “Compared to forecast,” the materials express each figure as a percentage of the comparison period, not as a growth rate.
| Item (Millions of yen) | FY ended February 29, 2024 | FY ended February 28, 2025 | FY ended February 28, 2026 (Forecast) | FY ended February 28, 2026 (Actual results) | Changes from the previous corresponding period | Compared to forecast |
|---|---|---|---|---|---|---|
| Net sales | 192,544 | 207,825 | 231,000 | 234,704 | 112.9% | 101.6% |
| Gross profit | 106,283 | 116,256 | 129,800 | 133,052 | 114.4% | 102.5% |
| (% of net sales) | 55.2% | 55.9% | 56.2% | 56.7% | 0.8% | 0.5% |
| Operating profit | 18,605 | 23,656 | 26,400 | 27,144 | 114.7% | 102.8% |
| (% of net sales) | 9.7% | 11.4% | 11.4% | 11.6% | 0.2% | 0.2% |
| Ordinary profit | 18,839 | 23,929 | 26,400 | 27,129 | 113.4% | 102.8% |
| (% of net sales) | 9.8% | 11.5% | 11.4% | 11.6% | 0.1% | 0.2% |
| Profit attributable to owners of parent | 12,845 | 11,848 | 16,850 | 17,714 | 149.5% | 105.1% |
| (% of net sales) | 6.7% | 5.7% | 7.3% | 7.5% | 1.8% | 0.2% |
Consolidated SG&A expenses were ¥105,907 million and the consolidated SG&A ratio rose by 0.5 points to 45.1%, due mainly to an increase in the personnel expenses ratio to 16.5%. The company attributes that to an increase of ¥700 million in provision for bonuses reflecting strong business results in the first quarter, as well as the impact of increased personnel and wage hikes. Total assets stood at ¥164,496 million and total net assets at ¥86,167 million, with an equity ratio of 50.8%. Cash flows from operating activities were ¥21,332 million and cash and cash equivalents at the end of the period were ¥96,264 million, an increase of ¥10,548 million.
Segment Results
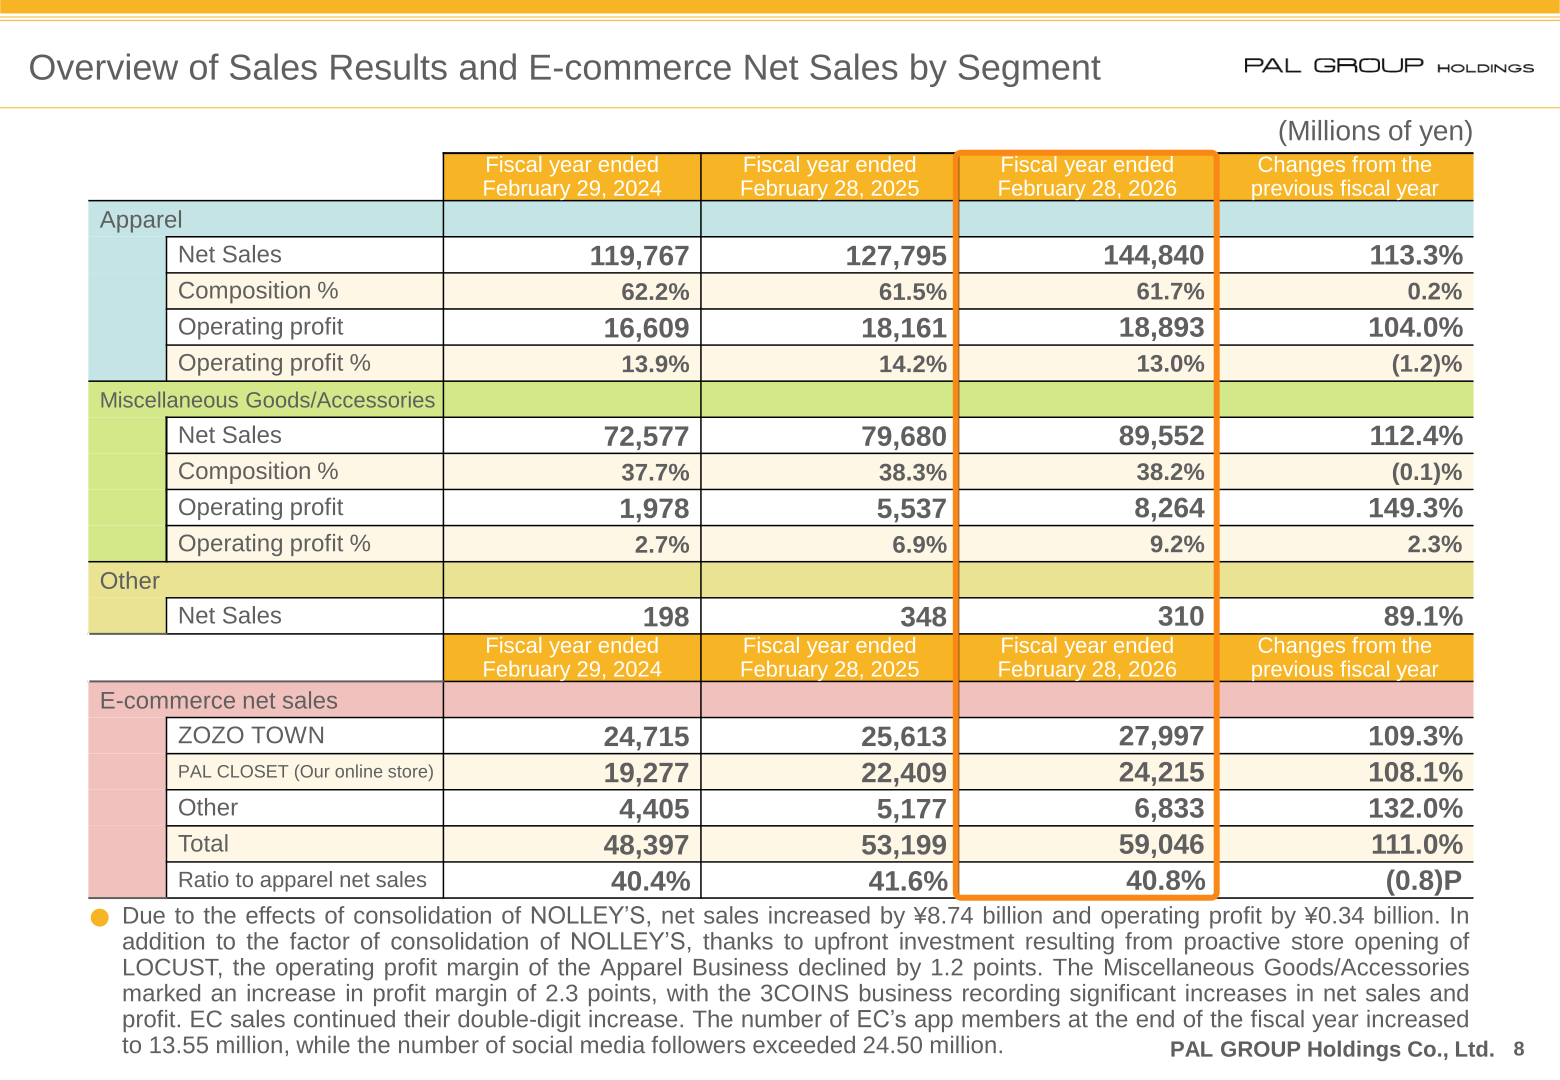
In the Apparel Business, net sales rose to 113.3% of the previous fiscal year’s level, but the operating profit margin declined by 1.2 points to 13.0% owing to the consolidation of NOLLEY’S and upfront investment resulting from proactive store opening of LOCUST. The Miscellaneous Goods/Accessories Business lifted its operating profit margin by 2.3 points to 9.2%, with the 3COINS business recording significant increases in net sales and profit. The company notes that the effects of consolidation of NOLLEY’S increased net sales by ¥8.74 billion and operating profit by ¥0.34 billion. E-commerce sales continued their double-digit increase; the number of EC app members at the end of the fiscal year increased to 13.55 million, while the number of social media followers exceeded 24.50 million.
| Segment / Item (Millions of yen) | FY ended February 29, 2024 | FY ended February 28, 2025 | FY ended February 28, 2026 | Changes from the previous fiscal year |
|---|---|---|---|---|
| Apparel — Net Sales | 119,767 | 127,795 | 144,840 | 113.3% |
| Apparel — Composition % | 62.2% | 61.5% | 61.7% | 0.2% |
| Apparel — Operating profit | 16,609 | 18,161 | 18,893 | 104.0% |
| Apparel — Operating profit % | 13.9% | 14.2% | 13.0% | (1.2)% |
| Miscellaneous Goods/Accessories — Net Sales | 72,577 | 79,680 | 89,552 | 112.4% |
| Miscellaneous Goods/Accessories — Composition % | 37.7% | 38.3% | 38.2% | (0.1)% |
| Miscellaneous Goods/Accessories — Operating profit | 1,978 | 5,537 | 8,264 | 149.3% |
| Miscellaneous Goods/Accessories — Operating profit % | 2.7% | 6.9% | 9.2% | 2.3% |
| Other — Net Sales | 198 | 348 | 310 | 89.1% |
| E-commerce — ZOZO TOWN | 24,715 | 25,613 | 27,997 | 109.3% |
| E-commerce — PAL CLOSET (Our online store) | 19,277 | 22,409 | 24,215 | 108.1% |
| E-commerce — Other | 4,405 | 5,177 | 6,833 | 132.0% |
| E-commerce — Total | 48,397 | 53,199 | 59,046 | 111.0% |
| E-commerce — Ratio to apparel net sales | 40.4% | 41.6% | 40.8% | (0.8)P |
Among the group companies, NICE CLAUP Co., LTD. posted net sales of ¥21,510 million (126.5% of the previous fiscal year) and operating profit of ¥1,801 million (112.8%), both record highs, with the core brand “one after another NICECLAUP” achieving the company’s long-standing goal of ¥5.0 billion in sales and “natural couture” recording a V-shaped recovery to reach ¥4.0 billion for the first time. NOLLEY’S co., ltd. saw net sales fall to ¥12,324 million (94.7%) and operating profit to ¥602 million (45.7%), which the company attributes to soaring material prices and a decline in foreign visitors; its “NOLLEY’S OUTLET” e-commerce channel grew to 166.8% of the previous fiscal year’s level.
The number of stores in Japan reached 1,151 as of February 28, 2026, an increase of 73 from the end of the previous fiscal year, reflecting 121 store openings and 48 closings. The Apparel Business opened 85 stores and closed 40 for a net increase of 45, with LOCUST accounting for a net increase of 27 stores to reach 42 in total. The Miscellaneous Goods/Accessories Business opened 29 3COINS+plus stores and 7 3COINS and other stores while closing 8 Salut! and other stores, for a net increase of 28.
Full-Year Forecast for the Fiscal Year Ending February 28, 2027
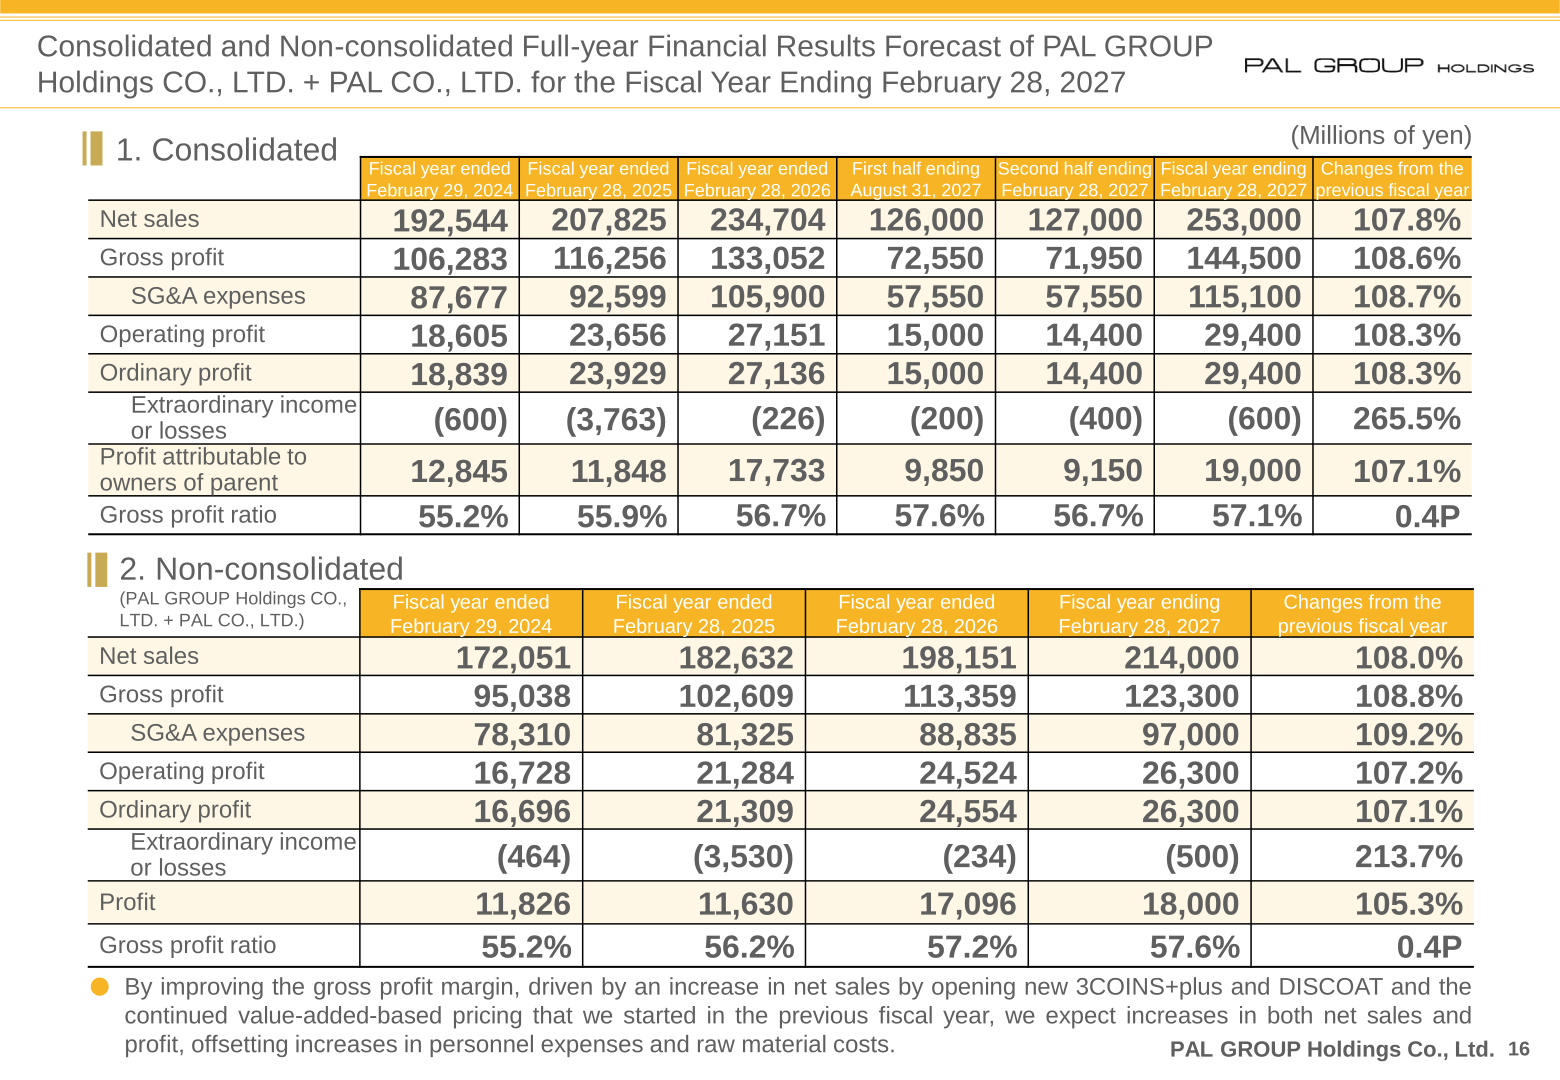
For the fiscal year ending February 28, 2027, the company forecasts consolidated net sales of ¥253,000 million, operating profit of ¥29,400 million and profit attributable to owners of parent of ¥19,000 million. Management expects increases in both net sales and profit by improving the gross profit margin, driven by an increase in net sales from opening new 3COINS+plus and DISCOAT stores and the continued value-added-based pricing started in the previous fiscal year, offsetting increases in personnel expenses and raw material costs. On a non-consolidated basis (PAL GROUP Holdings CO., LTD. + PAL CO., LTD.), the forecast calls for net sales of ¥214,000 million, operating profit of ¥26,300 million and profit of ¥18,000 million.
| Consolidated item (Millions of yen) | First half | Second half | FY ending February 28, 2027 (Forecast) | Changes from the previous fiscal year |
|---|---|---|---|---|
| Net sales | 126,000 | 127,000 | 253,000 | 107.8% |
| Gross profit | 72,550 | 71,950 | 144,500 | 108.6% |
| SG&A expenses | 57,550 | 57,550 | 115,100 | 108.7% |
| Operating profit | 15,000 | 14,400 | 29,400 | 108.3% |
| Ordinary profit | 15,000 | 14,400 | 29,400 | 108.3% |
| Extraordinary income or losses | (200) | (400) | (600) | 265.5% |
| Profit attributable to owners of parent | 9,850 | 9,150 | 19,000 | 107.1% |
| Gross profit ratio | 57.6% | 56.7% | 57.1% | 0.4P |
The premises behind the forecast include a net increase of 41 stores (57 openings and 16 closings fixed as of the presentation date) to 1,192 stores, and sales at existing stores of 102.0%, comprising 100.5% at existing retail stores and 109.0% at existing stores via internet.
Shareholder Returns
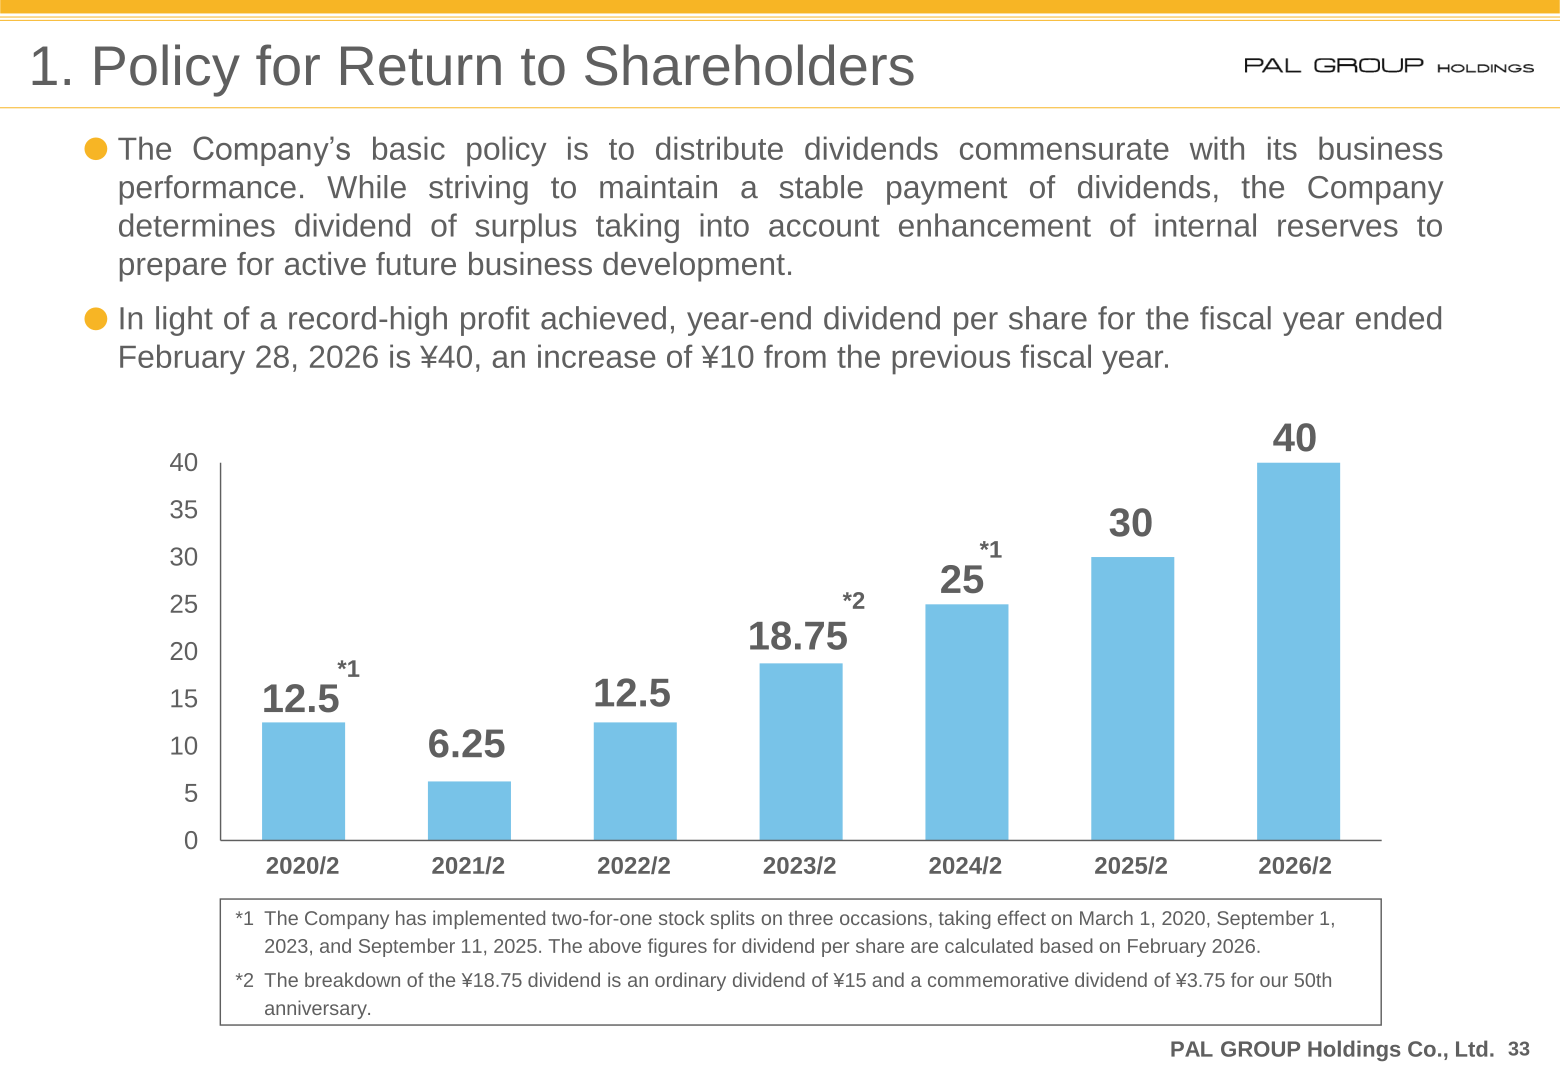
The company’s basic policy is to distribute dividends commensurate with its business performance; while striving to maintain a stable payment of dividends, it determines dividend of surplus taking into account enhancement of internal reserves to prepare for active future business development. In light of the record-high profit achieved, the year-end dividend per share for the fiscal year ended February 28, 2026 is ¥40, an increase of ¥10 from the previous fiscal year. The materials note that the company has implemented two-for-one stock splits on three occasions, taking effect on March 1, 2020, September 1, 2023, and September 11, 2025, and that the per-share dividend figures are calculated based on February 2026.
| Fiscal year | Dividend per share (yen) |
|---|---|
| 2024/2 | 25 |
| 2025/2 | 30 |
| 2026/2 | 40 |
PAL GROUP Holdings also maintains a shareholder benefit program. Shareholders recorded on the shareholder registry as of the last day of February each year holding more than 100 shares (one unit) receive common discount coupons — 2 coupons for 100 shares or more, 4 for 200 shares or more, 6 for 500 shares or more and 10 for 1,000 shares or more — usable from June 1 each year to May 31 of the following year for 50% discounts on accommodation course charges at affiliated facilities. The number of participating accommodations increased to four in June 2025, and “SETRE NARAMACHI” is the latest addition.
Medium- to Long-Term Vision and Topics
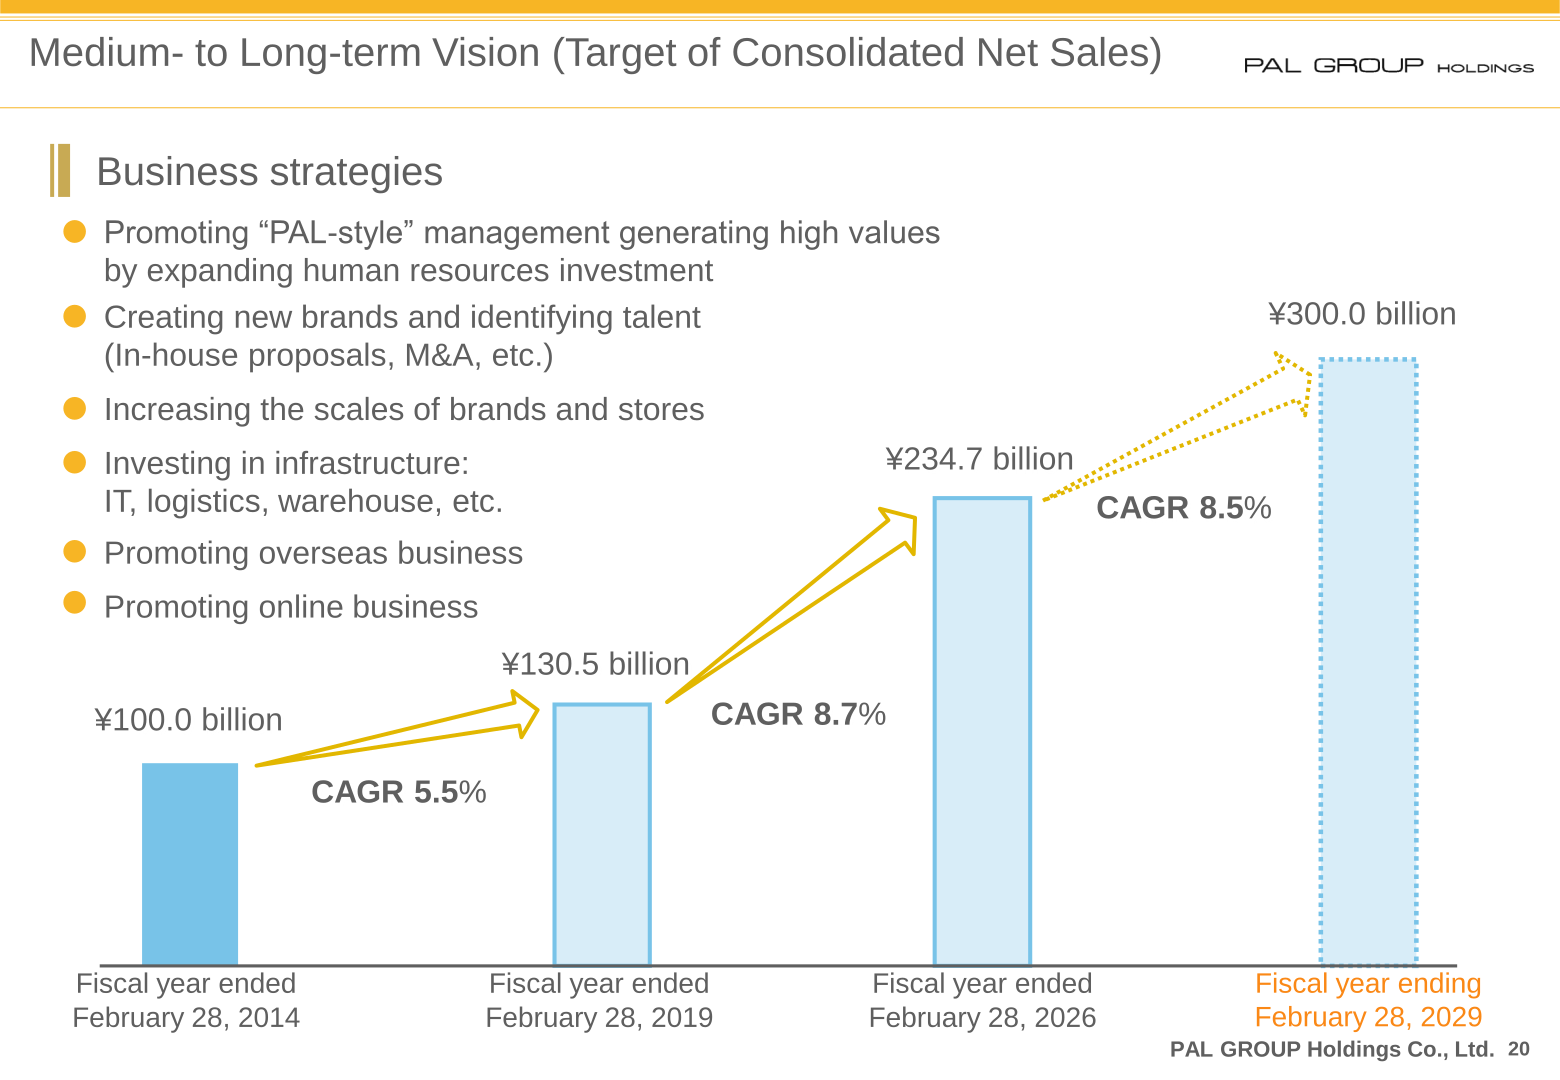
The company’s medium- to long-term vision targets consolidated net sales of ¥300.0 billion for the fiscal year ending February 28, 2029, up from ¥234.7 billion in the fiscal year ended February 28, 2026 and ¥130.5 billion in the fiscal year ended February 28, 2019. Business strategies listed include increasing the scales of brands and stores, promoting online business, promoting overseas business, creating new brands and identifying talent through in-house proposals and M&A, investing in IT, logistics and warehouse infrastructure, and promoting “PAL-style” management generating high values by expanding human resources investment. The strategic schedule targets e-commerce net sales of ¥70.0 billion for the fiscal year ending February 28, 2027 and ¥100.0 billion for the fiscal year ending February 28, 2030, alongside PAL App membership of 14 million for the fiscal year ending February 28, 2026 and 20 million for the fiscal year ending February 28, 2029.
On capital efficiency, the materials present cost of capital estimates based on the CAPM model. Because the stock beta in relation to TOPIX temporarily indicated almost no correlation following the stock split, the company provisionally adopted a beta of 0.68 applicable to the retail industry rather than the calculated figure. On that basis, cost of capital is 5.86% and WACC 5.63%, against an actual ROE of 22.9%, which the company describes as maintaining an extremely high equity spread of over 17%.
Topics disclosed alongside the results include the introduction of an In-house Company System at PAL CO., LTD. in March 2026, reorganizing the Apparel Business into “PAL Company” and the 3COINS Business into “3COINS Company,” with the aim of spinning the latter off into a wholly owned subsidiary of PAL GROUP Holdings in three years. The company also opened its second 3COINS location in Hong Kong, 3COINS Metroplaza, on February 6, 2026, and plans a third location at Air Side. On human capital, PAL CO., LTD. reported 391 new employee hires in 2026, up 143, following a significant increase in starting salary and wage hikes of ¥66,000 mainly for younger employees; the percentage of female store managers has reached 85% and the percentage of female managers 69%.
This article is an analysis based on publicly available information and is not a recommendation to buy or sell any specific securities. Investment decisions are your own responsibility.
















