
This article is based on publicly available IR materials and is not a recommendation to buy or sell any specific securities.
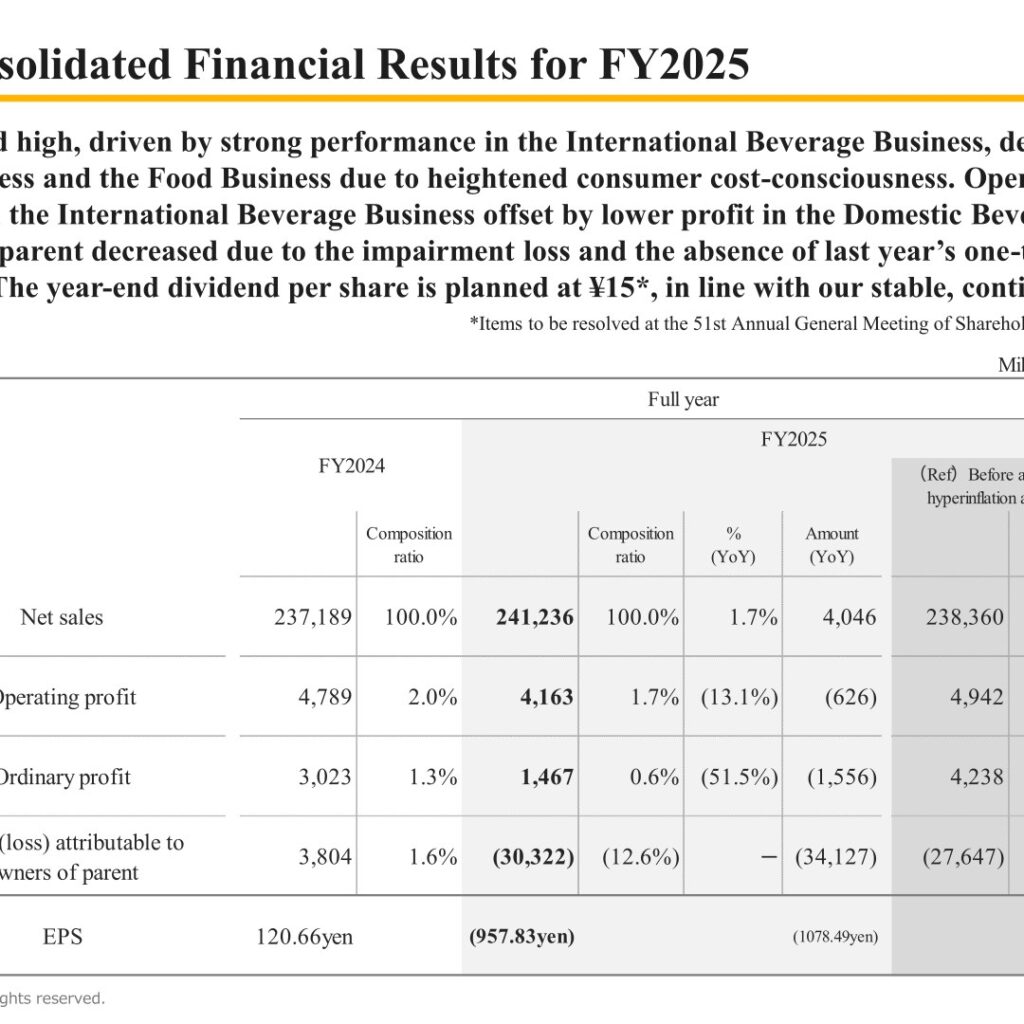
DyDo GROUP HOLDINGS, INC. reported FY2025 (the year ended January 20, 2026) net sales of 241,236 million yen, up 1.7% year on year and a record high, driven by strong performance in the International Beverage Business. Operating profit fell 13.1% to 4,163 million yen, as a decline in the Domestic Beverage Business outweighed record-high profit in the International Beverage Business for the third consecutive year. Profit attributable to owners of parent swung to a loss of 30,322 million yen, mainly reflecting an impairment loss of 29.8 billion recorded in Q4 FY2025 in the Domestic Beverage Business and the absence of last year’s one-time gain from the sale of investment securities. For FY2026 the company forecasts higher sales and a sharp profit recovery, with the annual dividend per share planned at ¥30, unchanged from FY2025.
Consolidated Results (Full-Year Actual)
The figures below are on the hyperinflation accounting basis used in the presentation (IAS 29 adjustments applied to the Turkish subsidiary). The company also discloses reference figures before the application of hyperinflation accounting: net sales of 238,360 million yen, operating profit of 4,942 million yen, ordinary profit of 4,238 million yen and net loss of 27,647 million yen for FY2025, with the stated impact on performance of 2,876, (779), (2,771) and (2,675) million yen respectively.
| Item | FY2024 | FY2025 | % (YoY) | Amount (YoY) |
|---|---|---|---|---|
| Net sales | 237,189 | 241,236 | 1.7% | 4,046 |
| Operating profit | 4,789 | 4,163 | (13.1%) | (626) |
| Ordinary profit | 3,023 | 1,467 | (51.5%) | (1,556) |
| Profit (loss) attributable to owners of parent | 3,804 | (30,322) | ー | (34,127) |
| Composition ratio (net sales) | 100.0% | 100.0% | ||
| Operating profit ratio | 2.0% | 1.7% | ||
| EPS | 120.66yen | (957.83yen) |
Millions of yen. Source: FY2025 (Year Ended January 20, 2026) Financial Highlights, P.9.
Impairment Loss in the Domestic Beverage Business
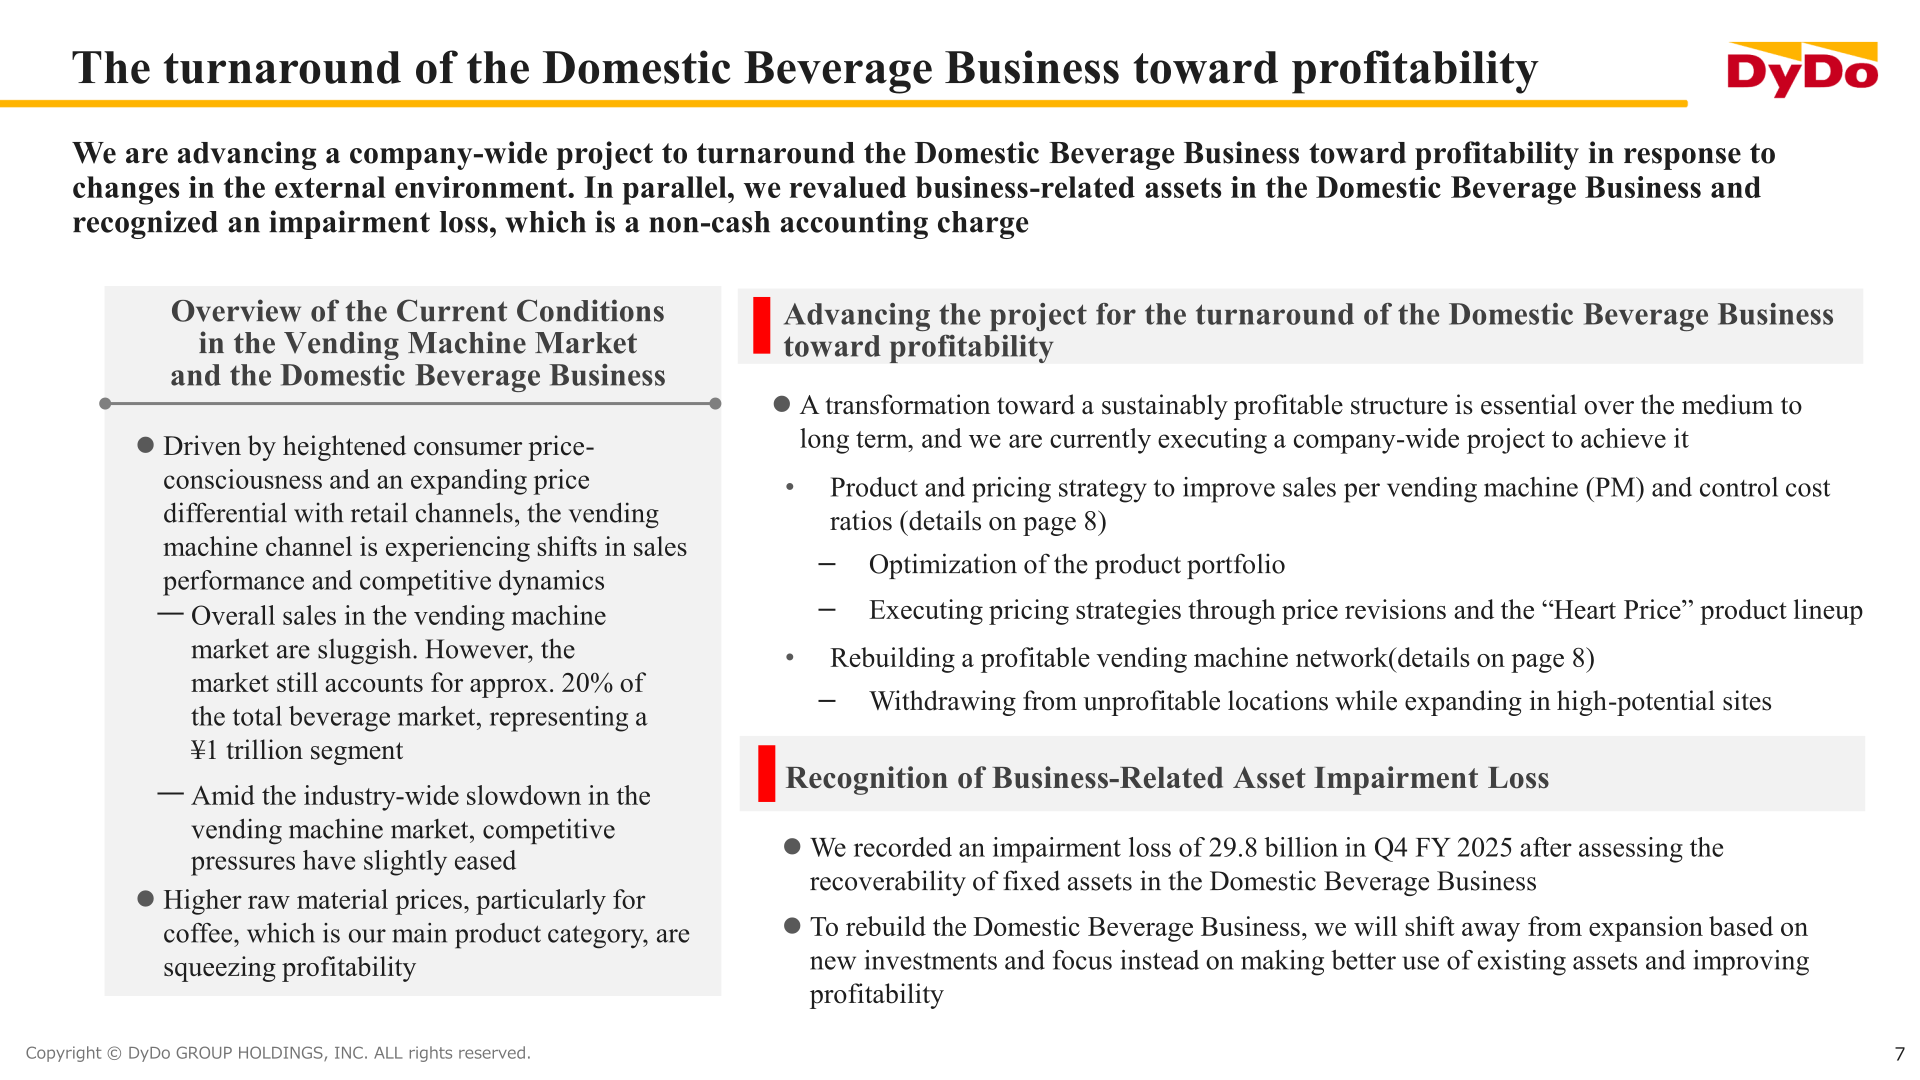
The company states that it is advancing a company-wide project to turn around the Domestic Beverage Business toward profitability in response to changes in the external environment, and that in parallel it revalued business-related assets in the segment and recognized an impairment loss, which it describes as a non-cash accounting charge. The presentation states: “We recorded an impairment loss of 29.8 billion in Q4 FY 2025 after assessing the recoverability of fixed assets in the Domestic Beverage Business.” Due to the recognition of this impairment loss, property, plant and equipment decreased by 25,077 million yen and net assets decreased by 28,611 million yen on the consolidated balance sheet as of January 20, 2026.
Segment Results
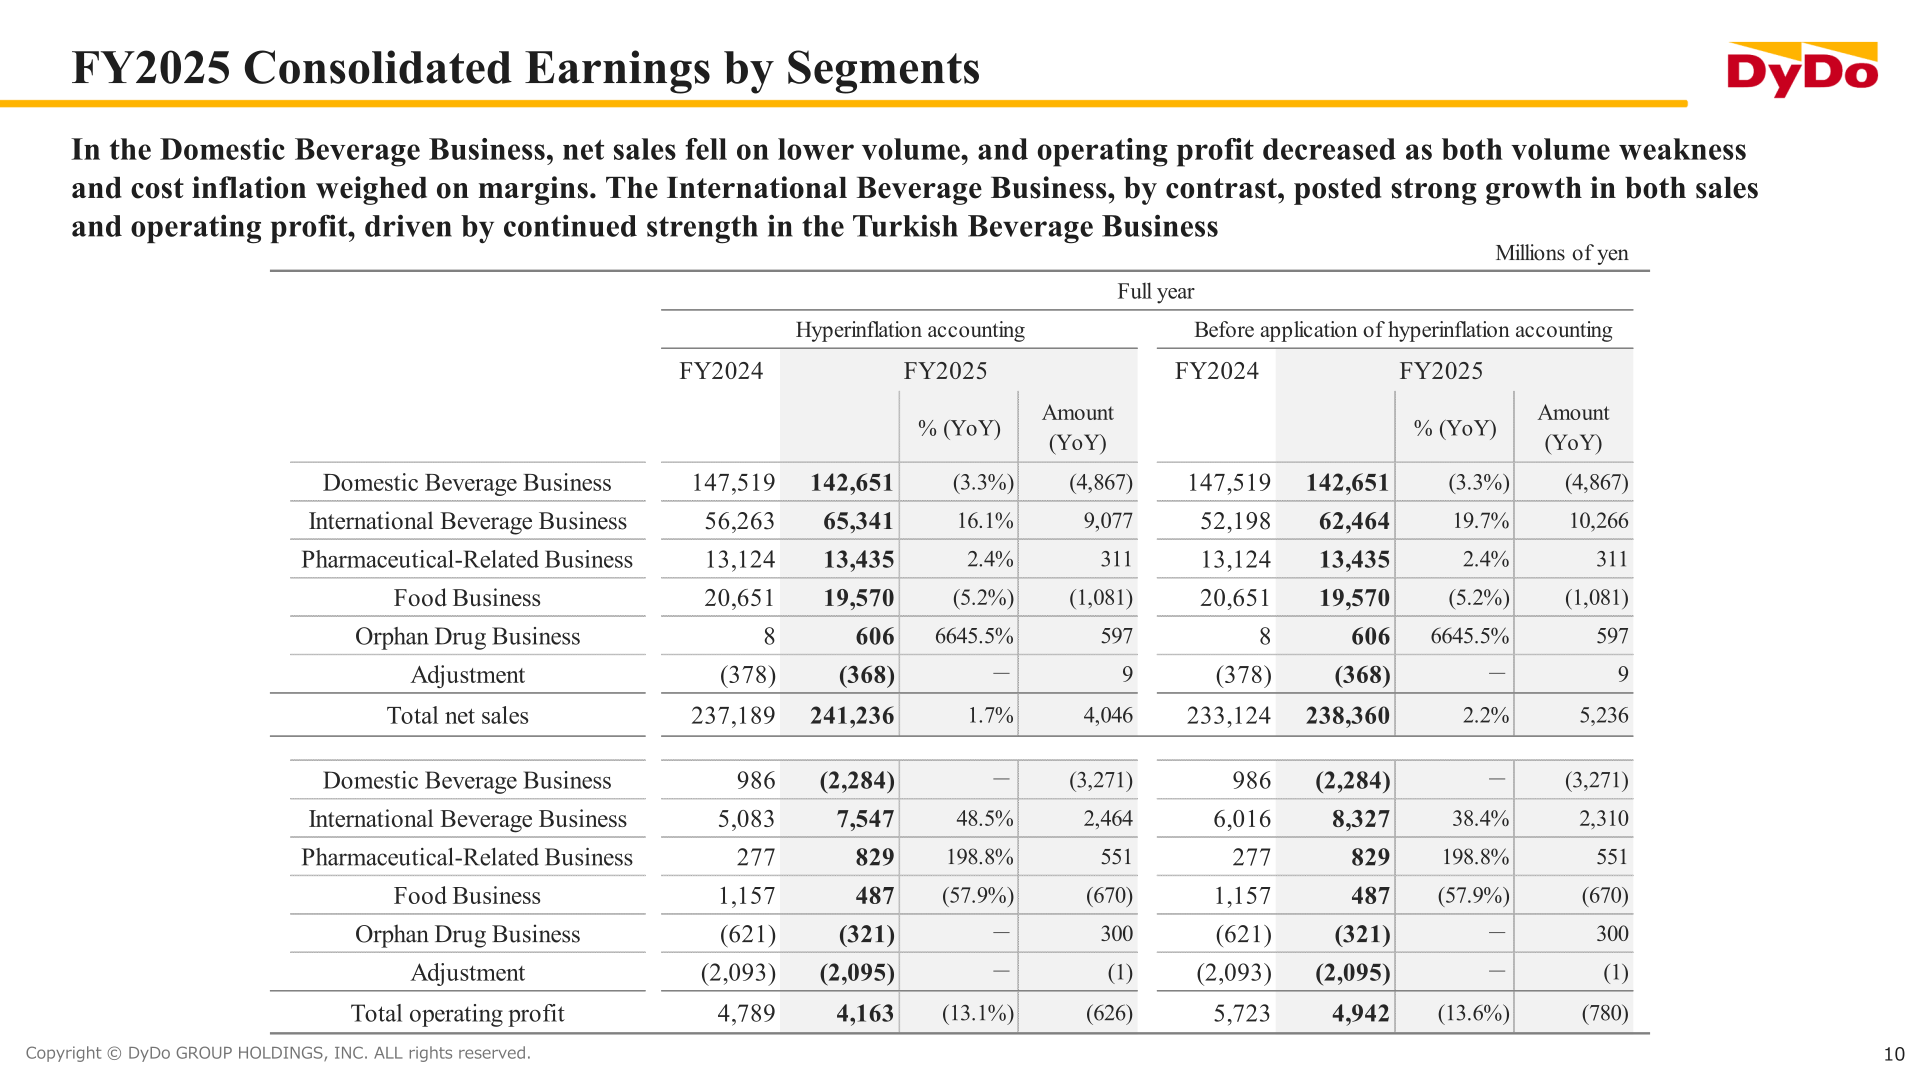
In the Domestic Beverage Business, net sales fell on lower volume and operating profit decreased as both volume weakness and cost inflation weighed on margins. The International Beverage Business posted strong growth in both sales and operating profit, driven by continued strength in the Turkish Beverage Business, where net sales on a local accounting basis rose 48% and sales volume rose 9.4% versus the previous year. The Pharmaceutical-Related Business grew as strong orders for pouch products offset lower demand for health drinks, the Food Business declined on weaker volumes and higher raw material, packaging and labor costs, and the Orphan Drug Business expanded following the January 2025 launch of Firdapse.
| Segment | Metric | FY2024 | FY2025 | % (YoY) | Amount (YoY) |
|---|---|---|---|---|---|
| Domestic Beverage Business | Net sales | 147,519 | 142,651 | (3.3%) | (4,867) |
| International Beverage Business | Net sales | 56,263 | 65,341 | 16.1% | 9,077 |
| Pharmaceutical-Related Business | Net sales | 13,124 | 13,435 | 2.4% | 311 |
| Food Business | Net sales | 20,651 | 19,570 | (5.2%) | (1,081) |
| Orphan Drug Business | Net sales | 8 | 606 | 6645.5% | 597 |
| Adjustment | Net sales | (378) | (368) | - | 9 |
| Total net sales | Net sales | 237,189 | 241,236 | 1.7% | 4,046 |
| Domestic Beverage Business | Operating profit | 986 | (2,284) | - | (3,271) |
| International Beverage Business | Operating profit | 5,083 | 7,547 | 48.5% | 2,464 |
| Pharmaceutical-Related Business | Operating profit | 277 | 829 | 198.8% | 551 |
| Food Business | Operating profit | 1,157 | 487 | (57.9%) | (670) |
| Orphan Drug Business | Operating profit | (621) | (321) | - | 300 |
| Adjustment | Operating profit | (2,093) | (2,095) | - | (1) |
| Total operating profit | Operating profit | 4,789 | 4,163 | (13.1%) | (626) |
Millions of yen, hyperinflation accounting basis. Source: FY2025 (Year Ended January 20, 2026) Financial Highlights, P.10.
FY2026 Forecast
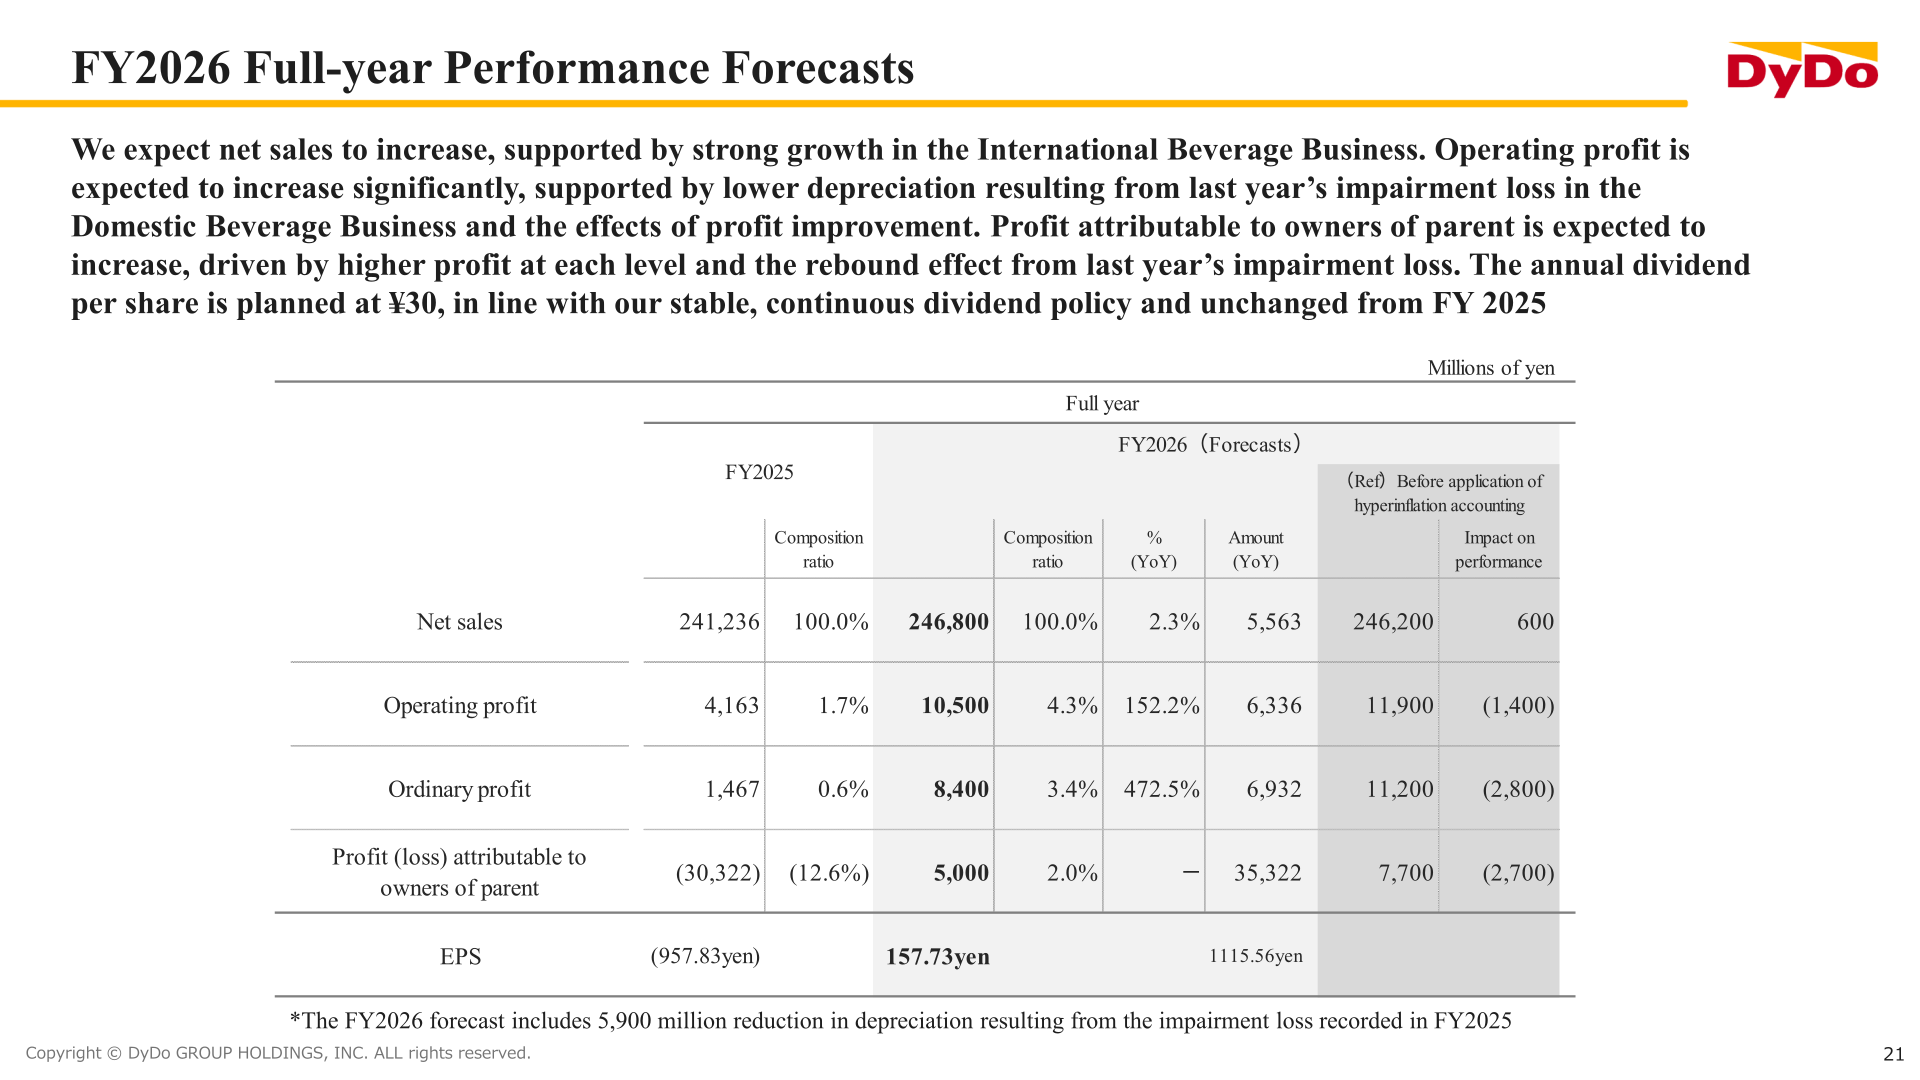
For FY2026 the company expects net sales to increase, supported by strong growth in the International Beverage Business, and operating profit to increase significantly, supported by lower depreciation resulting from last year’s impairment loss in the Domestic Beverage Business and the effects of profit improvement. The company notes that the FY2026 forecast includes a 5,900 million reduction in depreciation resulting from the impairment loss recorded in FY2025.
| Item | FY2025 (Actual) | FY2026 (Forecast) | % (YoY) | Amount (YoY) |
|---|---|---|---|---|
| Net sales | 241,236 | 246,800 | 2.3% | 5,563 |
| Operating profit | 4,163 | 10,500 | 152.2% | 6,336 |
| Ordinary profit | 1,467 | 8,400 | 472.5% | 6,932 |
| Profit (loss) attributable to owners of parent | (30,322) | 5,000 | ー | 35,322 |
| Composition ratio (net sales) | 100.0% | 100.0% | ||
| Operating profit ratio | 1.7% | 4.3% | ||
| EPS | (957.83yen) | 157.73yen |
Millions of yen. Source: FY2025 (Year Ended January 20, 2026) Financial Highlights, P.21.
By segment, the Domestic Beverage Business is expected to post higher profit, supported by lower depreciation resulting from last year’s impairment loss and the effects of profitability improvements, while the International Beverage Business is expected to see higher sales in Turkey and Poland.
| Segment | Metric | FY2025 (Results) | FY2026 (Forecasts) | % (YoY) | Amount (YoY) |
|---|---|---|---|---|---|
| Domestic Beverage Business | Net sales | 142,651 | 141,500 | (0.8%) | (1,151) |
| International Beverage Business | Net sales | 65,341 | 70,000 | 7.1% | 4,658 |
| Pharmaceutical-Related Business | Net sales | 13,435 | 14,100 | 4.9% | 664 |
| Food Business | Net sales | 19,570 | 20,500 | 4.8% | 929 |
| Orphan Drug Business | Net sales | 606 | 900 | 48.3% | 293 |
| Adjustment | Net sales | (368) | (200) | - | 168 |
| Total net sales | Net sales | 241,236 | 246,800 | 2.3% | 5,563 |
| Domestic Beverage Business | Operating profit | (2,284) | 5,200 | - | 7,484 |
| International Beverage Business | Operating profit | 7,547 | 7,800 | 3.3% | 252 |
| Pharmaceutical-Related Business | Operating profit | 829 | 650 | (21.6%) | (179) |
| Food Business | Operating profit | 487 | 350 | (28.1%) | (137) |
| Orphan Drug Business | Operating profit | (321) | (700) | - | (378) |
| Adjustment | Operating profit | (2,095) | (2,800) | - | (704) |
| Total operating profit | Operating profit | 4,163 | 10,500 | 152.2% | 6,336 |
Millions of yen, hyperinflation accounting basis. Source: FY2025 (Year Ended January 20, 2026) Financial Highlights, P.22.
Shareholder Returns
The year-end dividend per share for FY2025 is planned at ¥15, in line with the company’s stable, continuous dividend policy and the initial forecast; the presentation notes this is an item to be resolved at the 51st Annual General Meeting of Shareholders, scheduled for April 15, 2026. For FY2026, the annual dividend per share is planned at ¥30, in line with the same stable, continuous dividend policy and unchanged from FY2025.
Cash Flow
| Item | FY2024 | FY2025 | Amount (YoY) |
|---|---|---|---|
| EBITDA (Operating profit + depreciation costs + amortization of goodwill) | 15,973 | 15,927 | (45) |
| Amount of change in working capital cash flow | (1,883) | 534 | 2,418 |
| Other | (3,265) | (5,052) | (1,787) |
| Operating cash flow (a) | 10,824 | 11,409 | 584 |
| Expenditures related to the acquisition of tangible and intangible fixed assets (b) | (10,799) | (12,693) | (1,894) |
| Free cash flow (a+b) | 25 | (1,283) | (1,309) |
Millions of yen. Source: FY2025 (Year Ended January 20, 2026) Financial Highlights, P.43.
Medium-Term Management Plan 2026
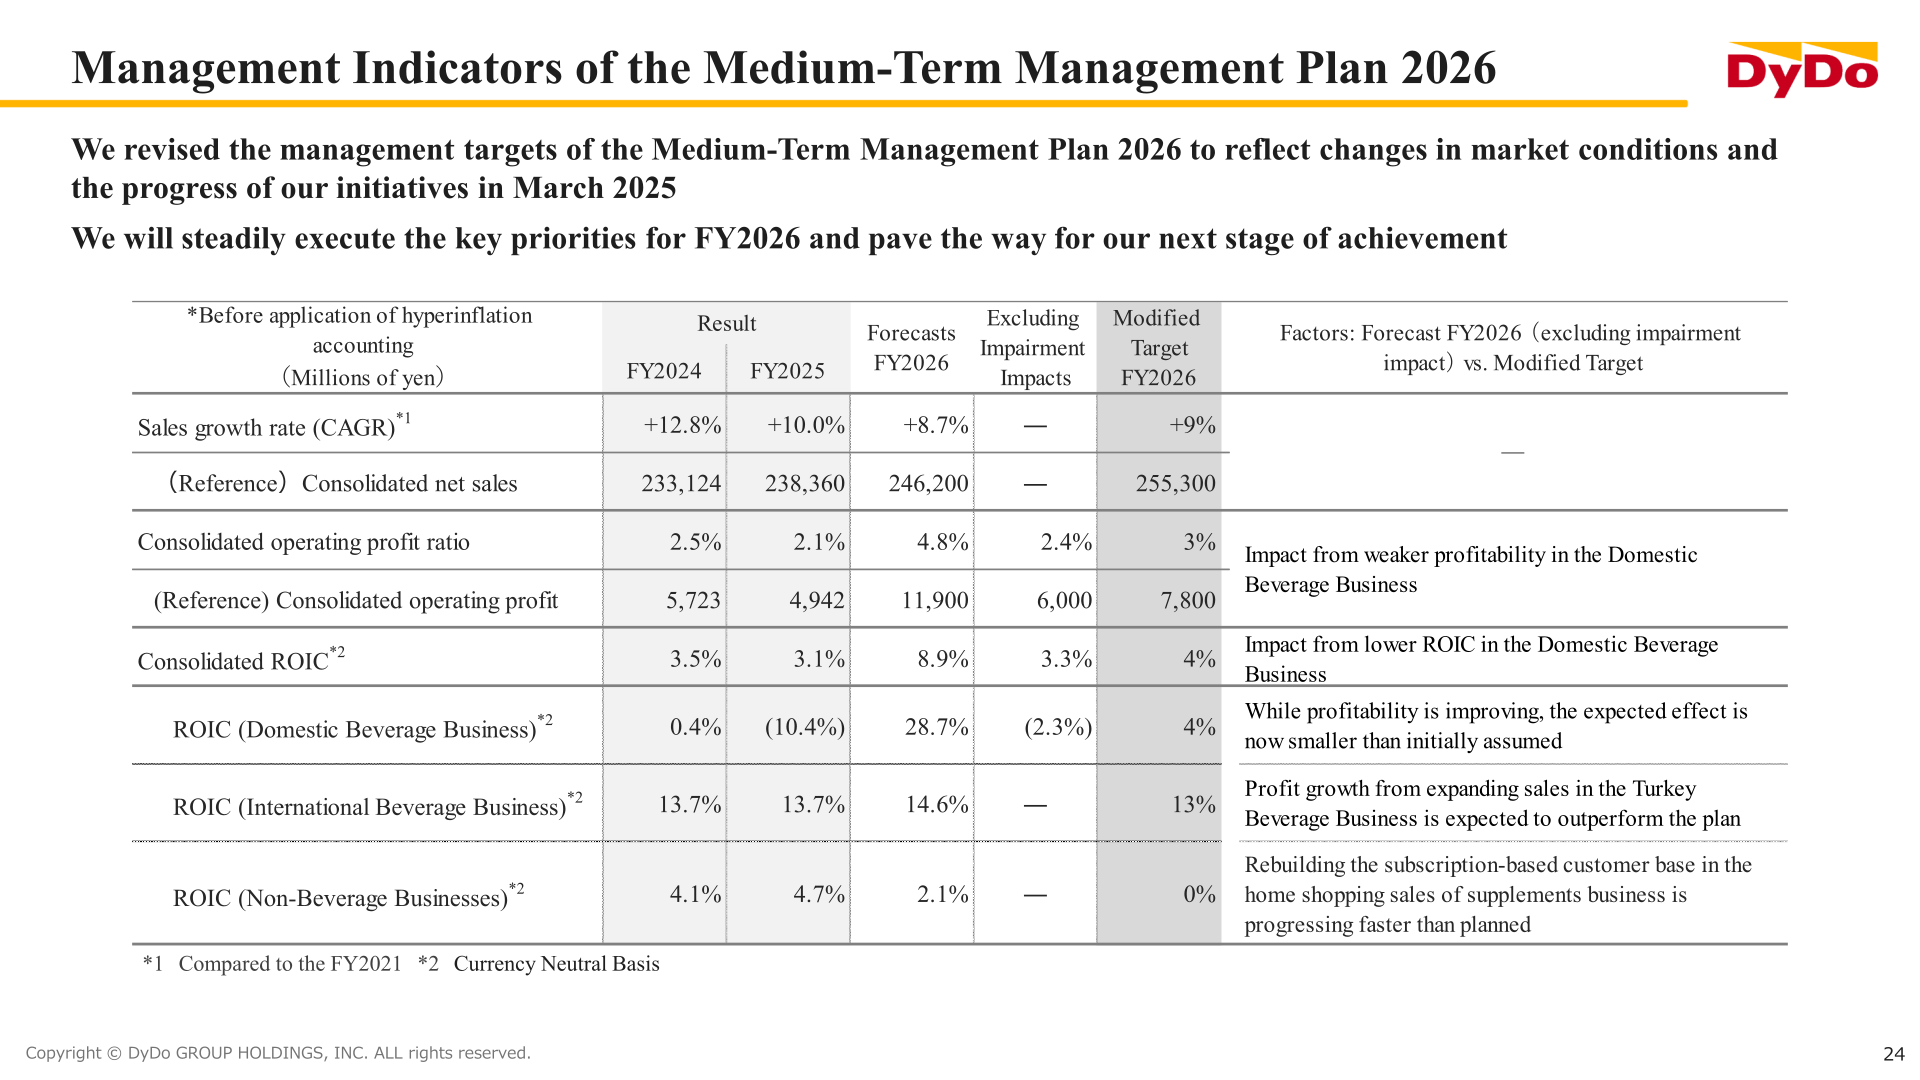
FY2026 is the final year of the Medium-Term Management Plan 2026, whose management targets were revised in March 2025 to reflect changes in market conditions and the progress of the company’s initiatives. The indicators below are stated before the application of hyperinflation accounting; the sales growth rate is a CAGR compared to FY2021 and the ROIC figures are on a currency neutral basis. The company positions the turnaround of the Domestic Beverage Business as its top priority for FY2026, plans to expand carbonated beverage production capacity in Turkey (existing capacity +80%, start-up planned for the early phase of the next Medium-Term Management Plan starting in FY2027) and water production capacity in Poland (existing capacity +100%, operations scheduled to start in May 2026), and has begun discussions on the future business portfolio as part of formulating the next Medium-Term Management Plan covering FY2027 to FY2029.
| Indicator | FY2024 (Result) | FY2025 (Result) | FY2026 (Forecasts) | Excluding Impairment Impacts | Modified Target FY2026 |
|---|---|---|---|---|---|
| Sales growth rate (CAGR) | +12.8% | +10.0% | +8.7% | ― | +9% |
| (Reference) Consolidated net sales | 233,124 | 238,360 | 246,200 | ― | 255,300 |
| Consolidated operating profit ratio | 2.5% | 2.1% | 4.8% | 2.4% | 3% |
| (Reference) Consolidated operating profit | 5,723 | 4,942 | 11,900 | 6,000 | 7,800 |
| Consolidated ROIC | 3.5% | 3.1% | 8.9% | 3.3% | 4% |
| ROIC (Domestic Beverage Business) | 0.4% | (10.4%) | 28.7% | (2.3%) | 4% |
| ROIC (International Beverage Business) | 13.7% | 13.7% | 14.6% | ― | 13% |
| ROIC (Non-Beverage Businesses) | 4.1% | 4.7% | 2.1% | ― | 0% |
Millions of yen where applicable. Source: FY2025 (Year Ended January 20, 2026) Financial Highlights, P.24.
This article is an analysis based on publicly available information and is not a recommendation to buy or sell any specific securities. Investment decisions are your own responsibility.
















