
This article is based on publicly available IR materials and is not a recommendation to buy or sell any specific securities.
Note: Takamiya labels the fiscal year ended March 31, 2026 as “FY2026” in its results materials, while this site classifies the most recently completed full year as FY2025; the labels used in the text, tables and segment data below follow the company’s materials.
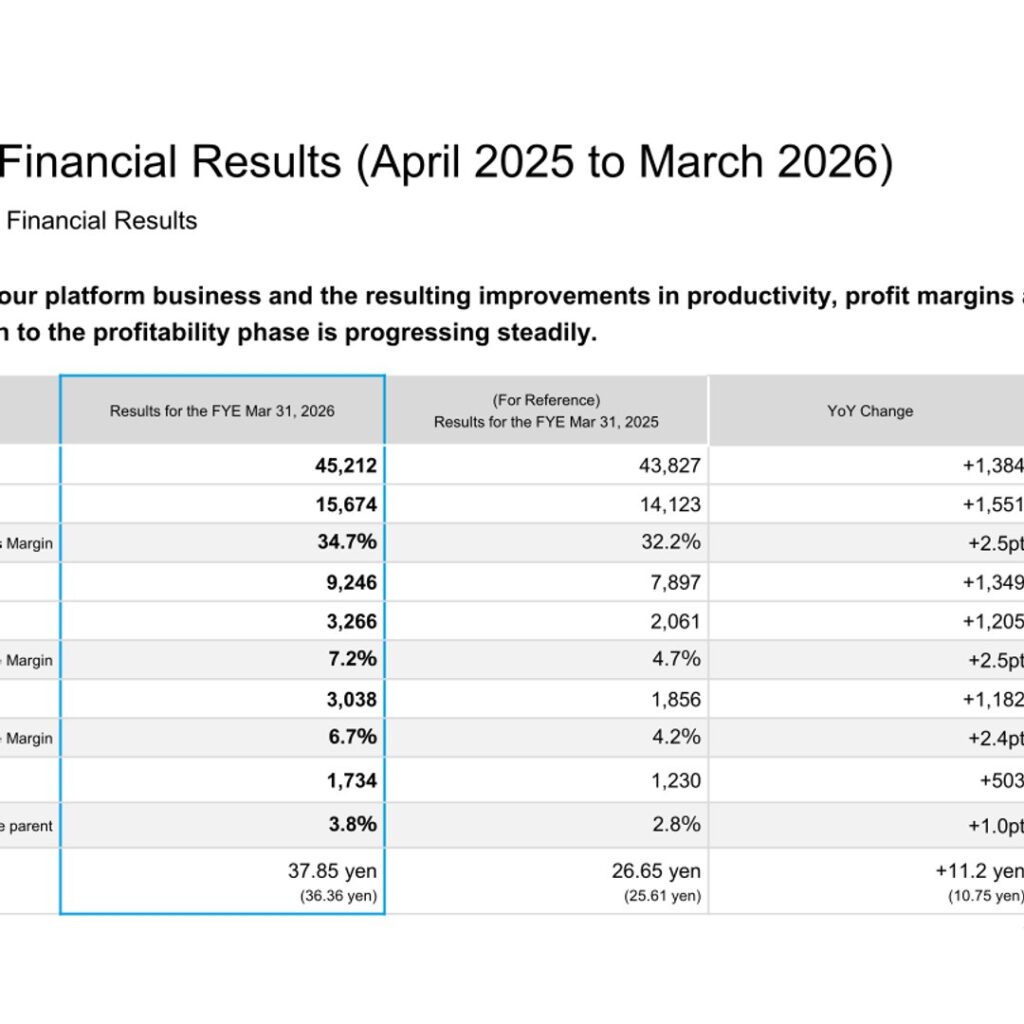
Takamiya Co., Ltd. reported net sales of 45,212 million yen for the fiscal year ended March 31, 2026, up 1,384 million yen or 3.2% year on year, with operating income of 3,266 million yen, up 1,205 million yen or 58.5%. The company states that the expansion of its platform business and the resulting improvements in productivity lifted profit margins at each stage, and that its transition to the profitability phase is progressing steadily. Ordinary income rose 63.7% to 3,038 million yen and profit attributable to owners of the parent rose 40.9% to 1,734 million yen. Against the earnings forecast, net sales reached an achievement rate of 93.9% while operating income, ordinary income and profit attributable to owners of parent came in at 111.1%, 125.7% and 115.0% of forecast respectively.
Consolidated Results (Full-Year Actual)
Gross profit increased 11.0% to 15,674 million yen and the gross margin improved 2.5 points to 34.7%, while the operating income margin also improved 2.5 points to 7.2%. The company attributes the improvement to the growth of the platform business and the growing impact of its DX initiatives. EBITDA rose 17.0% to 9,246 million yen. Earnings per share were 37.85 yen (diluted 36.36 yen) against 26.65 yen (diluted 25.61 yen) a year earlier. Figures are in millions of yen unless otherwise noted.
| Item | Results for the FYE Mar 31, 2026 | Results for the FYE Mar 31, 2025 | YoY Change | YoY Growth Rate |
|---|---|---|---|---|
| Net Sales | 45,212 | 43,827 | +1,384 | +3.2% |
| Gross Profit | 15,674 | 14,123 | +1,551 | +11.0% |
| Gross Margin | 34.7% | 32.2% | +2.5pt | – |
| EBITDA | 9,246 | 7,897 | +1,349 | +17.0% |
| Operating Income | 3,266 | 2,061 | +1,205 | +58.5% |
| Operating Income Margin | 7.2% | 4.7% | +2.5pt | – |
| Ordinary Income | 3,038 | 1,856 | +1,182 | +63.7% |
| Ordinary Income Margin | 6.7% | 4.2% | +2.4pt | – |
| Profit Attributable to Owners of the Parent | 1,734 | 1,230 | +503 | +40.9% |
| Profit margin attributable to owners of the parent | 3.8% | 2.8% | +1.0pt | – |
| Earnings per Share (EPS) | 37.85 yen | 26.65 yen | +11.2 yen | – |
| (Diluted earnings per share) | (36.36 yen) | (25.61 yen) | (10.75 yen) | – |
On the balance sheet, total assets stood at 74,599 million yen, a decrease of 731 million yen from the previous fiscal year-end, with inventories down 1,956 million yen to 7,391 million yen and cash and deposits up 927 million yen to 9,772 million yen. Net assets rose 1,118 million yen to 23,701 million yen. Net cash provided by operating activities was 4,735 million yen against an outflow of 585 million yen a year earlier, and free cash flow turned positive at +3,789 million yen versus (5,127) million yen in the previous fiscal year, which the company describes as the first positive free cash flow in three years and a transition to the investment recovery phase.
Segment Results
The newly established platform business segment delivered growth in both revenue and profit, while the rental business achieved a significant increase in profit driven by the revision of rental rates. In the platform business, increased awareness of the benefits of the OPE-MANE service led to higher recurring revenue through growth in additional contracts and greater usage of ancillary services. The sales business saw higher revenue from temporary construction equipment as procurement methods shift toward OPE-MANE and rental, with used products and environment-related sectors exceeding the previous year. The rental business maintained high utilization rates through the period-end, helped by Hokkaido Shinkansen-related projects, and gross profit margin improved on unit price revisions. The overseas business declined as internal sales fell on restrained rental asset investment and external sales decreased on sluggish construction investment in South Korea.
| Segment | Metric | FY2026 | FY2025 | YoY |
|---|---|---|---|---|
| Platform | Segment Sales | 6,788 | 5,184 | +30.9 % |
| Platform | Segment Operating Income (margin) | 1,655 (24.4 %) | 1,205 (23.2 %) | +37.4 % |
| Sales | Segment Sales | 10,126 | 9,313 | +8.7 % |
| Sales | Segment Operating Income (margin) | 464 (4.6 %) | 270 (2.9 %) | +71.7 % |
| Rental | Segment Sales | 27,185 | 27,087 | +0.4 % |
| Rental | Segment Operating Income (margin) | 4,234 (15.6 %) | 3,214 (11.9 %) | +31.7 % |
| overseas | Segment Sales | 4,741 | 6,868 | (31.0 %) |
| overseas | Segment Operating Income (margin) | (98) ((2.1 %)) | 347 (5.1 %) | – |
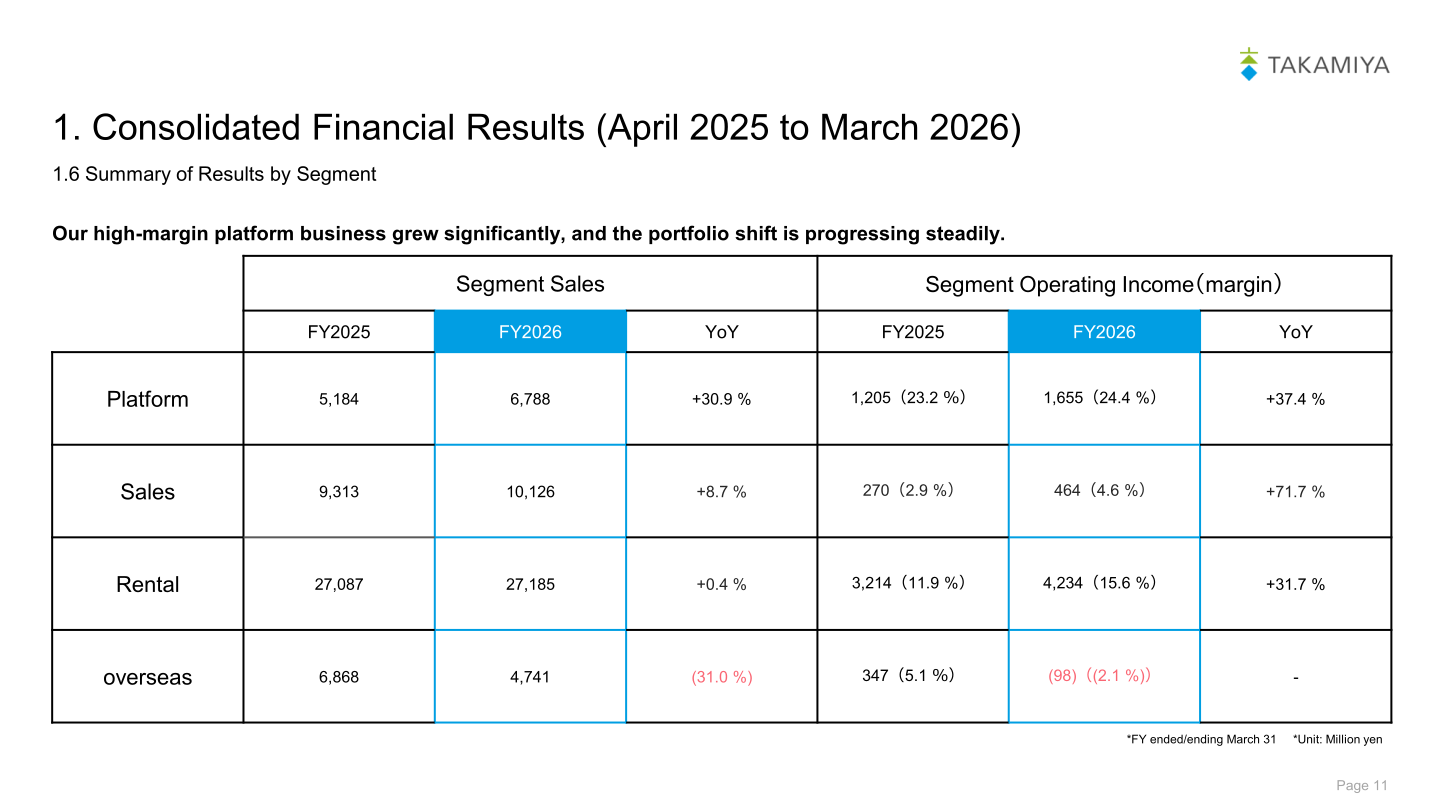
On the platform business KPIs, the cumulative number of OPE-MANE accounts reached 156 companies. Against a KPI of an increase of 90 accounts for the fiscal year ended March 2026, the actual increase was 42 accounts, an achievement rate of 46.6%. Cumulative OPE-MANE contract sales reached 7,518 million yen, with actual contract sales for the year of 2,343 million yen against a KPI plan of 3,800 million yen, an achievement rate of 61.6%. The company notes that although KPIs fell short of targets, recurring revenue generated in proportion to the increase in accounts and contract sales exceeded expectations; recurring revenue (rental-related sales) in the platform business totaled 4,441 million yen in FY2026 against 2,823 million yen in FY2025.
Full-Year Forecast for the Fiscal Year Ending March 31, 2027
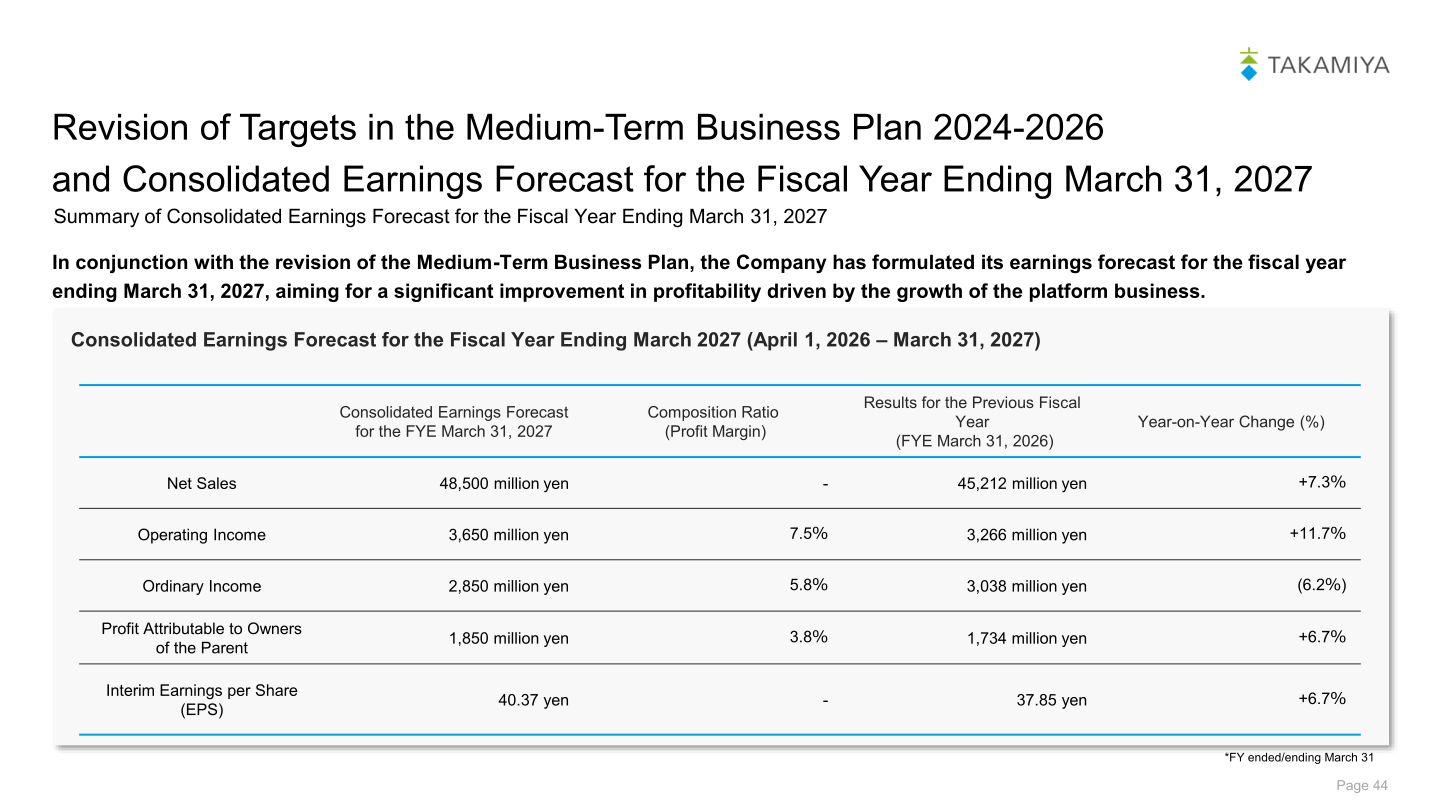
In conjunction with the revision of its Medium-Term Business Plan, the company formulated an earnings forecast for the fiscal year ending March 31, 2027 (April 1, 2026 to March 31, 2027), aiming for a significant improvement in profitability driven by the growth of the platform business. Net sales are forecast at 48,500 million yen and operating income at 3,650 million yen, while ordinary income is forecast to decline to 2,850 million yen.
| Item | Consolidated Earnings Forecast for the FYE March 31, 2027 | Composition Ratio (Profit Margin) | Results for the Previous Fiscal Year (FYE March 31, 2026) | Year-on-Year Change (%) |
|---|---|---|---|---|
| Net Sales | 48,500 million yen | – | 45,212 million yen | +7.3% |
| Operating Income | 3,650 million yen | 7.5% | 3,266 million yen | +11.7% |
| Ordinary Income | 2,850 million yen | 5.8% | 3,038 million yen | (6.2%) |
| Profit Attributable to Owners of the Parent | 1,850 million yen | 3.8% | 1,734 million yen | +6.7% |
| Interim Earnings per Share (EPS) | 40.37 yen | – | 37.85 yen | +6.7% |
By segment, the revised plan for the fiscal year ending March 2027 sets platform business sales at 8,710 million yen (plan before revision: 9,800 million yen), sales business at 8,440 million yen (11,170 million yen), rental business at 27,945 million yen (28,380 million yen) and overseas business at 6,267 million yen (8,050 million yen). For investment, the company plans 4,150 million yen in rental assets and 6,350 million yen in capital investment for the fiscal year ending March 2027, against results of 1,534 million yen and 4,580 million yen respectively in the year under review, with depreciation expense planned at 6,320 million yen versus 5,980 million yen.
Shareholder Returns
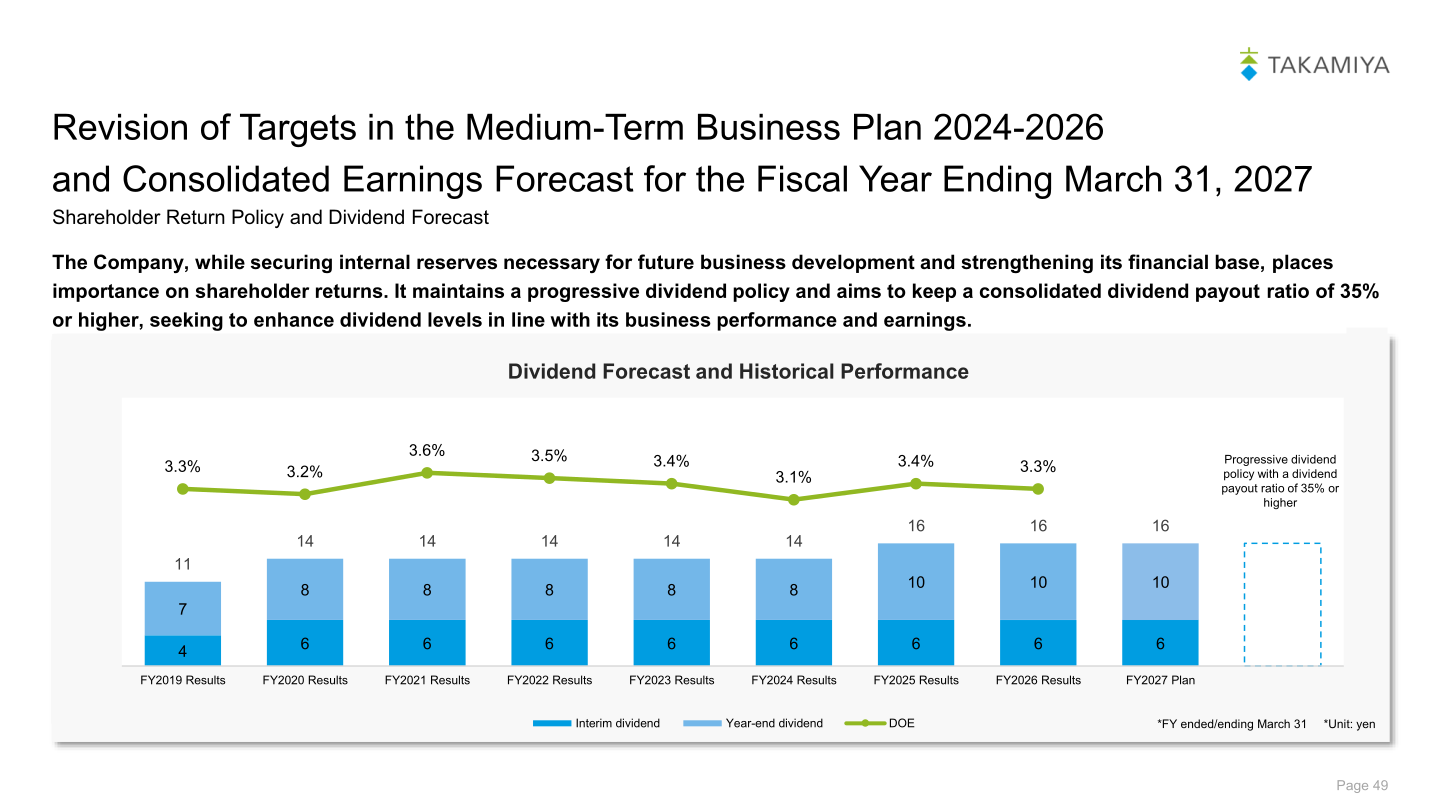
The company states that while securing internal reserves necessary for future business development and strengthening its financial base, it places importance on shareholder returns, maintaining a progressive dividend policy and aiming to keep a consolidated dividend payout ratio of 35% or higher. The dividend for the fiscal year ended March 31, 2026 is 16 yen per year, consisting of an interim dividend of 6 yen and a year-end dividend of 10 yen, and the dividend forecast for the fiscal year ending March 31, 2027 is also 16 yen (interim 6 yen, year-end 10 yen). The total dividend amount was 745 million yen with a payout ratio of 42.3%; there were no share buybacks in the year under review, against 362 million yen in the previous fiscal year.
| Item | FY2025 | FY2026 |
|---|---|---|
| Total dividend amount | 745 million yen | 745 million yen |
| Dividend per share (interim + year-end) | 16 yen (6 + 10) | 16 yen (6 + 10) |
| Payout ratio | 60.0% | 42.3% |
| Share buyback | 362 million yen | 0 million yen |
| Total return ratio | 89.9% | 42.3% |
| Equity dividend ratio | 3.4% | 3.3% |
| ROE | 5.7% | 7.7% |
Medium-Term Business Plan and Topics
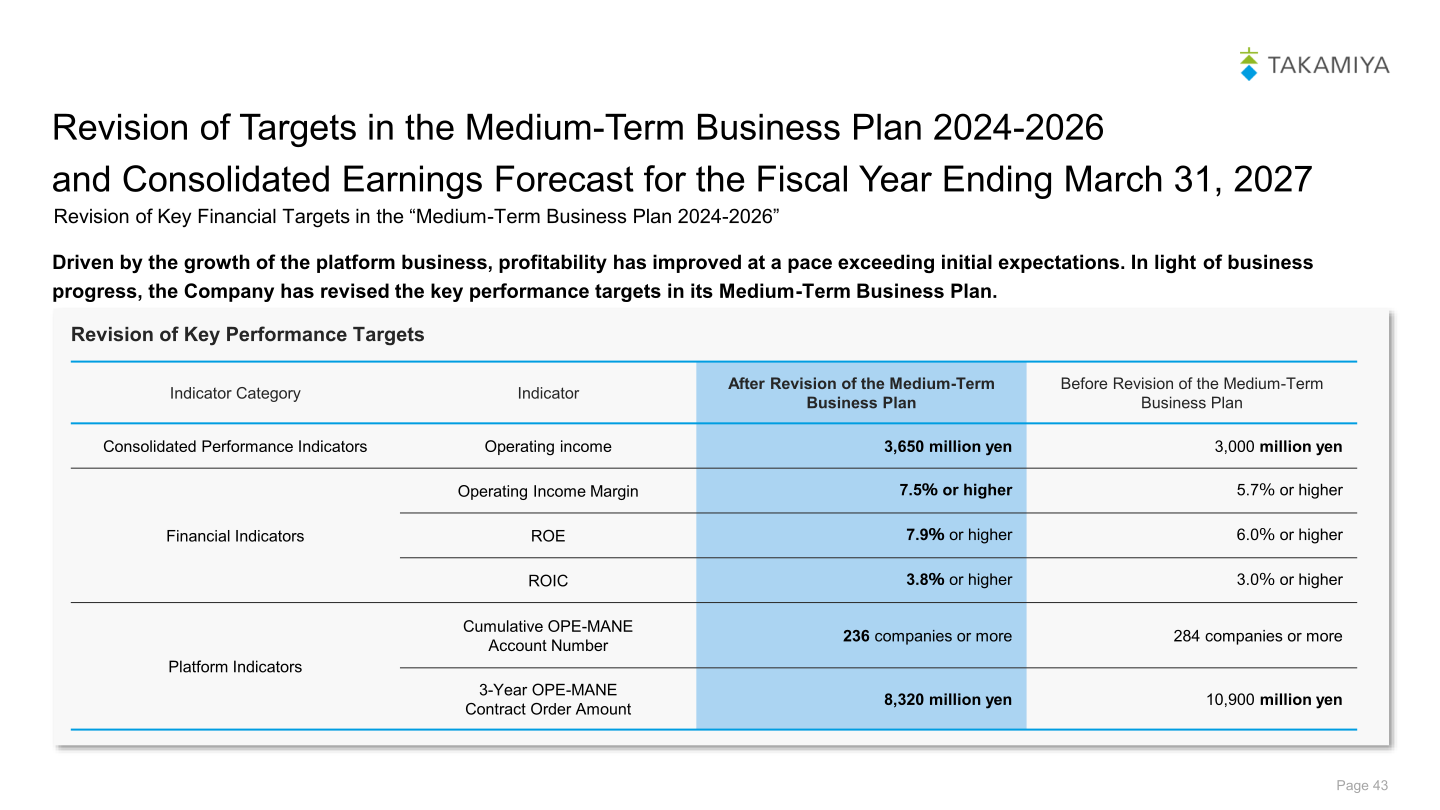
In light of changes in the business environment and the current progress of its operations, the company revised the numerical targets for the final fiscal year of its Medium-Term Business Plan 2024-2026, stating that there are no changes to its management vision, basic policies or key strategies. Operating income for the final year was revised up to 3,650 million yen from 3,000 million yen, the operating income margin target to 7.5% or higher from 5.7% or higher, ROE to 7.9% or higher from 6.0% or higher, and ROIC to 3.8% or higher from 3.0% or higher. The platform indicators were revised down: the cumulative number of OPE-MANE accounts to 236 companies or more from 284 companies or more, and the three-year OPE-MANE contract order amount to 8,320 million yen from 10,900 million yen.
On the Iq System de facto standardization strategy, the total cumulative adoption area reached 13.50 million square meters for a scaffolding market share of 11.9%, against a critical mass point of 16 million square meters; the company states that the remaining adoption area is 2.50 million square meters and that the average annual increase in adoption area over the past five years is 1.252 million square meters. Cumulative Iq System sales amount to 34.5 billion yen and the cumulative number of companies sold to is 650. Among topics, on March 23, 2026 the company announced approval for a market segment change to the Tokyo Stock Exchange Standard Market and the withdrawal of its plan to comply with the Prime Market listing maintenance criteria.
This article is an analysis based on publicly available information and is not a recommendation to buy or sell any specific securities. Investment decisions are your own responsibility.
















