
This article is based on publicly available IR materials and is not a recommendation to buy or sell any specific securities.
Morinaga & Co., Ltd. reported net sales of 236.6 billion yen and operating income of 22.3 billion yen for FY2025, the fiscal year ended March 31, 2026, which the company describes as new record highs for the fifth and second consecutive period respectively. Profit at all levels increased year on year, with ordinary income of 22.6 billion yen and profit attributable to owners of parent of 17.7 billion yen. For FY2026 the company forecasts net sales of 257.0 billion yen and operating income of 22.8 billion yen, absorbing the short-term profit and loss impact of responding to the external environment and of growth investments including M&A. The dividend per share for FY2025 was raised by ¥5 to ¥65, and a further increase of ¥5 to ¥70 is projected for FY2026.
Consolidated Results (Full-Year Actual)
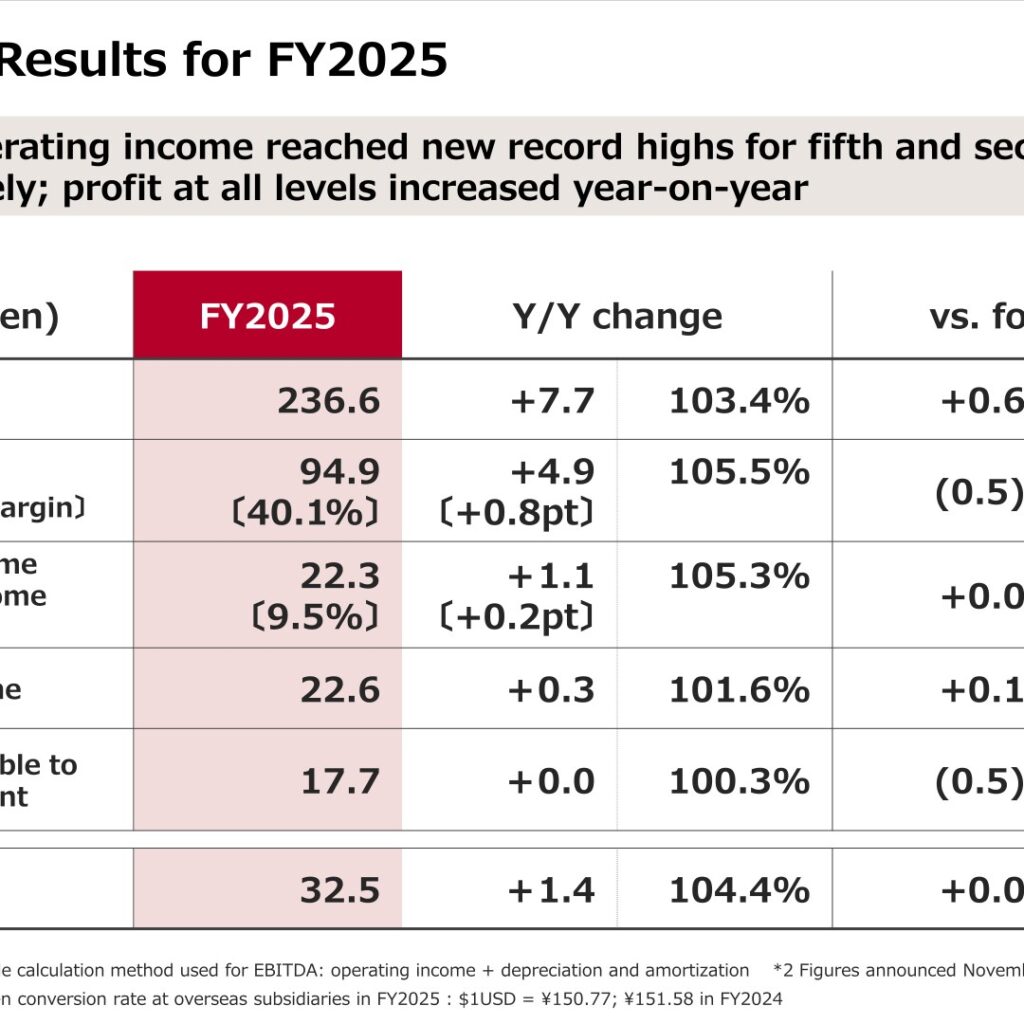
Net sales rose +7.7 to 236.6 billion yen (103.4% year on year) and came in +0.6 above the forecast announced in November 2025. Gross profit was 94.9 billion yen with a gross profit margin of 40.1%, up +0.8pt, while operating income increased +1.1 to 22.3 billion yen for an operating income margin of 9.5%, up +0.2pt. EBITDA, which the company calculates simply as operating income plus depreciation and amortization, was 32.5 billion yen (104.4%). The company attributes the increase in operating income to price revisions and sales growth offsetting soaring raw material costs, especially for cacao, together with higher labor costs and DX investment. Consolidated advertising expenses were ¥10.81 billion in FY2025 against ¥11.24 billion in FY2024, a profit and loss impact of +¥0.43 billion. The yen conversion rate at overseas subsidiaries was $1USD = ¥150.77 in FY2025 versus ¥151.58 in FY2024.
| Item | FY2025 | Y/Y change | Y/Y (%) | vs. forecast | vs. forecast (%) |
|---|---|---|---|---|---|
| Net sales | 236.6 | +7.7 | 103.4% | +0.6 | 100.3% |
| Gross profit 〔gross profit margin〕 | 94.9 〔40.1%〕 | +4.9 〔+0.8pt〕 | 105.5% | (0.5) | 99.5% |
| Operating income 〔operating income margin〕 | 22.3 〔9.5%〕 | +1.1 〔+0.2pt〕 | 105.3% | +0.0 | 100.4% |
| Ordinary income | 22.6 | +0.3 | 101.6% | +0.1 | 100.7% |
| Profit attributable to owners of parent | 17.7 | +0.0 | 100.3% | (0.5) | 97.6% |
| EBITDA | 32.5 | +1.4 | 104.4% | +0.0 | 100.1% |
Segment Results
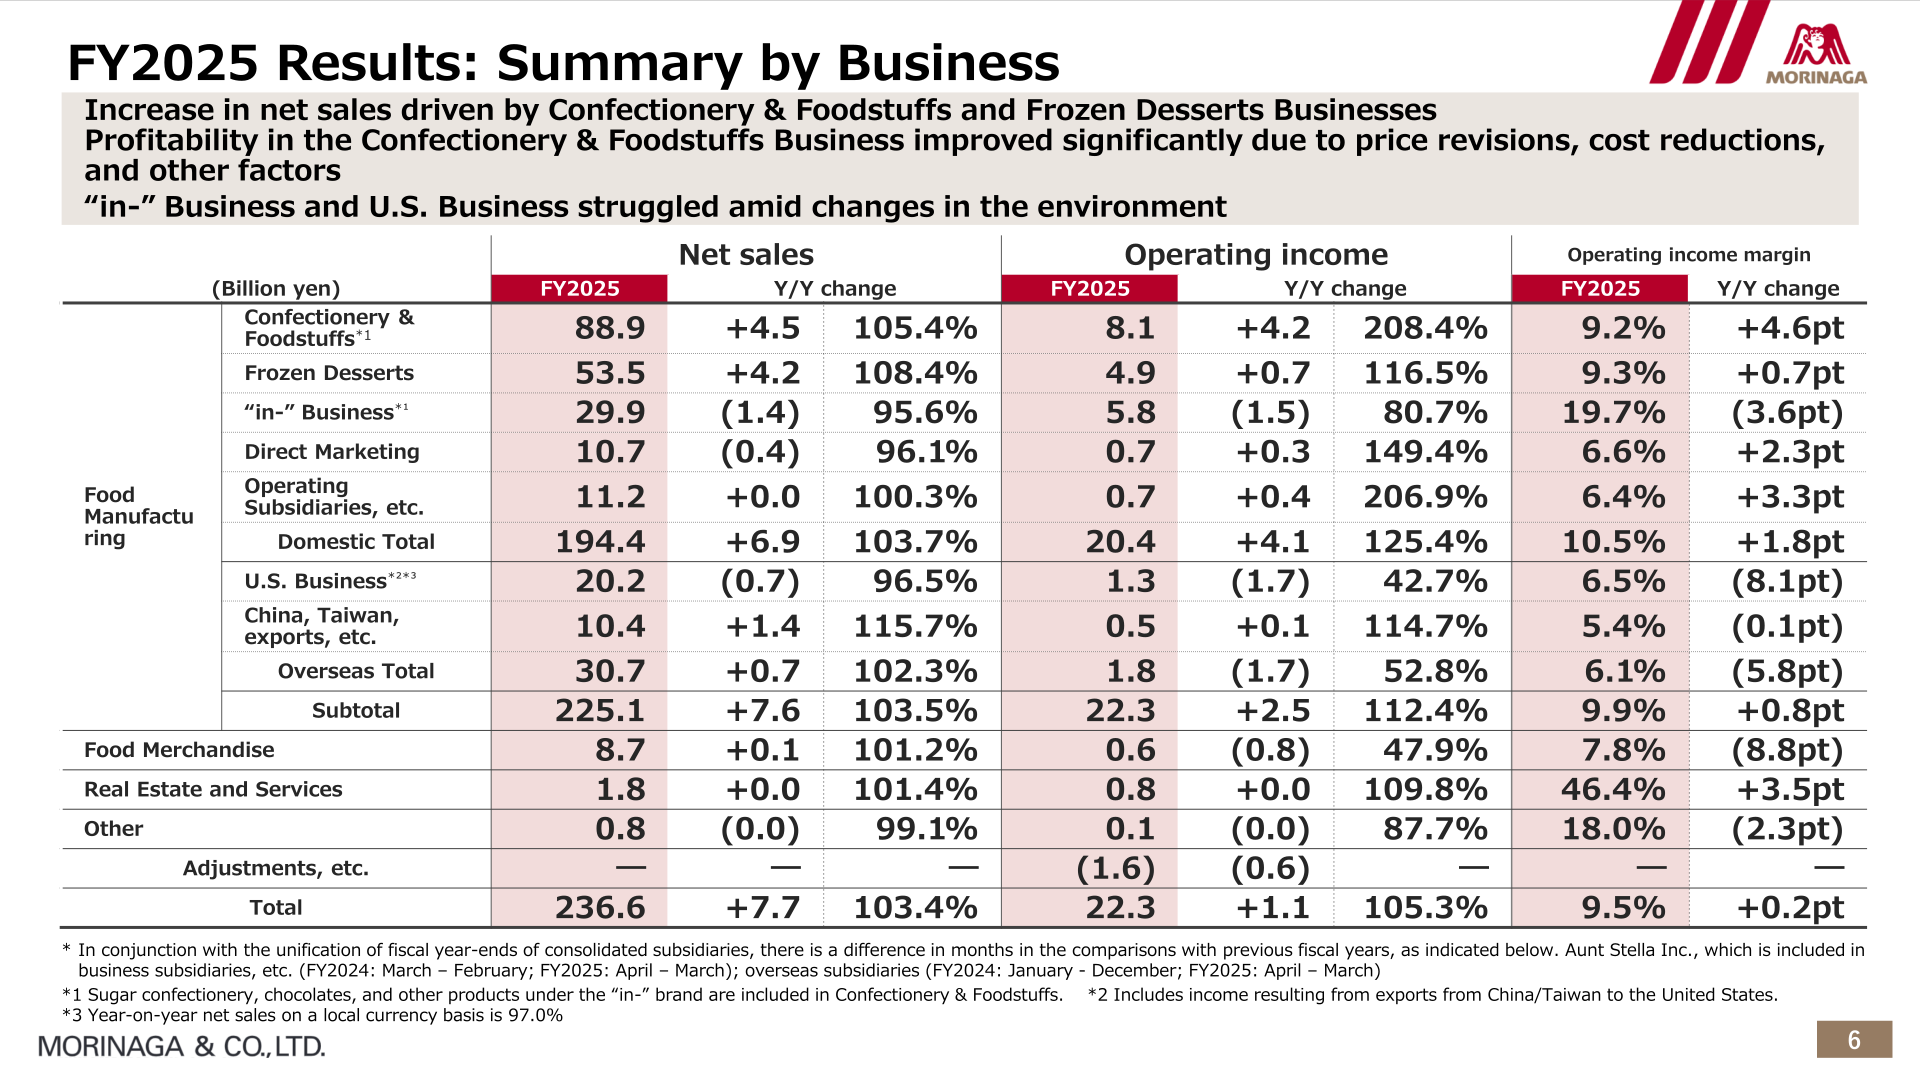
Growth in net sales was driven by the Confectionery & Foodstuffs and Frozen Desserts Businesses. Confectionery & Foodstuffs net sales rose to 88.9 billion yen (105.4%) and operating income more than doubled to 8.1 billion yen (208.4%), lifting the segment margin +4.6pt to 9.2% on price revisions and cost reductions. Frozen Desserts net sales were 53.5 billion yen (108.4%) with operating income of 4.9 billion yen (116.5%). By contrast, the “in-” Business posted net sales of 29.9 billion yen (95.6%) and operating income of 5.8 billion yen (80.7%), and the U.S. Business recorded net sales of 20.2 billion yen (96.5%) and operating income of 1.3 billion yen (42.7%). Domestic Total net sales were 194.4 billion yen (103.7%) with operating income of 20.4 billion yen (125.4%), while Overseas Total net sales were 30.7 billion yen (102.3%) with operating income of 1.8 billion yen (52.8%). On a local currency basis the U.S. Business recorded net sales of 97.0% and operating income of 43.0% when FY2025 (April–March) is compared with FY2024 (January–December), and 98.7% and 67.8% respectively when compared with FY2024 on an April–March basis. In conjunction with the unification of fiscal year-ends of consolidated subsidiaries there is a difference in months in the comparisons with previous fiscal years: Aunt Stella Inc. moved from March–February in FY2024 to April–March in FY2025, and overseas subsidiaries from January–December to April–March.
| Segment | Net sales (FY2025) | Net sales Y/Y | Operating income (FY2025) | Operating income Y/Y | Operating income margin (FY2025) | Margin Y/Y change |
|---|---|---|---|---|---|---|
| Confectionery & Foodstuffs | 88.9 | 105.4% | 8.1 | 208.4% | 9.2% | +4.6pt |
| Frozen Desserts | 53.5 | 108.4% | 4.9 | 116.5% | 9.3% | +0.7pt |
| “in-” Business | 29.9 | 95.6% | 5.8 | 80.7% | 19.7% | (3.6pt) |
| Direct Marketing | 10.7 | 96.1% | 0.7 | 149.4% | 6.6% | +2.3pt |
| Operating Subsidiaries, etc. | 11.2 | 100.3% | 0.7 | 206.9% | 6.4% | +3.3pt |
| Domestic Total | 194.4 | 103.7% | 20.4 | 125.4% | 10.5% | +1.8pt |
| U.S. Business | 20.2 | 96.5% | 1.3 | 42.7% | 6.5% | (8.1pt) |
| China, Taiwan, exports, etc. | 10.4 | 115.7% | 0.5 | 114.7% | 5.4% | (0.1pt) |
| Overseas Total | 30.7 | 102.3% | 1.8 | 52.8% | 6.1% | (5.8pt) |
| Subtotal | 225.1 | 103.5% | 22.3 | 112.4% | 9.9% | +0.8pt |
| Food Merchandise | 8.7 | 101.2% | 0.6 | 47.9% | 7.8% | (8.8pt) |
| Real Estate and Services | 1.8 | 101.4% | 0.8 | 109.8% | 46.4% | +3.5pt |
| Other | 0.8 | 99.1% | 0.1 | 87.7% | 18.0% | (2.3pt) |
| Adjustments, etc. | ― | ― | (1.6) | ― | ― | ― |
| Total | 236.6 | 103.4% | 22.3 | 105.3% | 9.5% | +0.2pt |
FY2026 Forecast
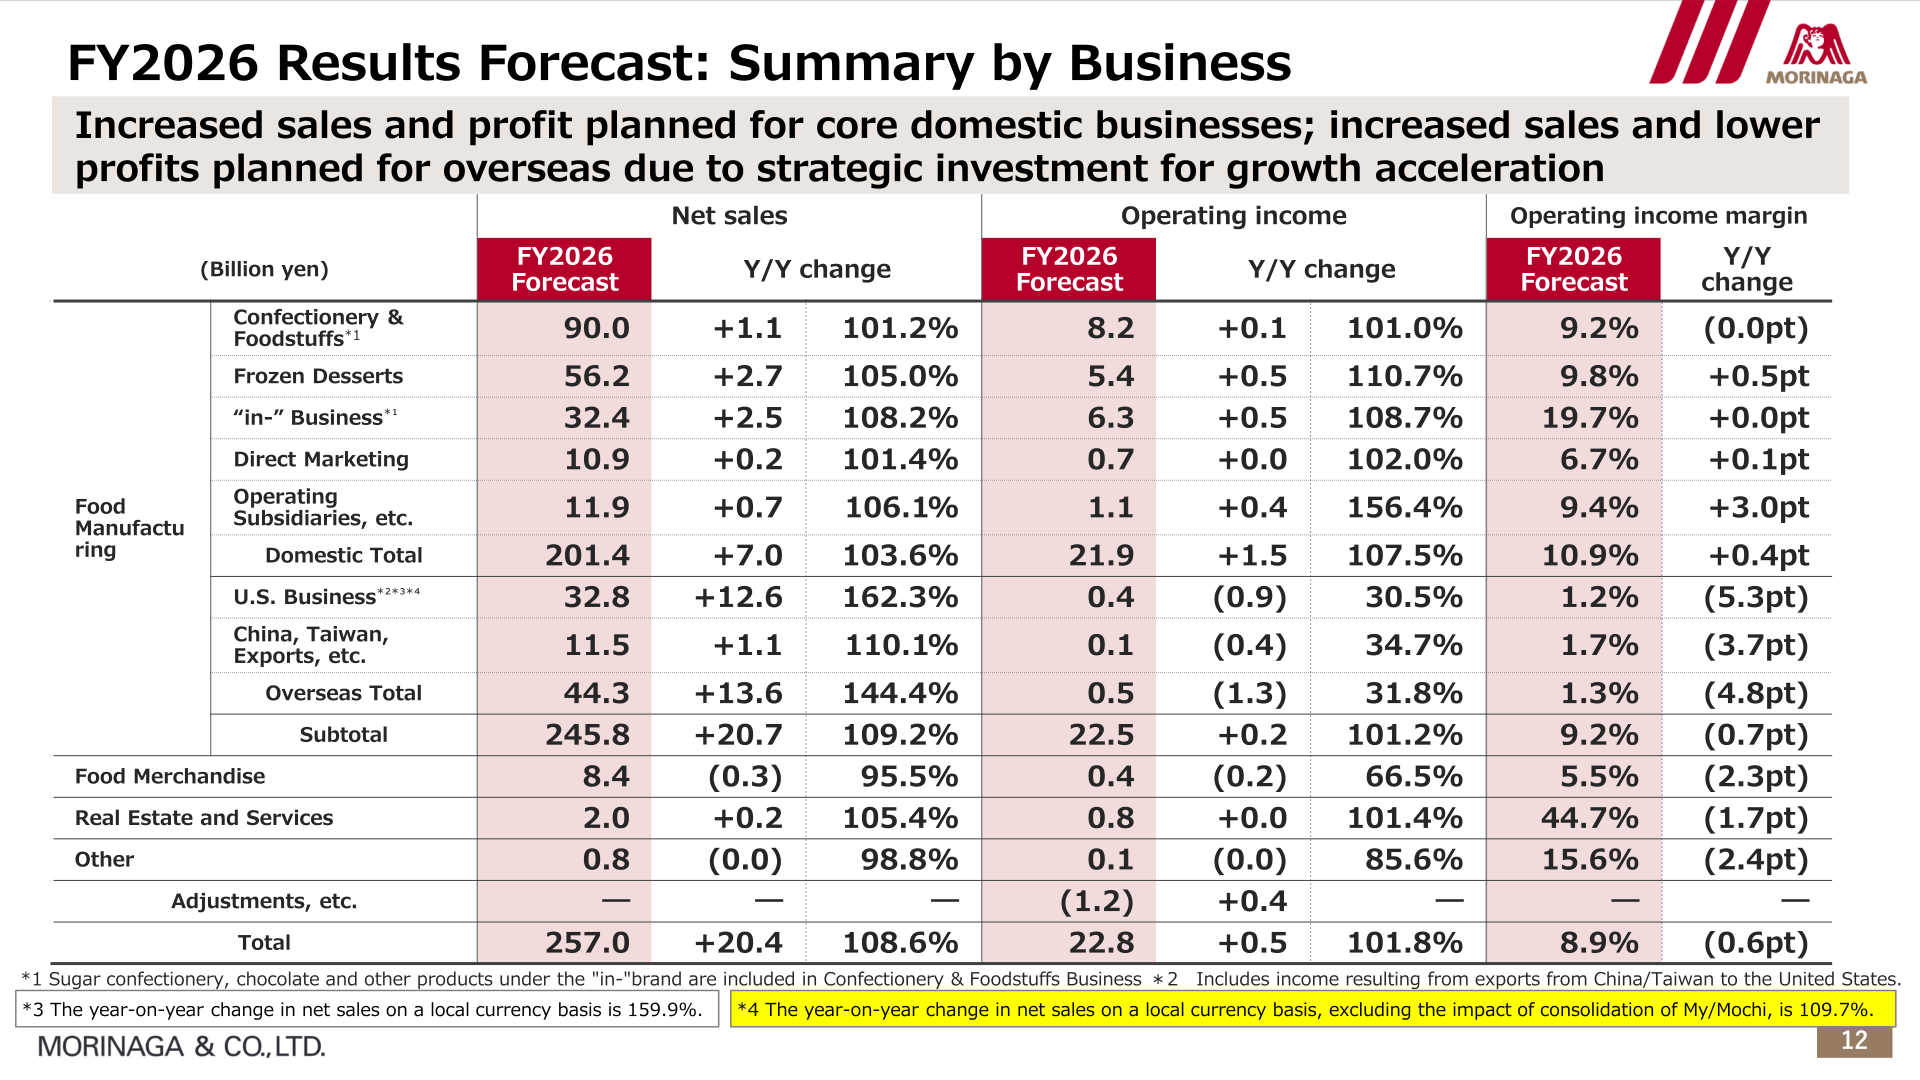
For FY2026 the company plans net sales of 257.0 billion yen (108.6%) and operating income of 22.8 billion yen (101.8%), with EBITDA rising +3.6 to 36.1 billion yen (111.0%). Ordinary income is forecast at 22.2 billion yen (98.0%) and profit attributable to owners of parent at 16.5 billion yen (92.9%), both lower year on year. The forecast assumes an exchange rate of USD 1 = JPY 153 and stable cacao market prices, and incorporates the impact of the situation in the Middle East on packaging materials, energy costs and logistics costs. My/Mochi is consolidated from April 2026 and is expected to contribute to profit growth on an EBITDA basis while creating downward pressure on operating income through amortization of goodwill and acquisition- and PMI-related expenses. By business, Domestic Total net sales are planned at 201.4 billion yen (103.6%) with operating income of 21.9 billion yen (107.5%), while Overseas Total net sales rise to 44.3 billion yen (144.4%) with operating income of 0.5 billion yen (31.8%); U.S. Business net sales are planned at 32.8 billion yen (162.3%), or 159.9% on a local currency basis and 109.7% excluding the impact of the consolidation of My/Mochi.
| Item | FY2026 Forecast | Y/Y change | Y/Y (%) |
|---|---|---|---|
| Net sales | 257.0 | +20.4 | 108.6% |
| Gross profit 〔gross profit margin〕 | 105.0 〔40.9%〕 | +10.1 〔+0.8pt〕 | 110.6% |
| Operating income 〔operating income margin〕 | 22.8 〔8.9%〕 | +0.5 〔(0.6pt)〕 | 101.8% |
| Ordinary income | 22.2 | (0.4) | 98.0% |
| Profit attributable to owners of parent | 16.5 | (1.2) | 92.9% |
| EBITDA | 36.1 | +3.6 | 111.0% |
Shareholder Returns
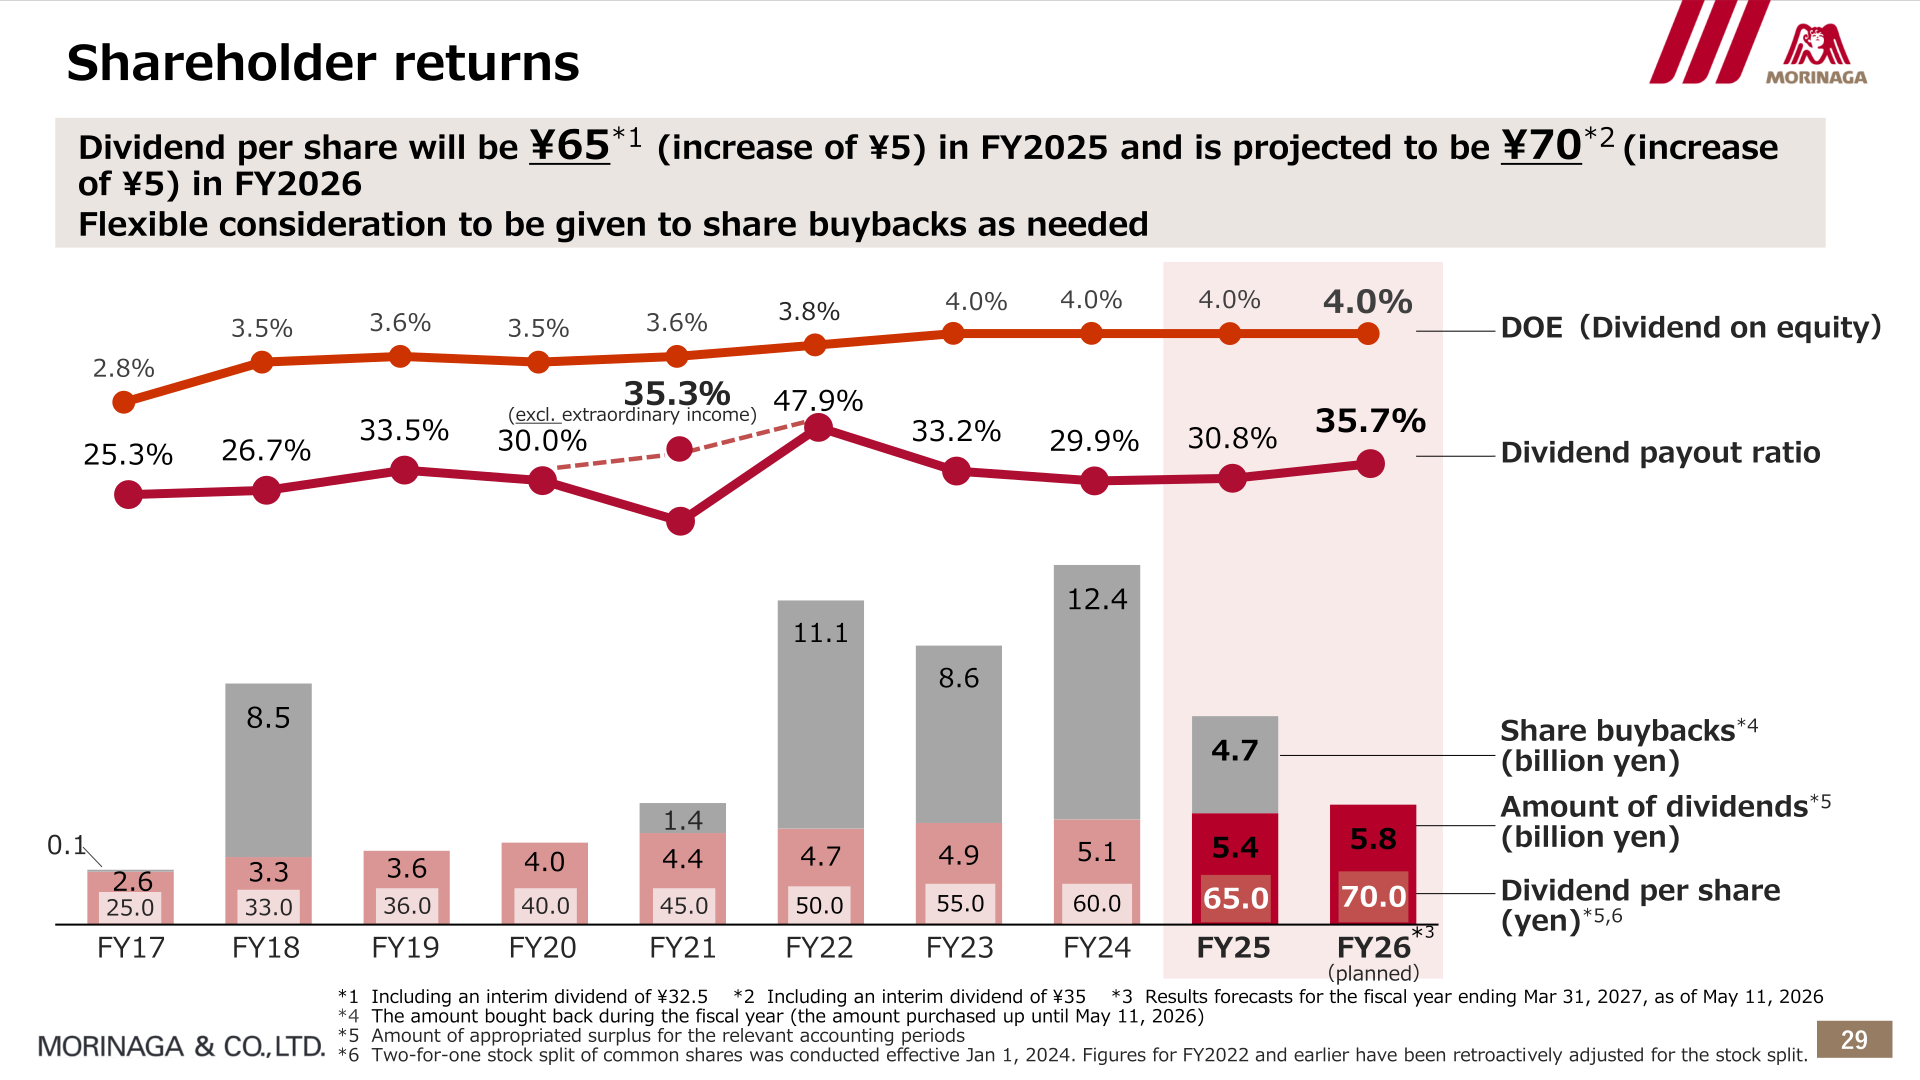
The dividend per share will be ¥65 in FY2025, an increase of ¥5, including an interim dividend of ¥32.5, and is projected to be ¥70 in FY2026, a further increase of ¥5, including an interim dividend of ¥35. DOE (dividend on equity) is 4.0% in both years, and the dividend payout ratio excluding extraordinary income is 30.8% in FY2025 and 35.7% in FY2026. Share buybacks of 4.7 billion yen were carried out during FY2025 on the basis of the amount purchased up until May 11, 2026, and the company states that flexible consideration will be given to share buybacks as needed. Two-for-one stock split of common shares was conducted effective January 1, 2024, and figures for FY2022 and earlier have been retroactively adjusted for the stock split.
| Item | FY2025 | FY2026 (planned) |
|---|---|---|
| Dividend per share | ¥65 (including an interim dividend of ¥32.5) | ¥70 (including an interim dividend of ¥35) |
| Amount of dividends (billion yen) | 5.4 | 5.8 |
| Share buybacks (billion yen) | 4.7 | ― |
| DOE (Dividend on equity) | 4.0% | 4.0% |
| Dividend payout ratio (excl. extraordinary income) | 30.8% | 35.7% |
Medium-Term Plan and Topics
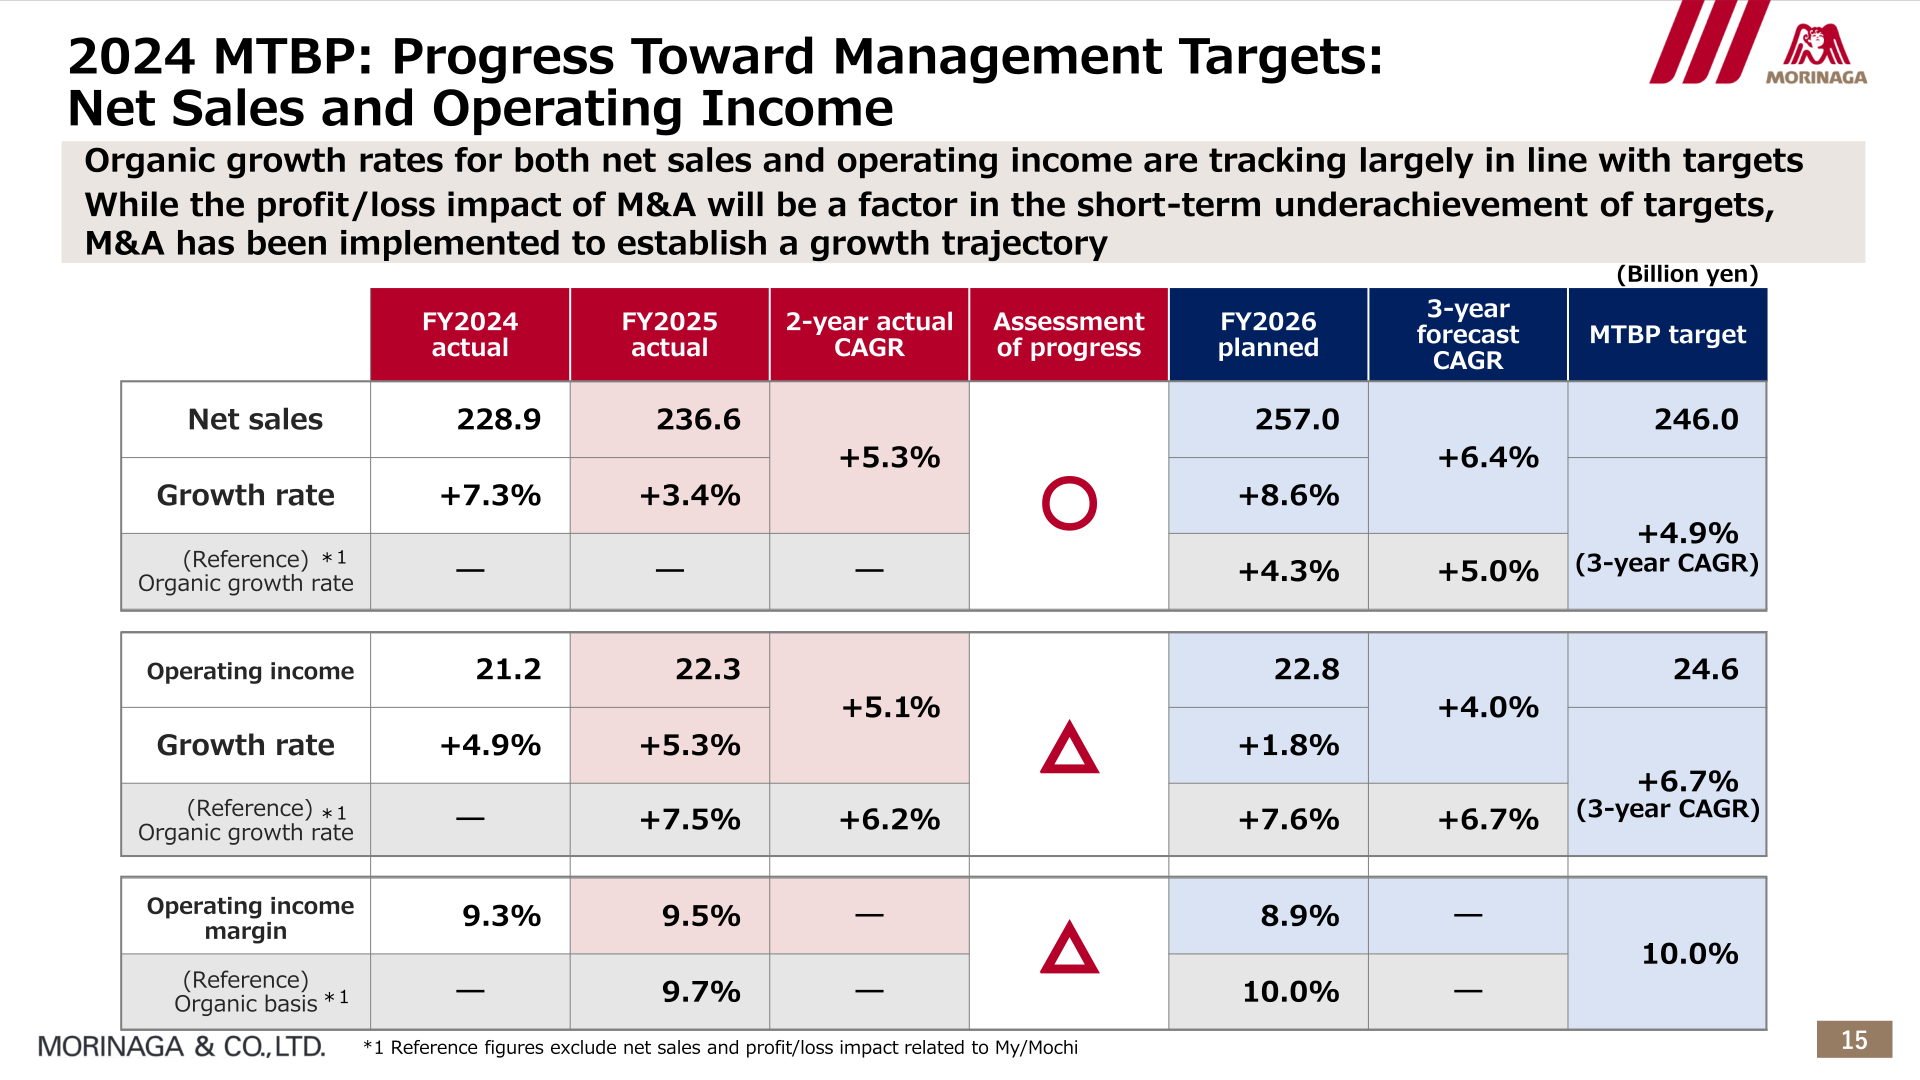
Under the 2024 Medium-Term Business Plan, FY2025 net sales of 236.6 billion yen and operating income of 22.3 billion yen represent two-year actual CAGRs of +5.3% and +5.1%. The plan targets net sales of 246.0 billion yen, operating income of 24.6 billion yen and an operating income margin of 10.0%. The company assesses progress on net sales as on track and progress on operating income and the operating income margin as behind target. On a reference basis excluding net sales and the profit and loss impact related to My/Mochi, FY2025 organic operating income growth was +7.5% and the organic operating income margin was 9.7%, with FY2026 organic figures of +7.6% and 10.0%. Total investment over the three years of the plan is now forecast at approximately ¥65.0 billion against a plan of approximately ¥60.0 billion, comprising approximately ¥40.0 billion of property, plant and equipment, approximately ¥6.0 billion of intangible assets and ¥10.0–15.0 billion of M&A and similar spending. Total shareholder returns through the second year of the plan were approximately ¥30.0 billion against a three-year plan of ¥36.0 billion or more.
On the My/Mochi acquisition, closing was completed on April 1, 2026 and a Day 1 kick-off meeting was held on April 3, 2026. The acquisition price of $130M includes the portion allocated to the repayment of interest-bearing debt, and the estimated amount of goodwill and intangible assets is approximately USD 120M, with an assumed amortization period of 12 years for goodwill and 5 years for intangible assets on a straight-line basis; purchase price allocation is to be finalized around the time of Q2 results. My/Mochi net sales are expected to increase, with a forecast of 104.5% year on year. Reflecting the acquisition, the shareholders’ equity ratio is estimated to move from 62.8% at the end of FY2025 to approximately 56%, the net D/E ratio from (0.05) to approximately 0.1, and the interest-bearing debt to EBITDA ratio from 0.58 to approximately 1.2 times, with short-term borrowings increasing by approximately ¥20.0 billion.
Financial Position and Cash Flows
Total assets stood at 225.9 billion yen at the end of FY2025, up +16.0 year on year, with current assets of 105.8 billion yen (+1.2) and non-current assets of 120.0 billion yen (+14.7), the latter reflecting a +14.8 increase in construction in progress and a +6.3 increase in net defined benefit asset. Total liabilities were 82.2 billion yen (+4.7) and total net assets 143.6 billion yen (+11.3), leaving a shareholders’ equity ratio of 62.8%, up +0.5pt. Operating cash flow was 23.6 billion yen (+12.9), investing cash flow was (14.2) and free cash flow was 9.7 billion yen (+8.9), while financing cash flow was (13.2).
This article is an analysis based on publicly available information and is not a recommendation to buy or sell any specific securities. Investment decisions are your own responsibility.
![[Obayashi] Investors’ Guide 2026 — The Complete 24-Article Breakdown](https://japan-equity.com/wp-content/uploads/2026/07/hub_cover-1024x1024.png)
![[Obayashi] IR & SR Policy — Feeding Dialogue Back into Management](https://japan-equity.com/wp-content/uploads/2026/07/p32_sq-1024x1024.jpg)
![[Obayashi] Real Estate Development — 18.7% Margin, ¥287.7bn Unrealized Gains](https://japan-equity.com/wp-content/uploads/2026/07/p20_sq-1024x1024.jpg)
![[Obayashi] Domestic Civil Engineering — Resilience Spending Supports 9.6% Margin](https://japan-equity.com/wp-content/uploads/2026/07/p11_sq-1024x1024.jpg)
![[Obayashi] Share Price & External Ratings — vs TOPIX, ESG Index Inclusion](https://japan-equity.com/wp-content/uploads/2026/07/p40_sq-1024x1024.jpg)
![[Construction] ¥75.5tn Investment, Shrinking Workforce — Big-5 Market Share](https://japan-equity.com/wp-content/uploads/2026/07/p12_sq-1024x1024.jpg)



![[Obayashi] Capital Policy & Shareholder Returns — ROE 10%+, DOE ~5%, ¥100bn Buyback](https://japan-equity.com/wp-content/uploads/2026/07/p27_sq-1024x1024.jpg)
![[Obayashi] Reducing Cross-Shareholdings — ¥285.2bn Sold in Five Years](https://japan-equity.com/wp-content/uploads/2026/07/p29_sq-1024x1024.jpg)
![[Obayashi] ¥750bn Investment Plan — ¥300bn to Development, ¥190bn to Tech/DX](https://japan-equity.com/wp-content/uploads/2026/07/p30_sq-1024x1024.jpg)
![[Obayashi] MTP2022 KPIs — Operating Profit ~2x Target, ROE 14.4%](https://japan-equity.com/wp-content/uploads/2026/07/p25_sq-1024x1024.jpg)
![[Obayashi] Cash Allocation — ¥420bn Investment CF Over Five Years](https://japan-equity.com/wp-content/uploads/2026/07/p26_sq-1024x1024.jpg)
![[Obayashi] Green Energy — 44 Plants, 344MW, and the Green Hydrogen Challenge](https://japan-equity.com/wp-content/uploads/2026/07/p21_sq-1024x1024.jpg)
![[Obayashi] Tackling the Labor Shortage — Robotics Construction®](https://japan-equity.com/wp-content/uploads/2026/07/p14_sq-1024x1024.jpg)
