
This article is based on publicly available IR materials and is not a recommendation to buy or sell any specific securities.
Note: Members Co., Ltd. labels the fiscal year ended March 31, 2026 as “FY2026”; this site classifies the most recent completed fiscal year as FY2025, and the labels used in the text, tables and segment data below are kept as they appear in the company’s materials.
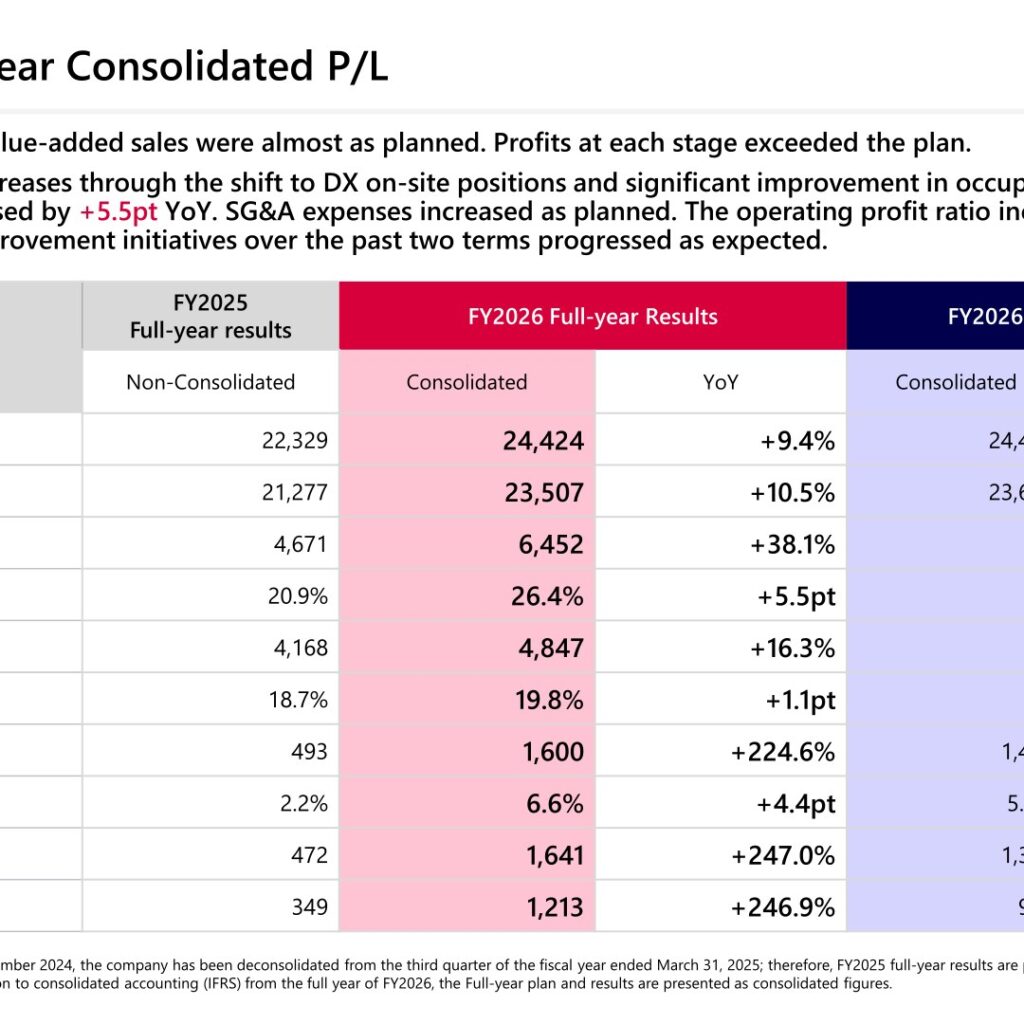
Members Co., Ltd. reported FY2026 full-year revenue of 24,424 million yen (YoY +9.4%) and operating profit of 1,600 million yen (YoY +224.6%), with operating profit reaching 114.3% of the full-year plan of 1,400 million yen. Value-added sales, defined by the company as revenue less subcontracting and purchases, came to 23,507 million yen (YoY +10.5%). The company attributes the profit recovery to unit price increases from the shift to DX field support positions and to a significant improvement in occupancy rates, which lifted the gross margin by +5.5pt YoY to 26.4%. Due to the merger of subsidiaries in November 2024 the company was deconsolidated from the third quarter of FY2025, so FY2025 full-year results are presented as IFRS non-consolidated figures, while FY2026 plan and results are presented as consolidated figures; the company notes that YoY comparisons are therefore reference values.
Consolidated Results (Full-Year Actual)
Both revenue and value-added sales were almost as planned, and profits at each stage exceeded the plan. Profit before tax was 1,641 million yen (YoY +247.0%, 118.1% of plan) and profit was 1,213 million yen (YoY +246.9%, 130.5% of plan). SG&A expenses rose 16.3% YoY to 4,847 million yen, with the SG&A expenses ratio at 19.8% (+1.1pt YoY).
| Item (unit: million yen) | FY2025 Full-year results (Non-Consolidated) | FY2026 Full-year Results (Consolidated) | YoY | FY2026 Full-year Plan (Consolidated) | Progress rate |
|---|---|---|---|---|---|
| Revenue | 22,329 | 24,424 | +9.4% | 24,400 | 100.1% |
| Value-added sales | 21,277 | 23,507 | +10.5% | 23,620 | 99.5% |
| Gross profit | 4,671 | 6,452 | +38.1% | — | — |
| Gross margin (%) | 20.9% | 26.4% | +5.5pt | — | — |
| SG&A expenses | 4,168 | 4,847 | +16.3% | — | — |
| SG&A expenses ratio (%) | 18.7% | 19.8% | +1.1pt | — | — |
| Operating profit | 493 | 1,600 | +224.6% | 1,400 | 114.3% |
| Operating profit ratio (%) | 2.2% | 6.6% | +4.4pt | 5.7% | — |
| Profit before tax | 472 | 1,641 | +247.0% | 1,390 | 118.1% |
| Profit | 349 | 1,213 | +246.9% | 930 | 130.5% |
Key Operating Indicators
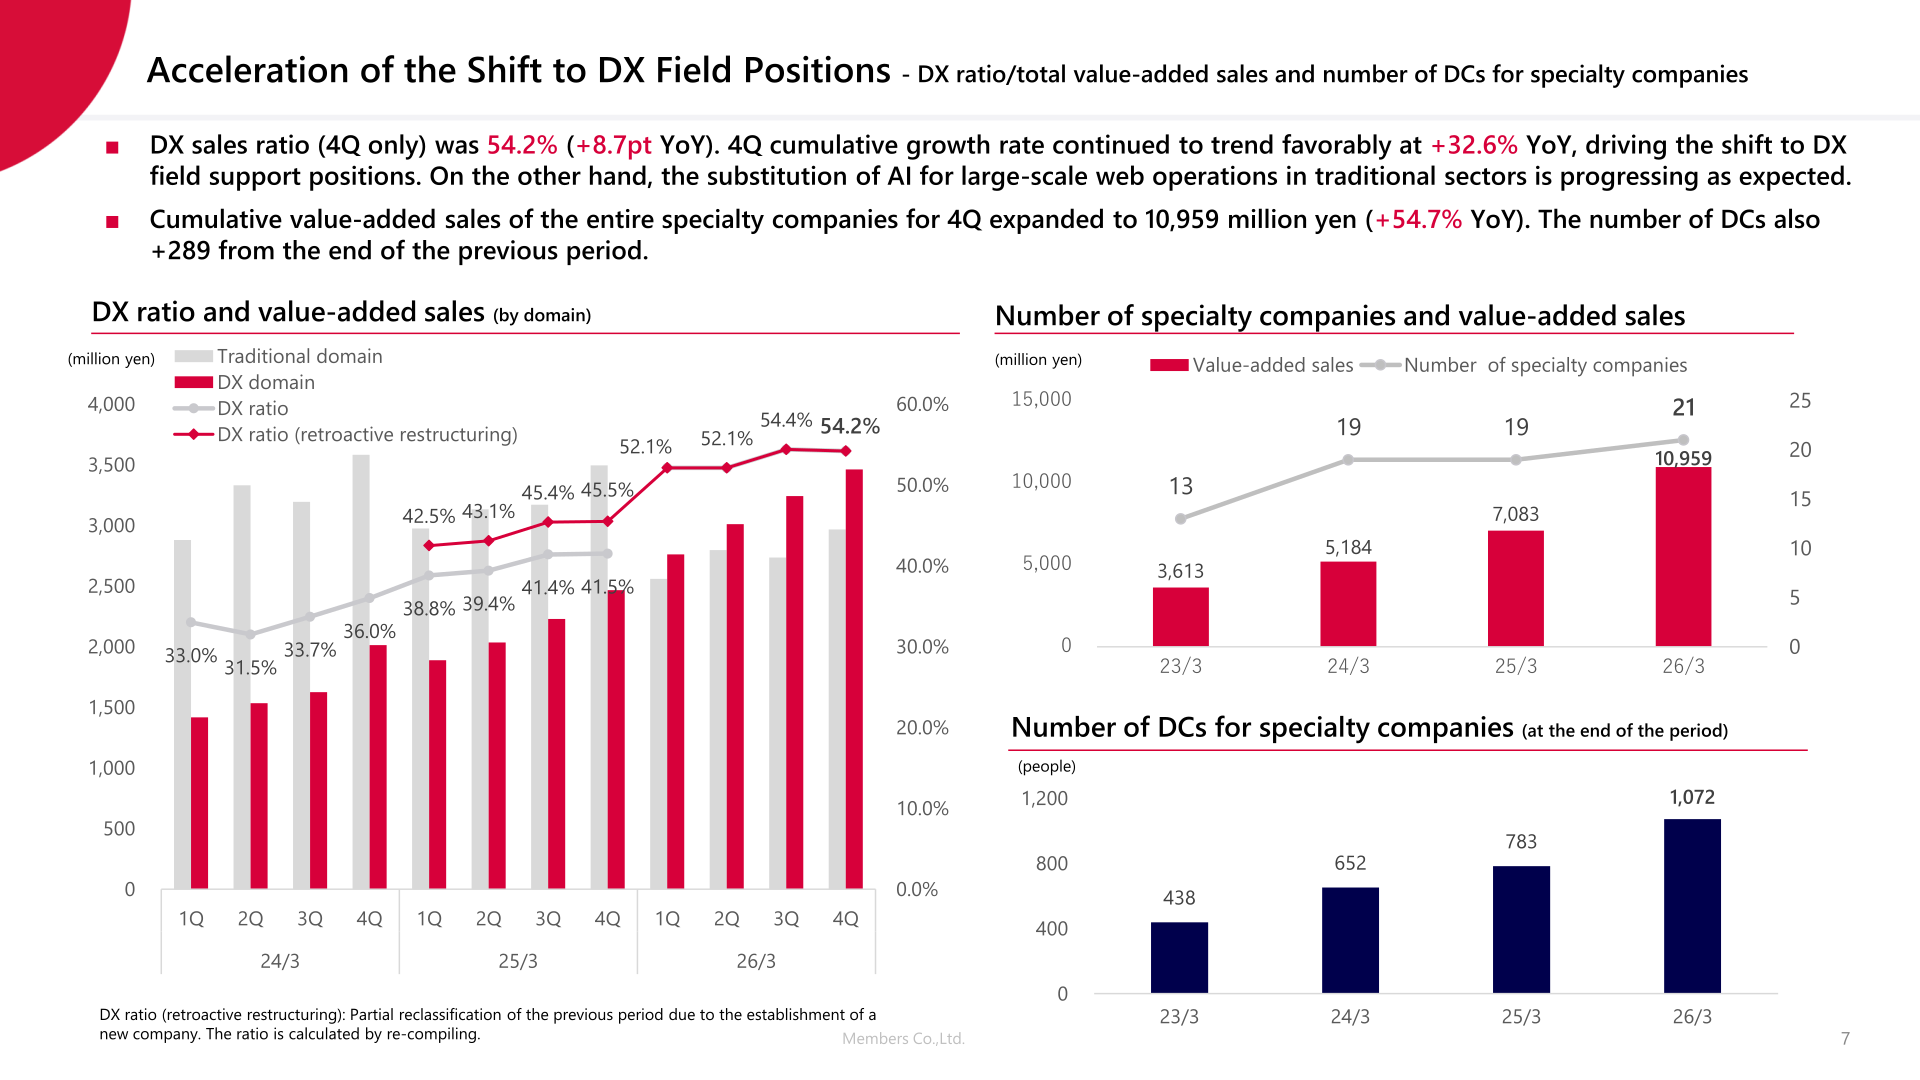
The DX domain ratio in the fourth quarter was 54.2% (YoY +8.7pt) and the DX domain growth rate on a fourth-quarter cumulative basis was +32.6% YoY. The DX talent ratio at the end of the fourth quarter reached 72.0%, above the 65% target. The number of PMO staff at the end of the fourth quarter was 1,482 (+1,124 from the prior year-end) against a target of 1,000. Unit price per person on a fourth-quarter cumulative basis was 971 thousand yen (YoY +6.5%). The number of digital creators (DC) at the end of the fourth quarter was 2,456 (-171 from the prior year-end), and the occupancy rate of DCs excluding first- and second-year new graduates was 85.0% in the fourth quarter (YoY -0.4pt). The number of clients with annual sales of at least 100 million yen was 55 (unchanged YoY).
Cumulative value-added sales of the entire specialty companies for the fourth quarter expanded to 10,959 million yen (YoY +54.7%), from 7,083 million yen in FY2025, 5,184 million yen in FY2024 and 3,613 million yen in FY2023. The number of specialty companies was 21 at the end of March 2026 (19 a year earlier), and the number of DCs for specialty companies at the end of the period was 1,072, up from 783.
Results by Business Sector
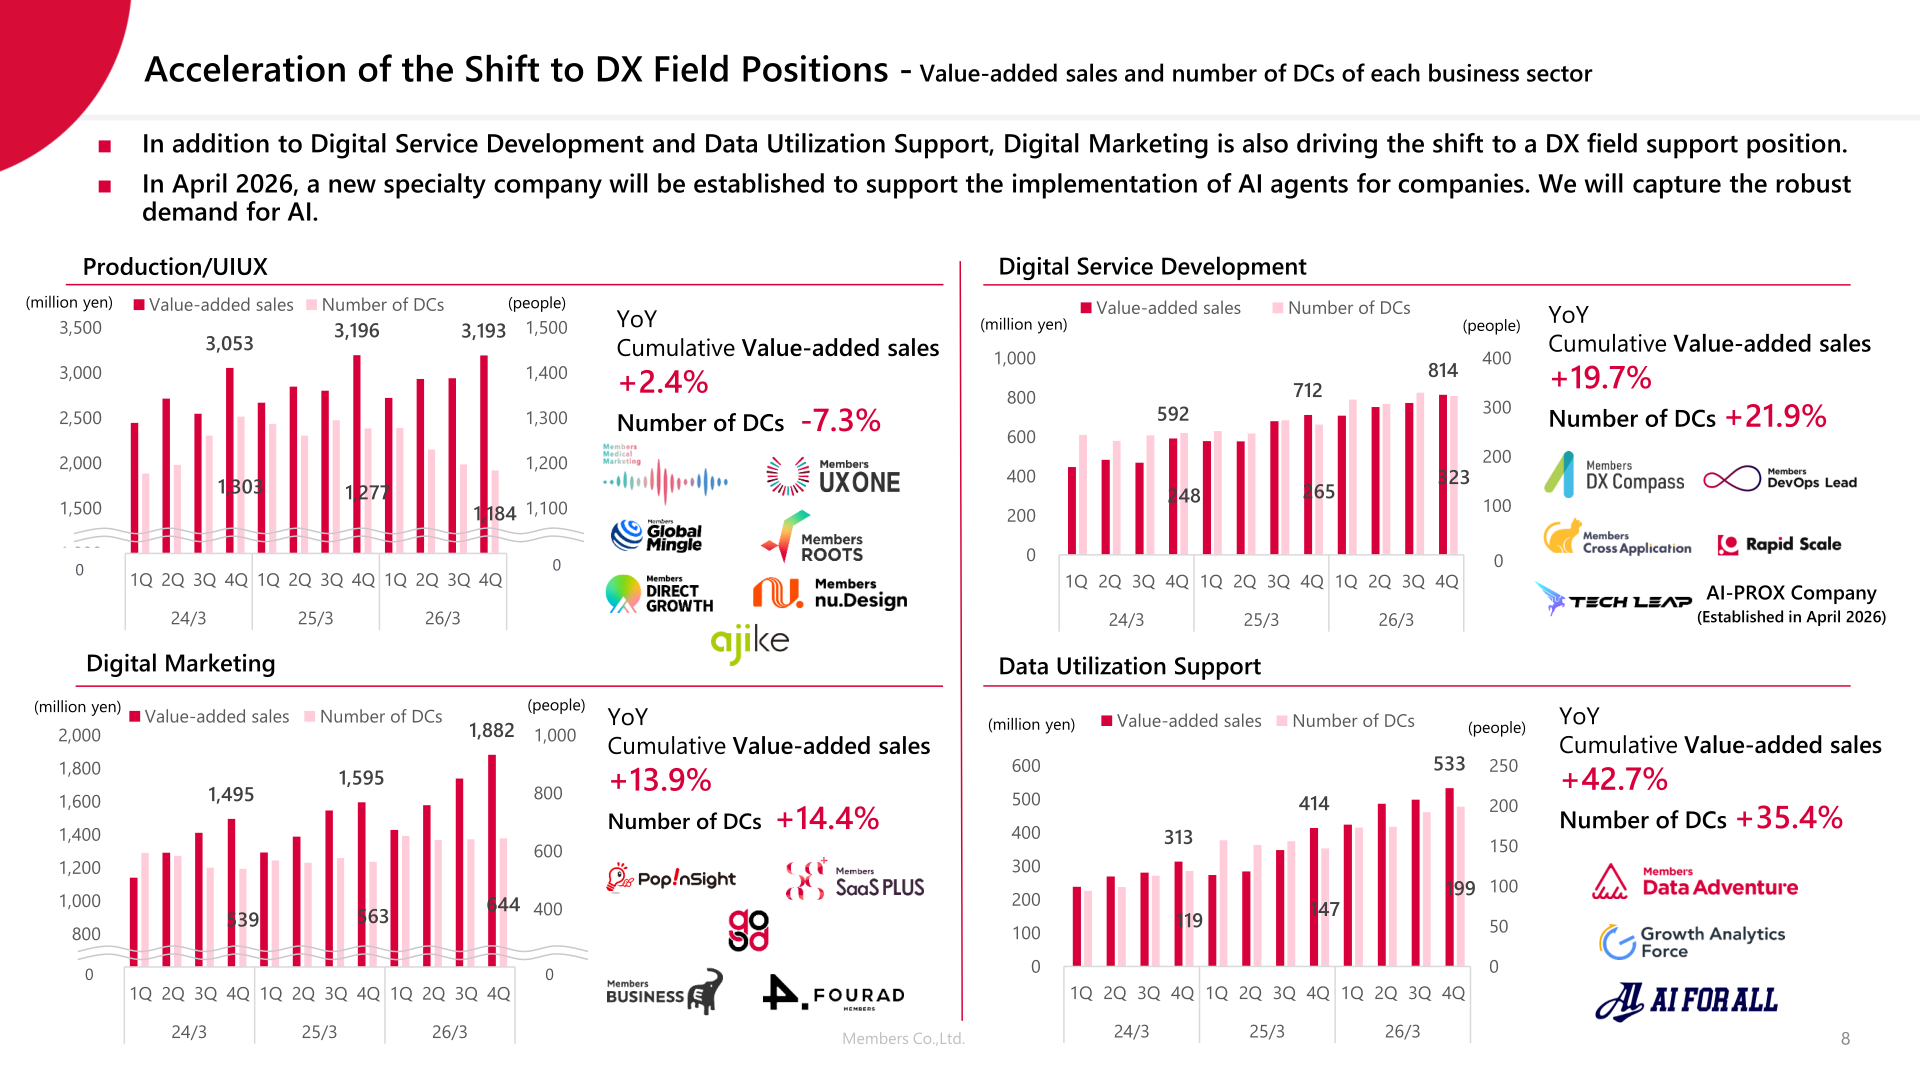
The company presents value-added sales and the number of DCs for four business sectors. In addition to Digital Service Development and Data Utilization Support, Digital Marketing is also driving the shift to a DX field support position. The figures below are the fourth-quarter data labels for each sector shown in the presentation, together with the year-on-year rates of change disclosed for cumulative value-added sales and the number of DCs.
| Business Sector | Value-added sales, 4Q (million yen) | Number of DCs, 4Q (people) | YoY cumulative value-added sales | YoY number of DCs |
|---|---|---|---|---|
| Production/UIUX | 3,193 | 1,184 | +2.4% | -7.3% |
| Digital Marketing | 1,882 | 644 | +13.9% | +14.4% |
| Digital Service Development | 814 | 323 | +19.7% | +21.9% |
| Data Utilization Support | 533 | 199 | +42.7% | +35.4% |
FY2027 Plan
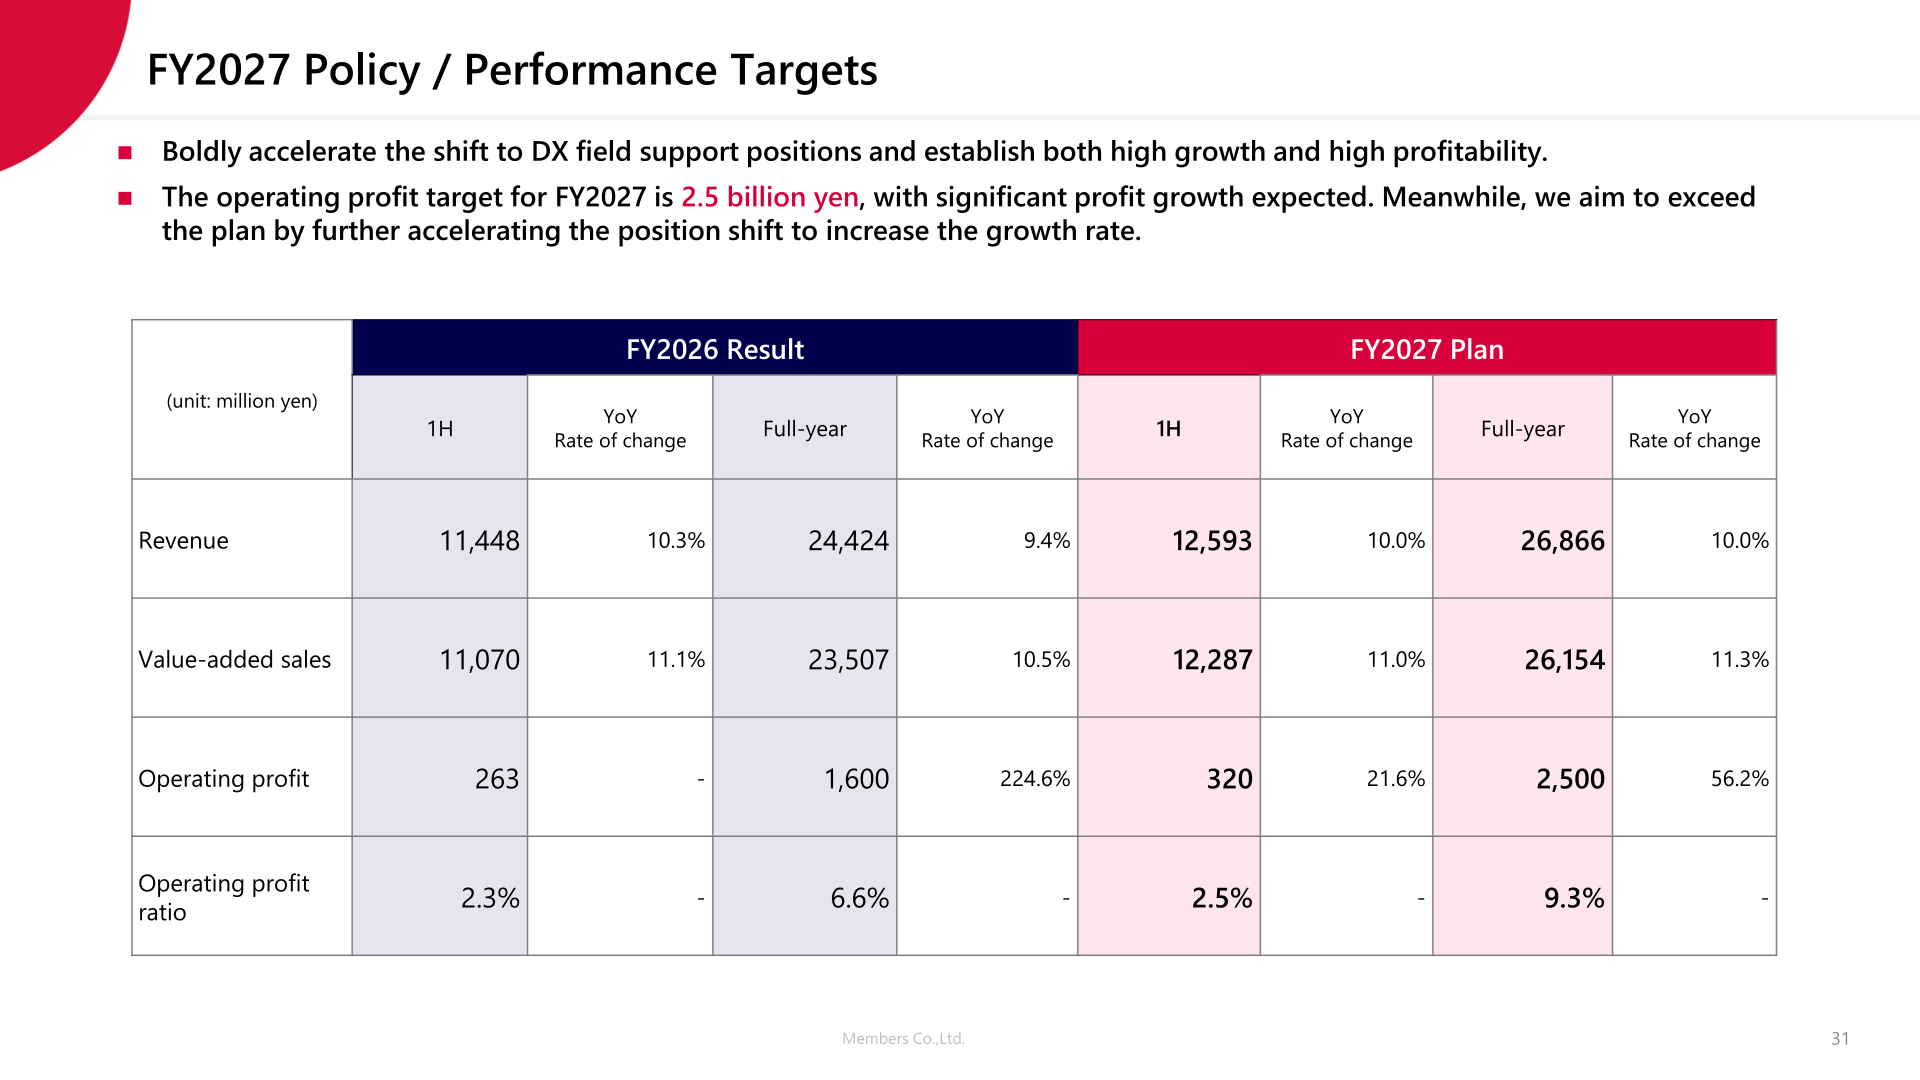
For FY2027 the company plans revenue of 26,866 million yen (+10.0%) and value-added sales of 26,154 million yen (+11.3%), with operating profit of 2,500 million yen (+56.2%) and an operating profit ratio of 9.3%. The company states that it aims to exceed the plan by further accelerating the position shift to increase the growth rate. Key strategy KPIs for FY2027 include a DX talent ratio of 90%, a DX sales ratio of 70%, five new specialty companies established, an occupancy rate of 85%, and a value-added sales growth rate of 15% or higher with operating profit of 2.5 billion yen or more and an operating profit margin of 10% under the “Strategy for Medium-Term Growth.”
| Item (unit: million yen) | FY2026 Result 1H | FY2026 Result Full-year | FY2026 YoY Rate of change (Full-year) | FY2027 Plan 1H | FY2027 Plan Full-year | FY2027 YoY Rate of change (Full-year) |
|---|---|---|---|---|---|---|
| Revenue | 11,448 | 24,424 | 9.4% | 12,593 | 26,866 | 10.0% |
| Value-added sales | 11,070 | 23,507 | 10.5% | 12,287 | 26,154 | 11.3% |
| Operating profit | 263 | 1,600 | 224.6% | 320 | 2,500 | 56.2% |
| Operating profit ratio | 2.3% | 6.6% | – | 2.5% | 9.3% | – |
Shareholder Returns
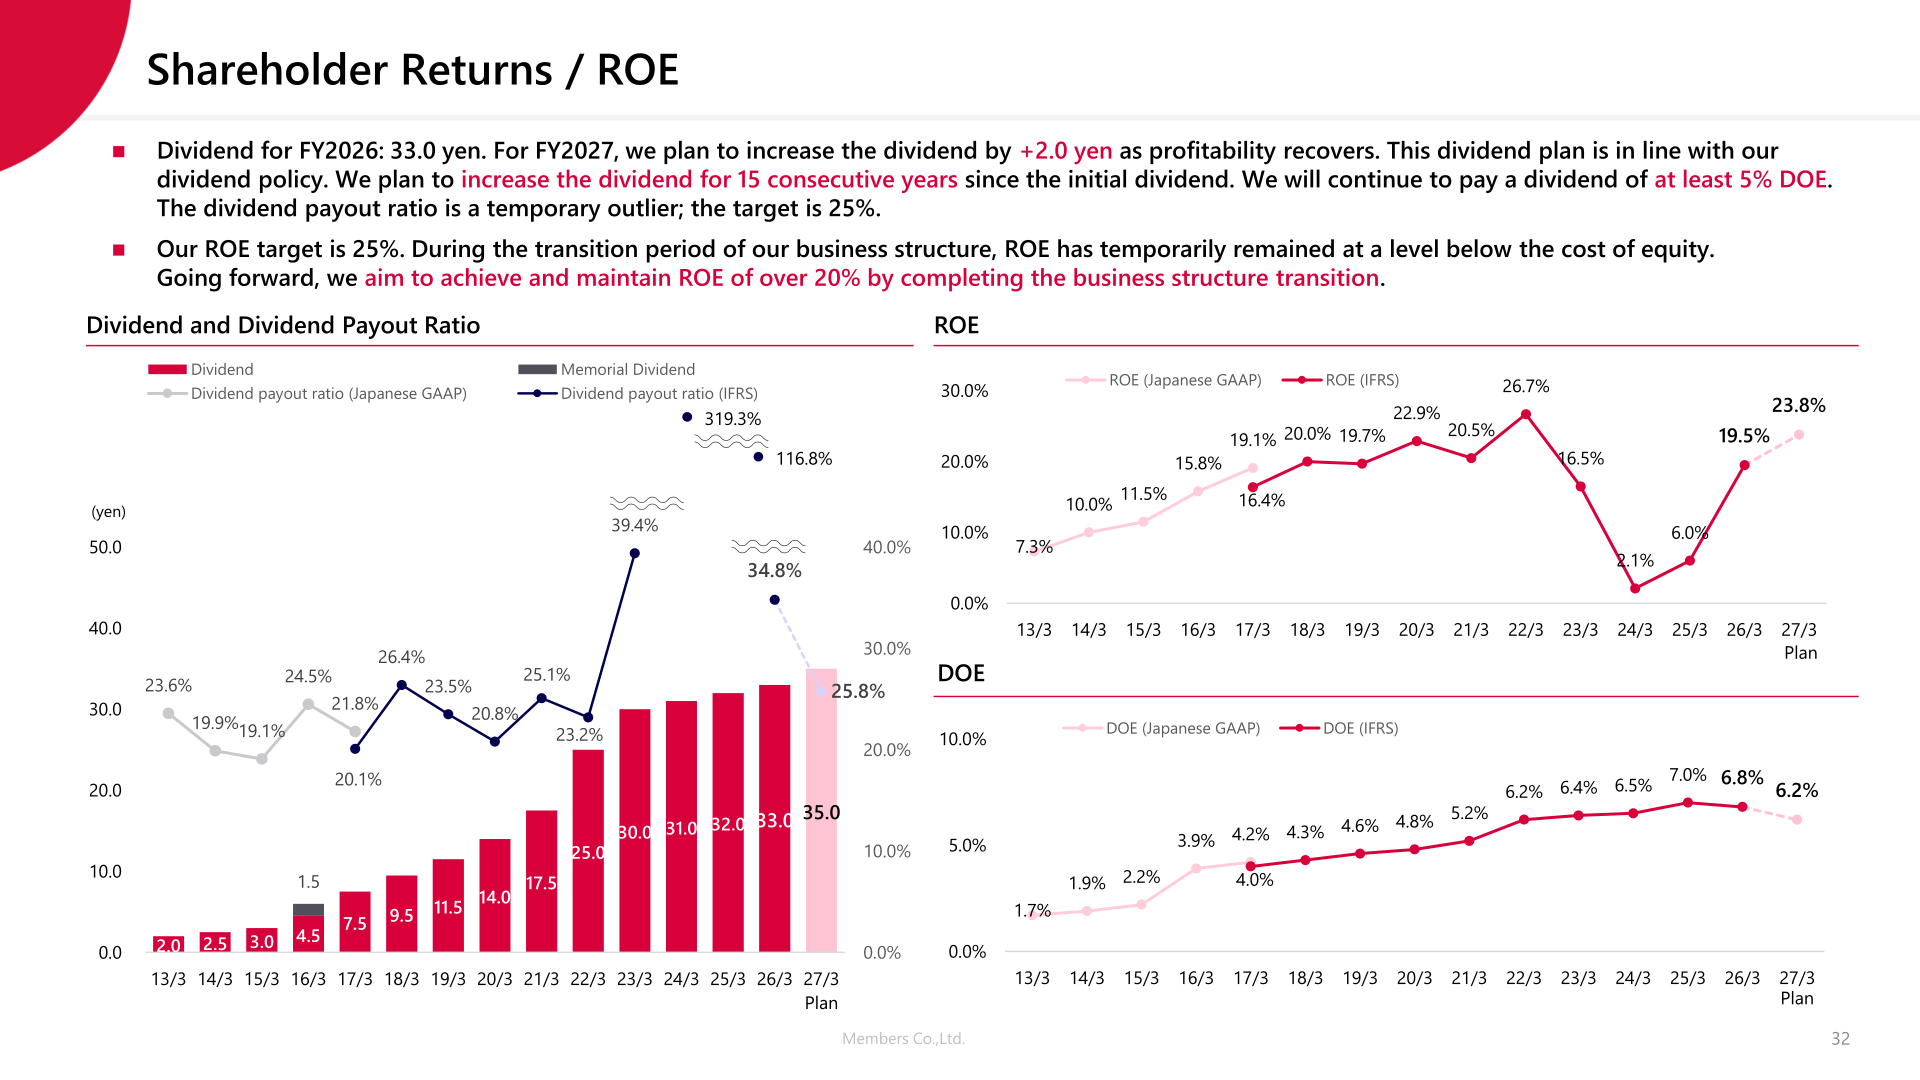
The dividend for FY2026 is 33.0 yen per share. For FY2027 the company plans to increase the dividend by +2.0 yen to 35.0 yen as profitability recovers, which it states is in line with its dividend policy and would mark the 15th consecutive year of dividend increases since the initial dividend. The company will continue to pay a dividend of at least 5% DOE; it describes the current dividend payout ratio as a temporary outlier and sets a payout ratio target of 25%. The ROE target is 25%, and the company says ROE has temporarily remained below the cost of equity during the transition period of its business structure, with the aim of achieving and maintaining ROE of over 20% once that transition is complete.
| Item | FY2026 (26/3) | FY2027 Plan (27/3) |
|---|---|---|
| Dividend per share (yen) | 33.0 | 35.0 |
| Dividend payout ratio (IFRS) | 34.8% | 25.8% |
| DOE (IFRS) | 6.8% | 6.2% |
| ROE (IFRS) | 19.5% | 23.8% |
Vision and Topics
Following the suspension of its VISION2030 targets, the company has redefined its targets and vision as FUTURE VISION, which it says it will pursue toward 2035. The KGI under FUTURE VISION is 1,000 impact cases and operating profit of 10 billion yen, with KPIs including brand business awareness of 40%, a net increase of 50 companies, an average unit price of 2 million yen, annual hires of 1,000, a network of learners of 100,000, an engagement score of 4.0 and a model annual income of 10 million yen. In April 2026 a new specialty company, AI-PROX Company, was established to support the implementation of AI agents for client companies. The employee engagement score reached 3.52 out of 5.00 (YoY +0.11pt), achieving the target, while the Decarbonization Action Score landed at 11,978 actions against a year-end target of 3,500 actions; NPS was -8.3pt (YoY -4.8pt) and did not reach the target. The company also states that it will transition to a single Representative Director system from April 2026 and maintain a ratio of outside directors of 71.4%.
This article is an analysis based on publicly available information and is not a recommendation to buy or sell any specific securities. Investment decisions are your own responsibility.
















