
This article is based on publicly available IR materials and is not a recommendation to buy or sell any specific securities.
NIPPON DENSETSU KOGYO CO., LTD. reported FY2025 results, covering the fiscal year ended March 31, 2026, on May 18, 2026. Net sales came to 229,207 million yen and operating profit to 23,560 million yen, an operating margin of 10.3%. The company states that orders reached a record high for the third consecutive year, while net sales, operating profit, ordinary profit, profit attributable to owners of parent, and backlog carried over to the next period all reached record highs for the second consecutive year. A dividend of 124 yen per share is planned, for a dividend payout ratio of 40.1%.
Consolidated Results (Full-Year Actual)
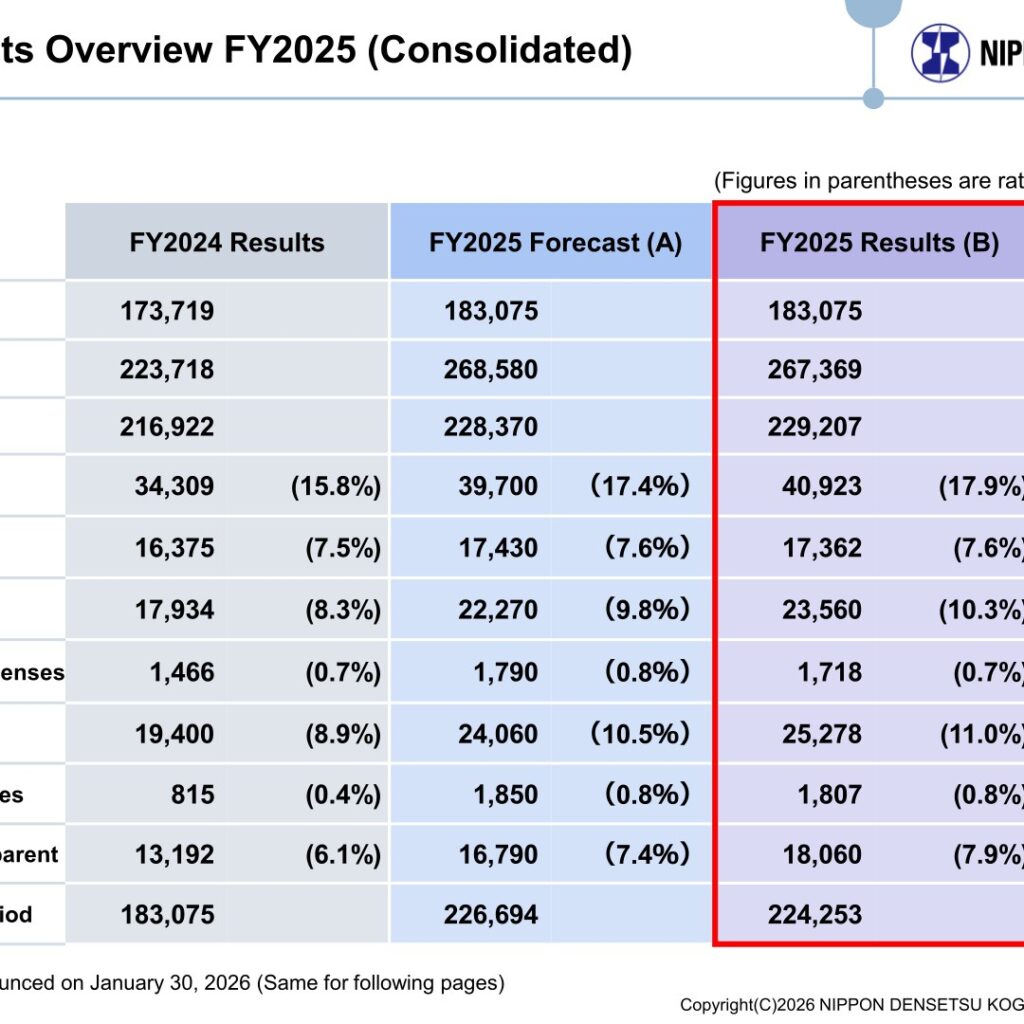
The company describes the business environment as one in which public investment remained solid and private capital investment continued to recover, with demand related to urban redevelopment and capital investment such as data center construction expanding, and with investment and equipment replacement for safe, stable transport remaining solid at railway companies. Against the FY2025 forecast announced on January 30, 2026, net sales came in 837 million yen (0.4%) higher and operating profit 1,290 million yen (5.8%) higher, while orders finished 1,210 million yen (0.5%) below the forecast. The gross profit margin rose to 17.9% from 15.8% in FY2024.
| Item (million yen) | FY2024 Results | FY2025 Forecast (A) | FY2025 Results (B) | Comparison with the forecast (B-A) |
|---|---|---|---|---|
| Backlog at beginning of period | 173,719 | 183,075 | 183,075 | – |
| Orders | 223,718 | 268,580 | 267,369 | -1,210 (-0.5%) |
| Net sales | 216,922 | 228,370 | 229,207 | 837 (0.4%) |
| Gross profit | 34,309 (15.8%) | 39,700 (17.4%) | 40,923 (17.9%) | 1,223 (3.1%) |
| SG&A | 16,375 (7.5%) | 17,430 (7.6%) | 17,362 (7.6%) | -67 (-0.4%) |
| Operating profit | 17,934 (8.3%) | 22,270 (9.8%) | 23,560 (10.3%) | 1,290 (5.8%) |
| Non-operating income and expenses | 1,466 (0.7%) | 1,790 (0.8%) | 1,718 (0.7%) | -71 (-4.0%) |
| Ordinary profit | 19,400 (8.9%) | 24,060 (10.5%) | 25,278 (11.0%) | 1,218 (5.1%) |
| Extraordinary income and losses | 815 (0.4%) | 1,850 (0.8%) | 1,807 (0.8%) | -42 (-2.3%) |
| Profit attributable to owners of parent | 13,192 (6.1%) | 16,790 (7.4%) | 18,060 (7.9%) | 1,270 (7.6%) |
| Backlog carried over to next period | 183,075 | 226,694 | 224,253 | -2,440 (-1.1%) |
Figures in parentheses are ratios to net sales. Unit: million yen. The FY2025 forecast figures are those announced on January 30, 2026.
Segment Results
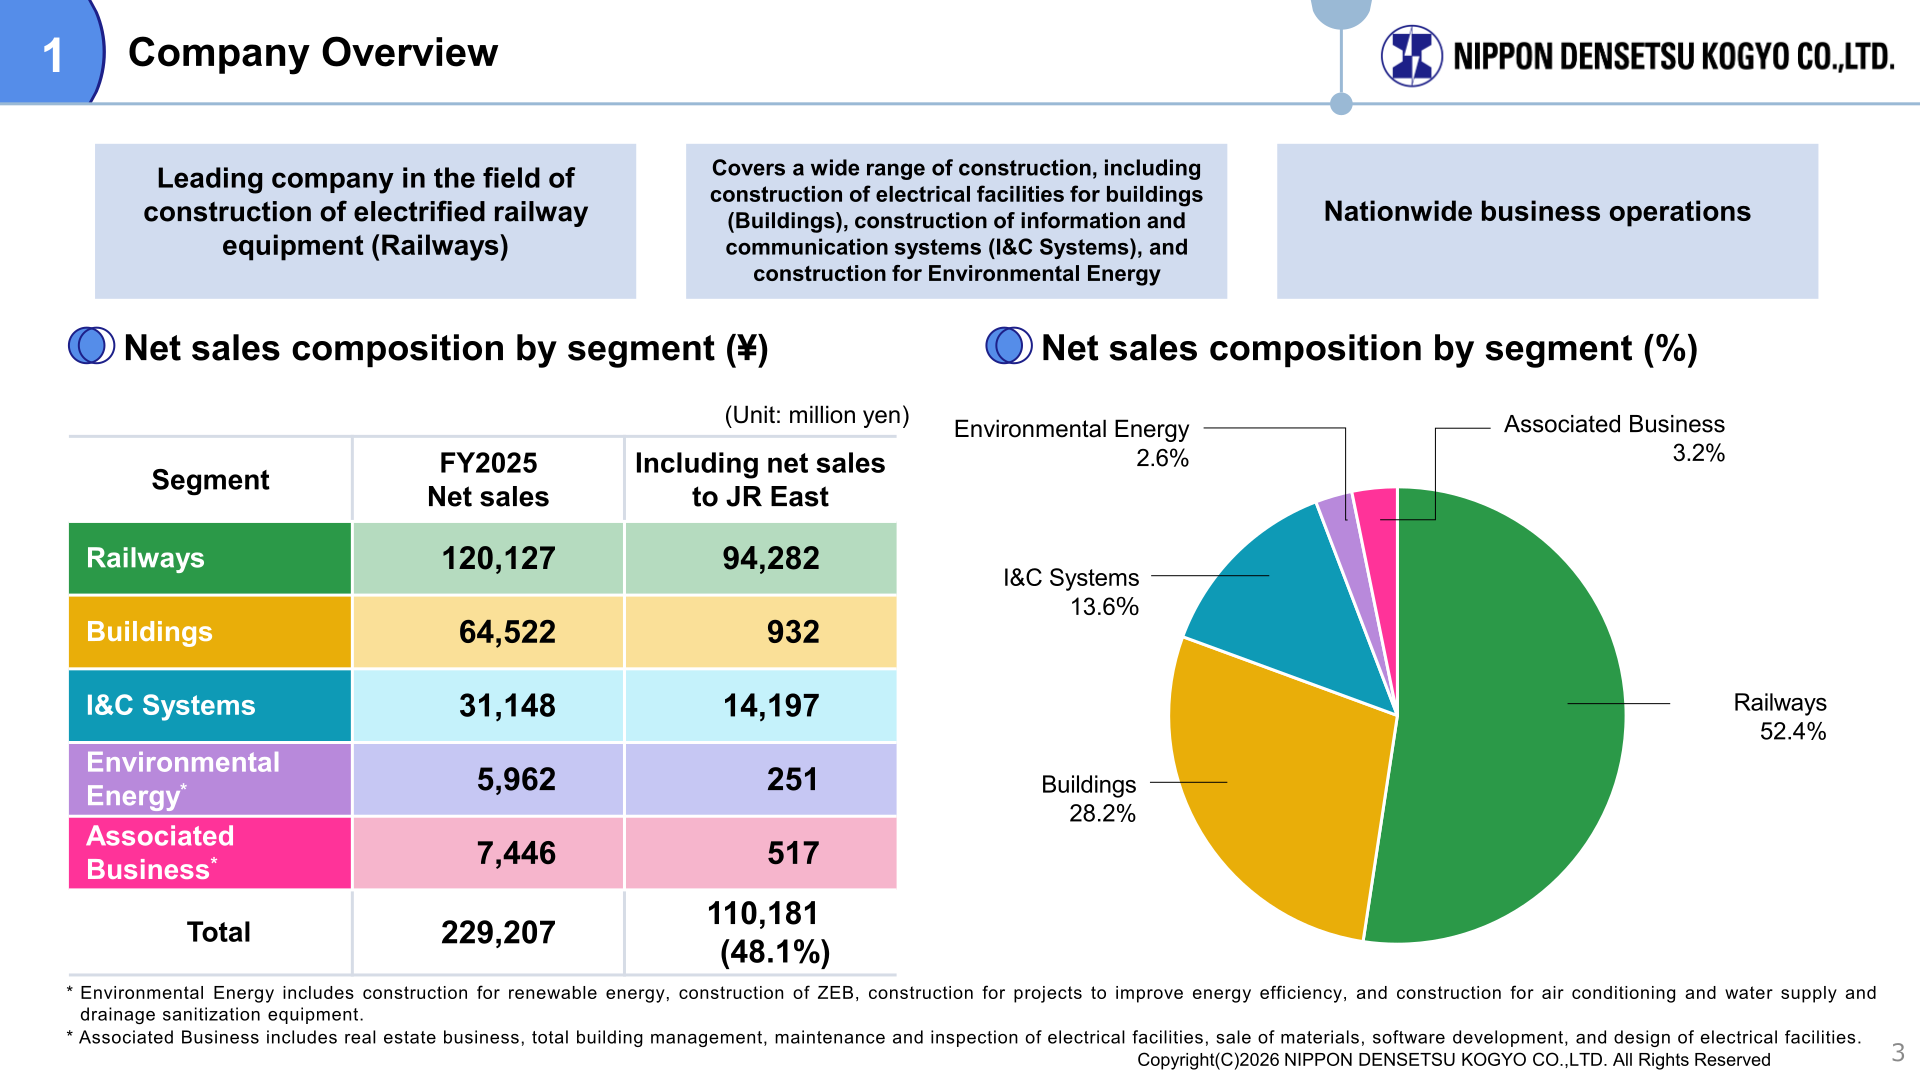
The Railways segment (construction of electrified railway equipment) accounted for 52.4% of net sales, followed by Buildings at 28.2%, I&C Systems at 13.6%, Associated Business at 3.2% and Environmental Energy at 2.6%. Net sales to JR East totalled 110,181 million yen, or 48.1% of consolidated net sales. In the Railways segment, orders from JR East and other JR companies as well as private railway companies were robust, recording a major increase from the previous year’s record-high result, and both net sales and operating profit reached record highs on improved construction efficiency and pass-through of rising commodity prices. On a non-consolidated basis, JR projects in FY2025 produced orders of 80.7 billion yen against a year-beginning plan of 69.0 billion yen.
In the Buildings segment, the company received multiple orders for large-scale construction such as large-scale redevelopment around stations and data centers, leading to a significant increase in total orders to a record high; net sales also reached a record high. Non-consolidated orders valued at 2.0 billion yen or more numbered 8 projects totalling 37.7 billion yen in FY2025, against 3 projects totalling 8.1 billion yen in FY2024. Within non-consolidated Buildings orders by facility type, office buildings accounted for 26,849 million yen (30.3%), commercial, distribution and factories 21,545 million yen (24.3%) and data centers 11,672 million yen (13.2%), out of a total of 88,665 million yen. In I&C Systems, net sales and profit both increased on contributions from infrastructure sharing projects and network construction, although orders decreased after a reactionary decline following a large-scale network project order in FY2024. Environmental Energy saw higher net sales but lower operating profit due to the impact of certain low-margin projects.
| Segment (million yen) | Metric | FY2024 | FY2025 |
|---|---|---|---|
| Railways | Orders | 120,114 | 137,016 |
| Railways | Net sales | 117,160 | 120,127 |
| Railways | Operating profit | 8,986 | 9,939 |
| Buildings | Orders | 58,808 | 89,219 |
| Buildings | Net sales | 60,092 | 64,522 |
| Buildings | Operating profit | 4,267 | 9,107 |
| I&C Systems | Orders | 33,885 | 31,915 |
| I&C Systems | Net sales | 28,156 | 31,148 |
| I&C Systems | Operating profit | 2,325 | 2,595 |
| Environmental Energy | Orders | 6,771 | 4,184 |
| Environmental Energy | Net sales | 5,378 | 5,962 |
| Environmental Energy | Operating profit | 684 | 241 |
| Associated Business | Orders | 4,137 | 5,033 |
| Associated Business | Net sales | 6,134 | 7,446 |
| Associated Business | Operating profit | 1,670 | 1,676 |
Operating profit margins by segment in FY2025 were 8.3% for Railways (7.7% in FY2024), 14.1% for Buildings (7.1%), 8.3% for I&C Systems (8.3%), 4.1% for Environmental Energy (12.7%) and 22.5% for Associated Business (27.2%). Segment classifications were revised effective Q2 of FY2024, and results for FY2023 and later are based on the classifications after the revision.
FY2026 Forecast
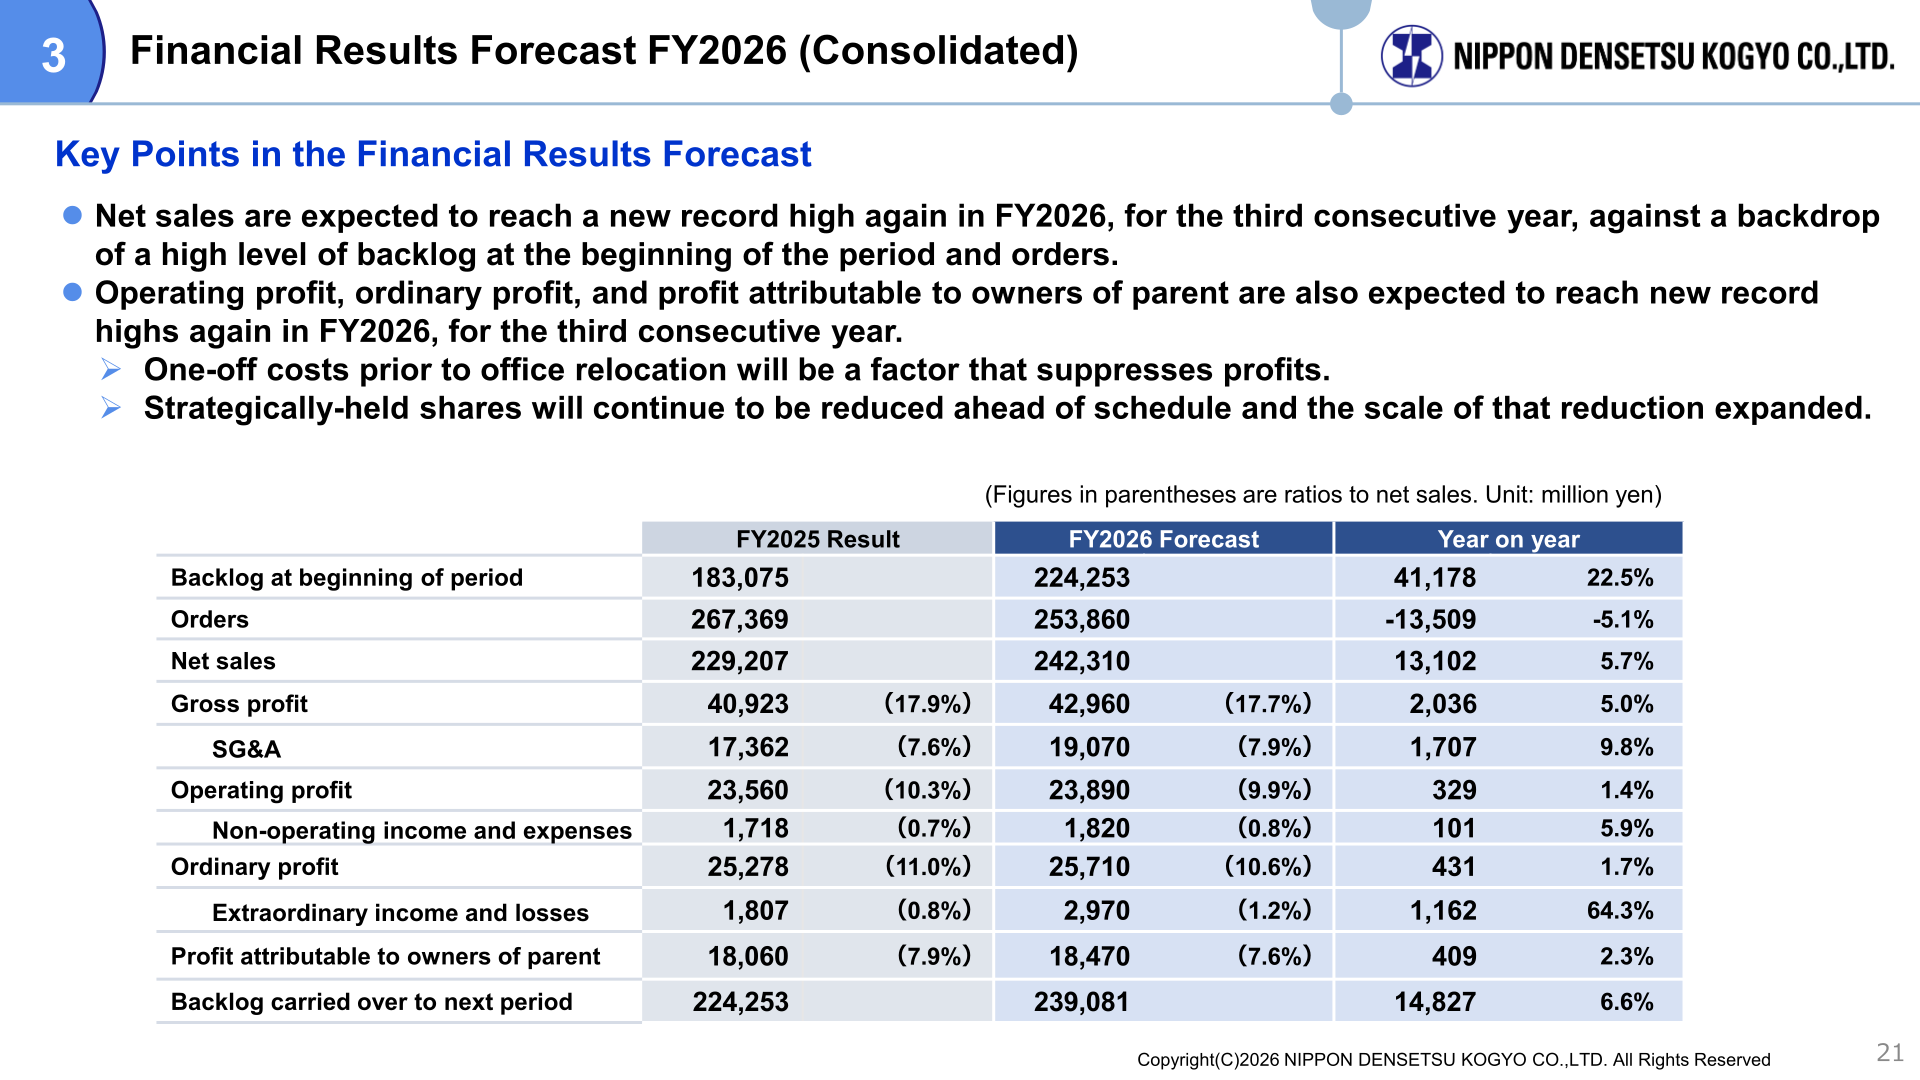
For FY2026, the fiscal year ending March 31, 2027, the company expects net sales to reach a new record high for the third consecutive year against a backdrop of a high level of backlog at the beginning of the period and orders, and expects operating profit, ordinary profit and profit attributable to owners of parent also to reach new record highs for the third consecutive year. One-off costs prior to office relocation are cited as a factor that will suppress profits, and the company states that strategically-held shares will continue to be reduced ahead of schedule with the scale of that reduction expanded.
| Item (million yen) | FY2025 Result | FY2026 Forecast | Year on year |
|---|---|---|---|
| Backlog at beginning of period | 183,075 | 224,253 | 41,178 (22.5%) |
| Orders | 267,369 | 253,860 | -13,509 (-5.1%) |
| Net sales | 229,207 | 242,310 | 13,102 (5.7%) |
| Gross profit | 40,923 (17.9%) | 42,960 (17.7%) | 2,036 (5.0%) |
| SG&A | 17,362 (7.6%) | 19,070 (7.9%) | 1,707 (9.8%) |
| Operating profit | 23,560 (10.3%) | 23,890 (9.9%) | 329 (1.4%) |
| Non-operating income and expenses | 1,718 (0.7%) | 1,820 (0.8%) | 101 (5.9%) |
| Ordinary profit | 25,278 (11.0%) | 25,710 (10.6%) | 431 (1.7%) |
| Extraordinary income and losses | 1,807 (0.8%) | 2,970 (1.2%) | 1,162 (64.3%) |
| Profit attributable to owners of parent | 18,060 (7.9%) | 18,470 (7.6%) | 409 (2.3%) |
| Backlog carried over to next period | 224,253 | 239,081 | 14,827 (6.6%) |
By segment, the FY2026 forecast calls for Railways net sales of 128,310 million yen and operating profit of 10,480 million yen, Buildings net sales of 69,710 million yen and operating profit of 9,110 million yen, I&C Systems net sales of 32,800 million yen and operating profit of 2,840 million yen, Environmental Energy net sales of 4,130 million yen and operating profit of 290 million yen, and Associated Business net sales of 7,360 million yen and operating profit of 1,170 million yen. Segment orders are forecast at 126,030 million yen for Railways, 86,490 million yen for Buildings, 32,100 million yen for I&C Systems, 5,410 million yen for Environmental Energy and 3,830 million yen for Associated Business.
Shareholder Returns
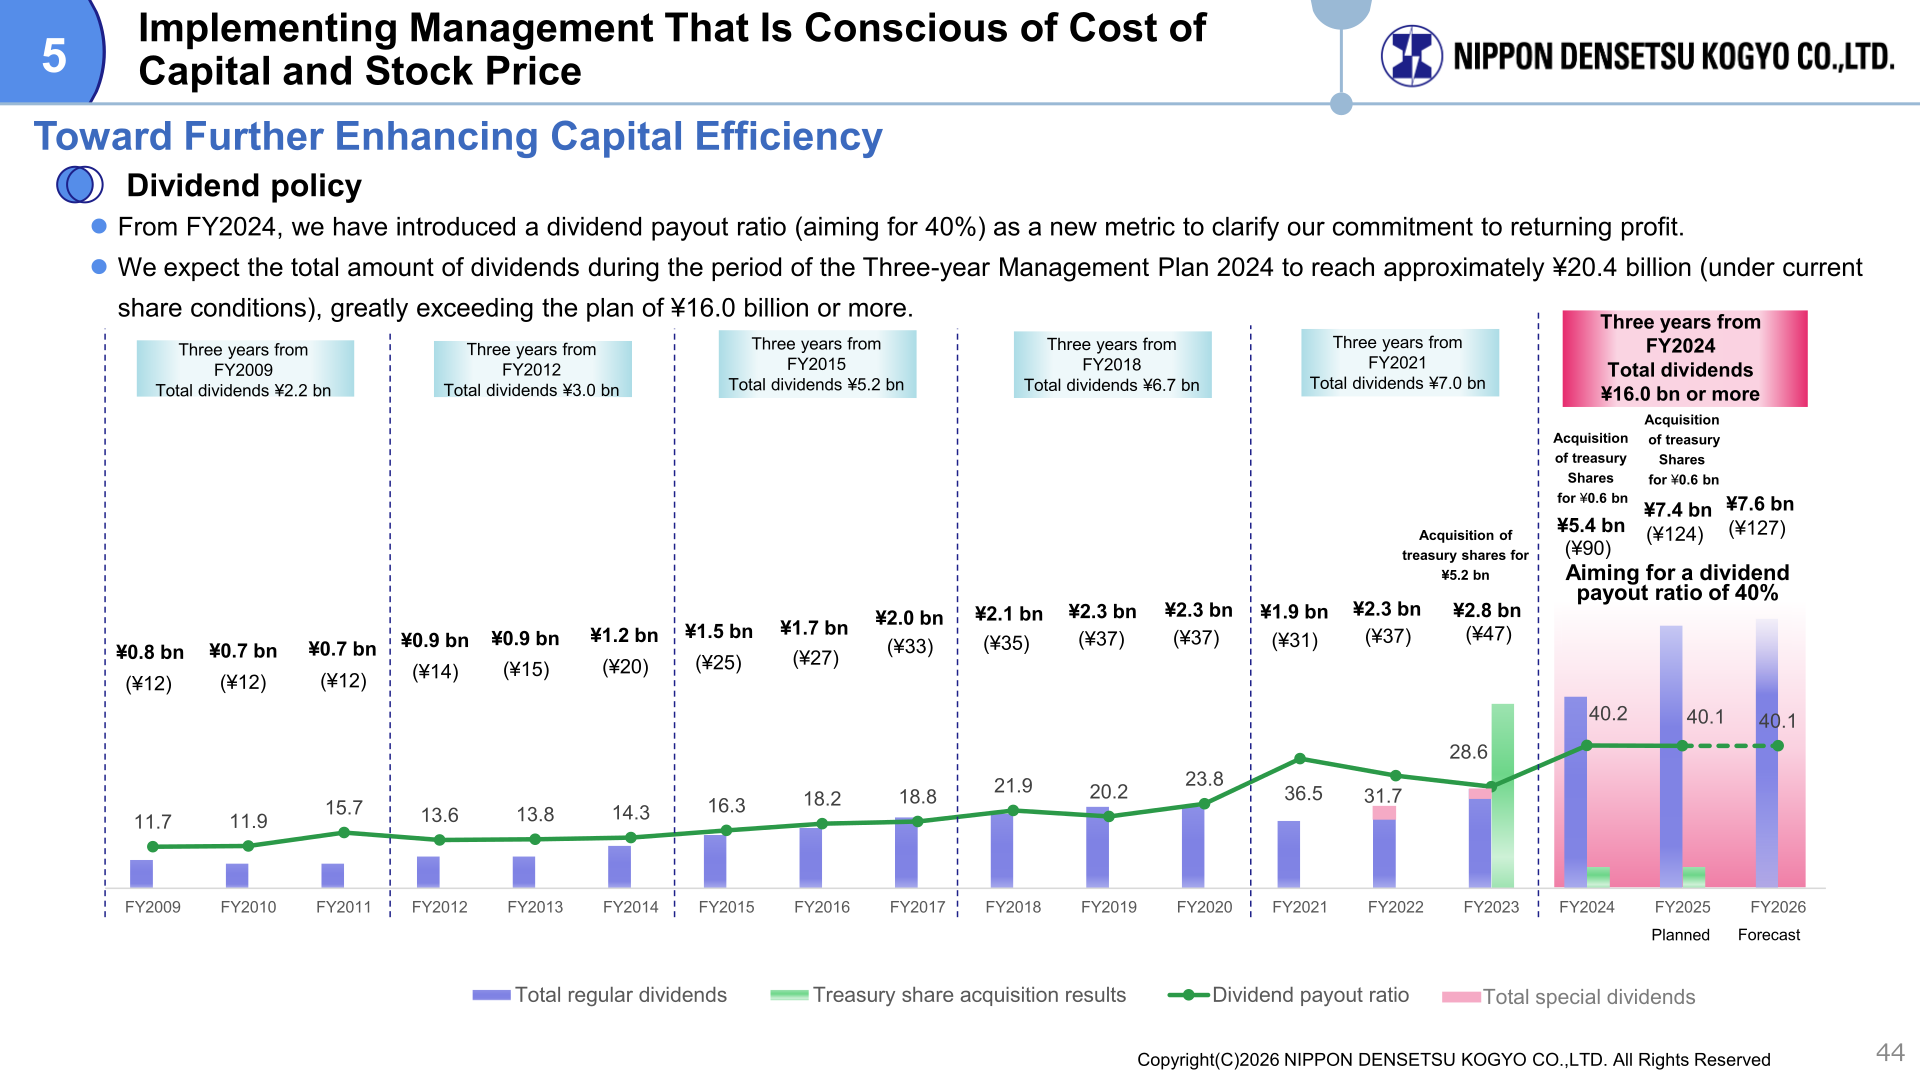
The FY2025 dividend is planned at 124 yen per share, an increase of 34 yen from 90 yen in the previous fiscal year and an increase of 9 yen from the most recent forecast amount of 115 yen, with a dividend payout ratio of 40.1%. From FY2024 the company introduced a dividend payout ratio, aiming for 40%, as a new metric to clarify its commitment to returning profit. Total dividends over the period of the NIPPON DENSETSU Three-year Management Plan 2024 are expected to reach approximately 20.4 billion yen under current share conditions, greatly exceeding the plan of 16.0 billion yen or more. The company also states that it will consider and implement additional acquisition of treasury shares while being conscious of the balance between growth investments and shareholder returns.
| Item | FY2024 | FY2025 | FY2026 (Forecast) |
|---|---|---|---|
| Total regular dividends per share | 90 yen | 124 yen | 127 yen |
| Total regular dividends | 5.4 billion yen | 7.4 billion yen | 7.6 billion yen |
| Dividend payout ratio | 40.2% | 40.1% | 40.1% |
Medium-Term Plan and Capital Efficiency
Under the NIPPON DENSETSU Three-year Management Plan 2024, covering FY2024 to FY2026 (the 83rd to 85th terms), the FY2026 targets are net sales of 238.0 billion yen, operating profit of 18.4 billion yen, ROE of 8% and market capitalization of 200.0 billion yen; the company states it expects all figures to be achieved. The longer-term NDK Vision90 targets for FY2031 (the 90th term) are net sales of 260.0 billion yen, operating profit of 20.0 billion yen, ROE of 10% or more and market capitalization of 230.0 billion yen, and the company plans to review these in the next medium-term management plan.
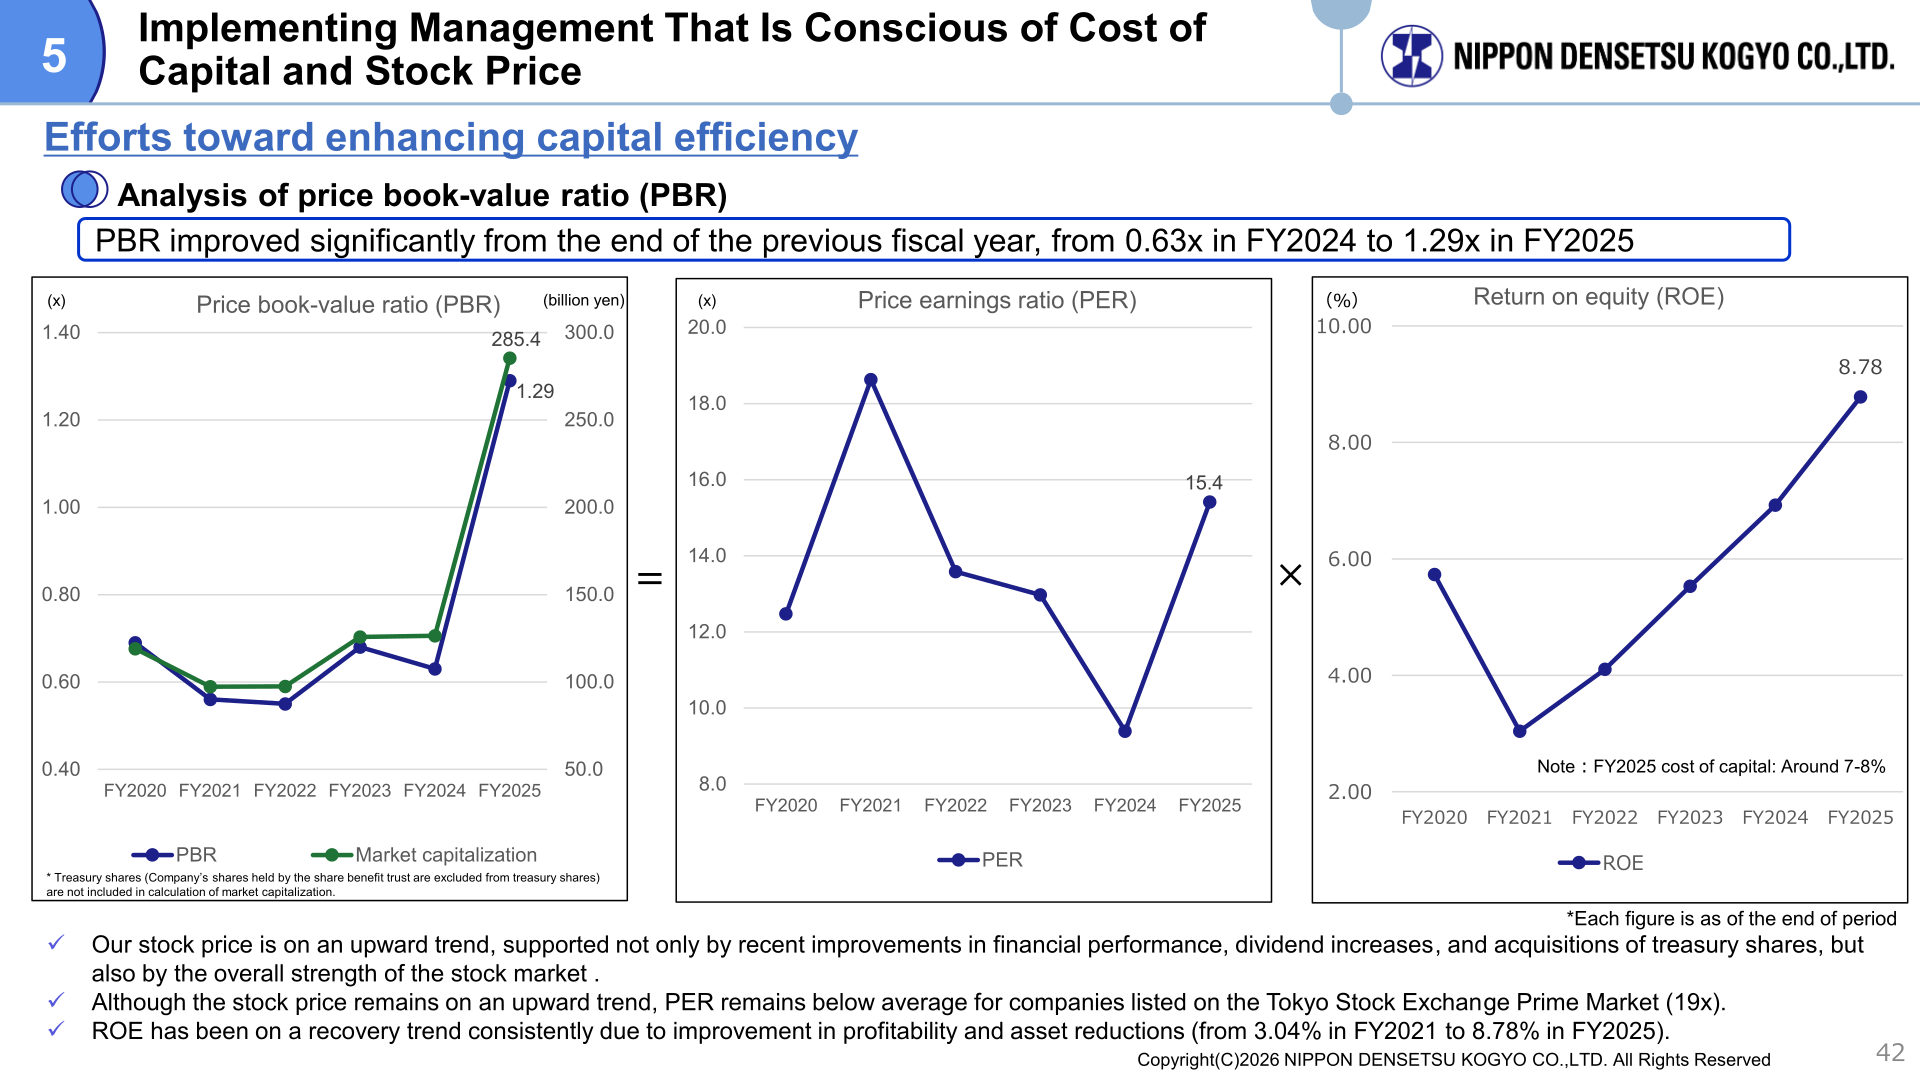
On capital efficiency, ROE recovered to 8.78% in FY2025 from 3.04% in FY2021, with the DuPont breakdown showing a profit margin of 7.88%, an asset turnover ratio of 0.69 times and financial leverage of 1.55 times. PBR improved from 0.63x at the end of FY2024 to 1.29x at the end of FY2025, PER stood at 15.4x, which the company notes remains below the average for companies listed on the Tokyo Stock Exchange Prime Market of 19x, and market capitalization was 285.4 billion yen. The cost of capital for FY2025 is stated as around 7-8%. On strategically-held shares, a 20% reduction has been achieved, from 32 stocks in FY2023 to 25 stocks in FY2025, with a total sale amount of 4.3 billion yen; the company plans a 70% reduction by FY2029 compared with FY2023 and will continue reducing after FY2026 from 25 stocks to around 10 stocks.
Topics
In securing human resources, the company hired 121 new graduates in FY2025 against a plan of 120, an increase of 28 from the previous fiscal year, and 15 mid-career hires against a plan of 26. The number of construction workers, defined as those directly involved in supervising construction works on-site, was 1,348 in FY2025 versus 1,325 in FY2023, an increase of 1.7%, against a FY2031 target of increasing construction workers by 20% compared with FY2023. Plans for FY2026 call for 120 new graduate hires to join in April 2027 and 26 mid-career hires. In productivity, operational use of generative AI (Microsoft Copilot) expanded from 370 users in April 2025 to 1,500 users in March 2026, and non-consolidated gross profit on completed construction contracts per construction worker rose to 23 million yen in FY2025 from 19 million yen in FY2024. In the Associated Business segment, the company entered into a shareholders’ agreement with Ishizaka Inc. toward establishment of a metal recycling joint-venture company and established the subsidiary JCroc Co., Ltd. in October 2025 to handle the infrastructure sharing business.
This article is an analysis based on publicly available information and is not a recommendation to buy or sell any specific securities. Investment decisions are your own responsibility.
















