
This article is based on publicly available IR materials and is not a recommendation to buy or sell any specific securities.
Note: JDC Corporation closes its books on May 31. This article covers the fiscal year ended May 31, 2026, which the company labels “FY 2025-2026” (and “FY 2026” on the cover of its presentation); it is classified as FY2025 under this site’s convention, and all labels in the text, tables and segment data below are kept exactly as the company reports them.
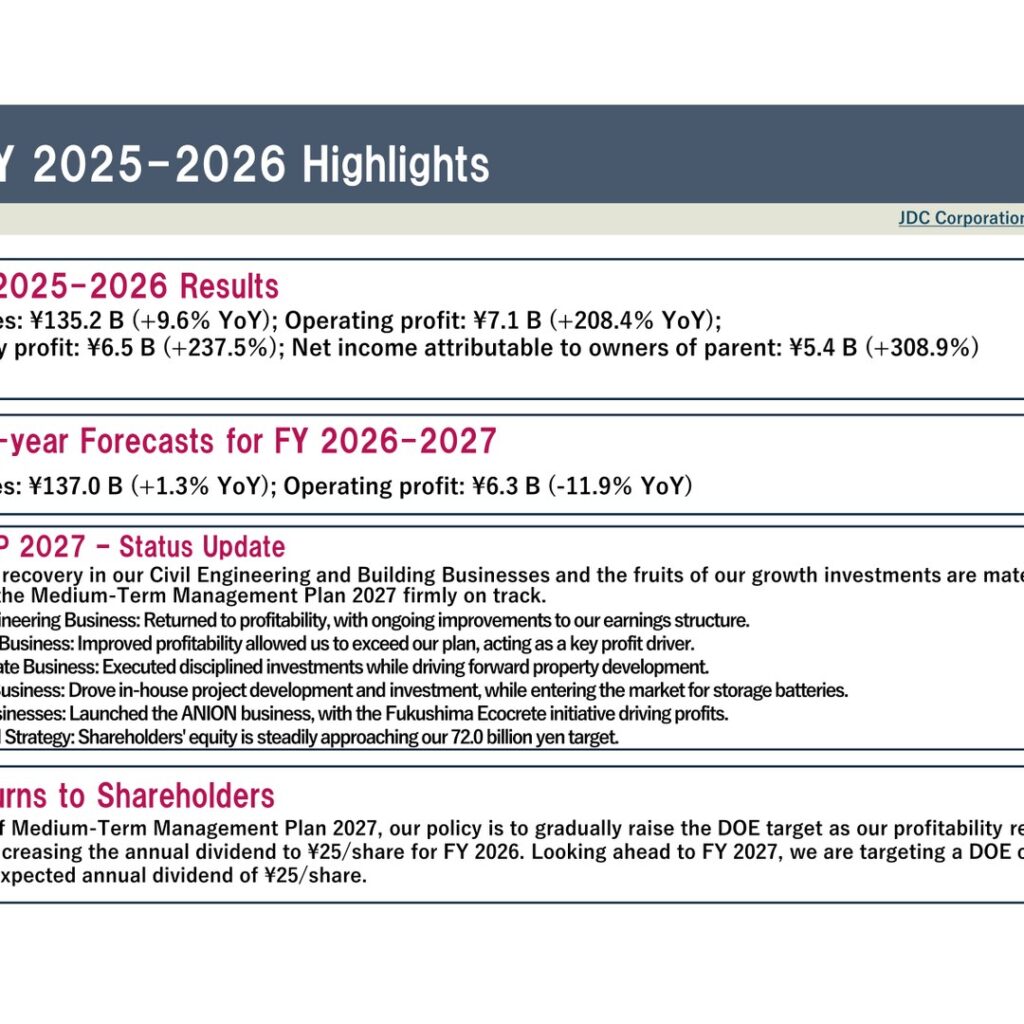
JDC Corporation reported net sales of ¥135.2 B (+9.6% YoY) and operating profit of ¥7.1 B (+208.4% YoY) for FY 2025-2026, with ordinary profit of ¥6.5 B (+237.5%) and net income attributable to owners of parent of ¥5.4 B (+308.9%). Profit exceeded the full-year forecast the company had revised on April 14, 2026, driven by the Building Business, while the Civil Engineering Business returned to profitability. For FY 2026-2027 the company guides for net sales of ¥137.0 B (+1.3% YoY) and operating profit of ¥6.3 B (-11.9% YoY), and it raised the annual dividend to ¥25 per share for FY 2026.
Consolidated Results (Full-Year Actual)
All four headline lines grew year on year, and each came in above the full-year forecast that had been revised on April 14, 2026. Operating profit of ¥7,150 M compares with a revised forecast of ¥6,000 M, and profit attributable to owners of parent of ¥5,450 M compares with a revised forecast of ¥4,000 M.
| (Unit: ¥ M) | FY 2025-2026 Results | LFY Results FY 2024-2025 | Year-on-Year | FY 2025-2026 Full-year Forecast (Revised 04/14/2026) |
|---|---|---|---|---|
| Net Sales | 135,207 | 123,349 | 11,858 | 136,000 |
| Operating Profit | 7,150 | 2,318 | 4,832 | 6,000 |
| Ordinary Profit | 6,566 | 1,945 | 4,621 | 5,600 |
| Profit Attributable to Owners of Parent | 5,450 | 1,332 | 4,118 | 4,000 |
Segment Results
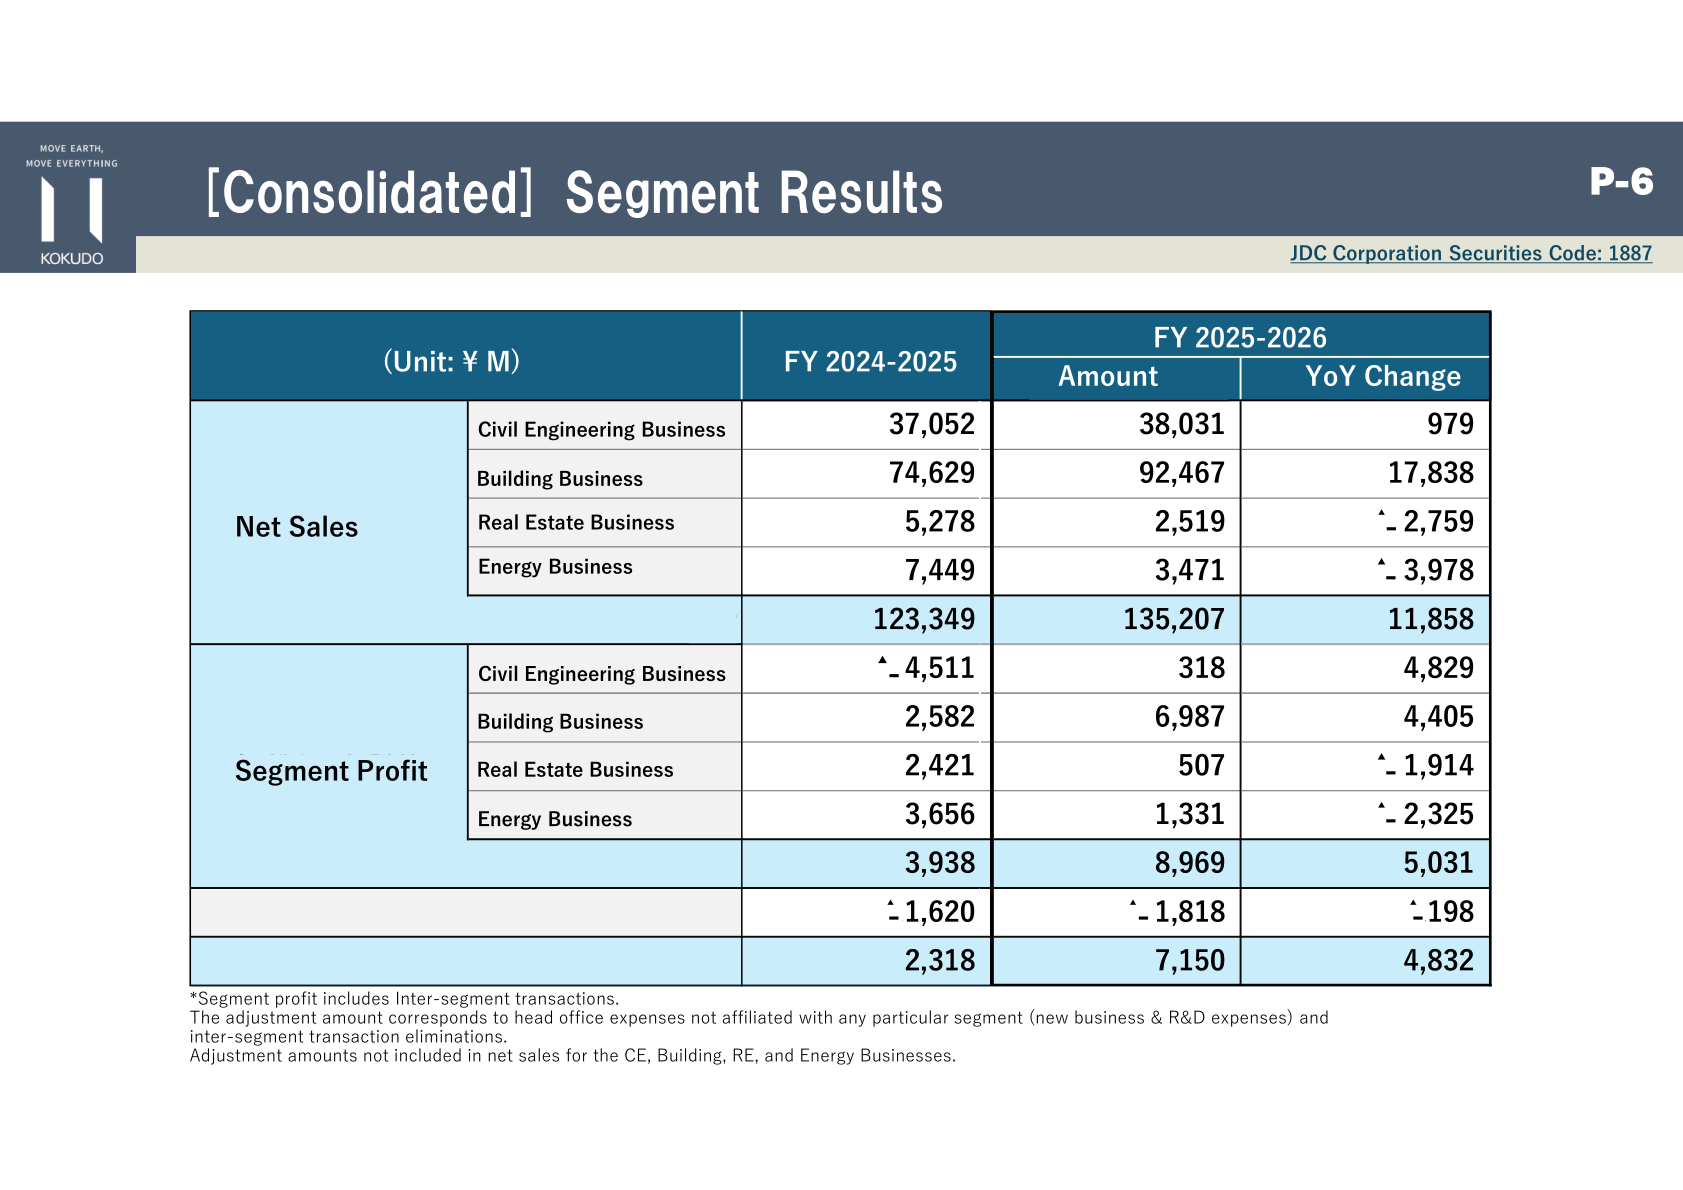
The Building Business was the main driver, with net sales up ¥17,838 M to ¥92,467 M and segment profit up ¥4,405 M to ¥6,987 M. The Civil Engineering Business swung from a segment loss of ▲¥4,511 M to a profit of ¥318 M. The Real Estate and Energy Businesses both declined, with Energy facing a difficult comparison against the sale of power generation facilities in FY 2024-2025. Segment profit includes inter-segment transactions; the adjustment amount corresponds to head office expenses not affiliated with any particular segment (new business and R&D expenses) and inter-segment transaction eliminations.
| (Unit: ¥ M) | Segment | FY 2025-2026 | FY 2024-2025 | YoY Change |
|---|---|---|---|---|
| Net Sales | Civil Engineering Business | 38,031 | 37,052 | 979 |
| Net Sales | Building Business | 92,467 | 74,629 | 17,838 |
| Net Sales | Real Estate Business | 2,519 | 5,278 | ▲2,759 |
| Net Sales | Energy Business | 3,471 | 7,449 | ▲3,978 |
| Net Sales | Total | 135,207 | 123,349 | 11,858 |
| Segment Profit | Civil Engineering Business | 318 | ▲4,511 | 4,829 |
| Segment Profit | Building Business | 6,987 | 2,582 | 4,405 |
| Segment Profit | Real Estate Business | 507 | 2,421 | ▲1,914 |
| Segment Profit | Energy Business | 1,331 | 3,656 | ▲2,325 |
| Segment Profit | Total | 8,969 | 3,938 | 5,031 |
| Adjustments | – | ▲1,818 | ▲1,620 | ▲198 |
| Operating Profit | – | 7,150 | 2,318 | 4,832 |
On orders and backlog, consolidated orders for FY 2025-2026 totalled ¥126,141 M (▲15.2% YoY), with the Civil Engineering Business at ¥26,818 M (▲31.6%) and the Building Business at ¥99,323 M (▲8.7%). The order backlog at the end of the year stood at ¥193,681 M (▲18,932 YoY), of which Civil Engineering accounted for ¥68,672 M and the Building Business ¥125,009 M. For FY 2026-2027 the company forecasts orders of ¥163,000 M (+36,859, +29.2%) and a year-end backlog of ¥228,681 M (+35,000).
Balance Sheet
Total assets grew ¥17,326 M to ¥157,975 M, with current assets up ¥17,183 M to ¥129,792 M (82.2% of total assets) and non-current assets up ¥144 M to ¥28,183 M. Total liabilities rose ¥12,361 M to ¥86,580 M, of which interest-bearing debt increased from ¥30,022 M to ¥37,914 M. Net assets rose ¥4,966 M to ¥71,395 M, and the equity ratio moved from 47.1% to 45.1%.
Next Fiscal Year Forecast (FY 2026-2027)
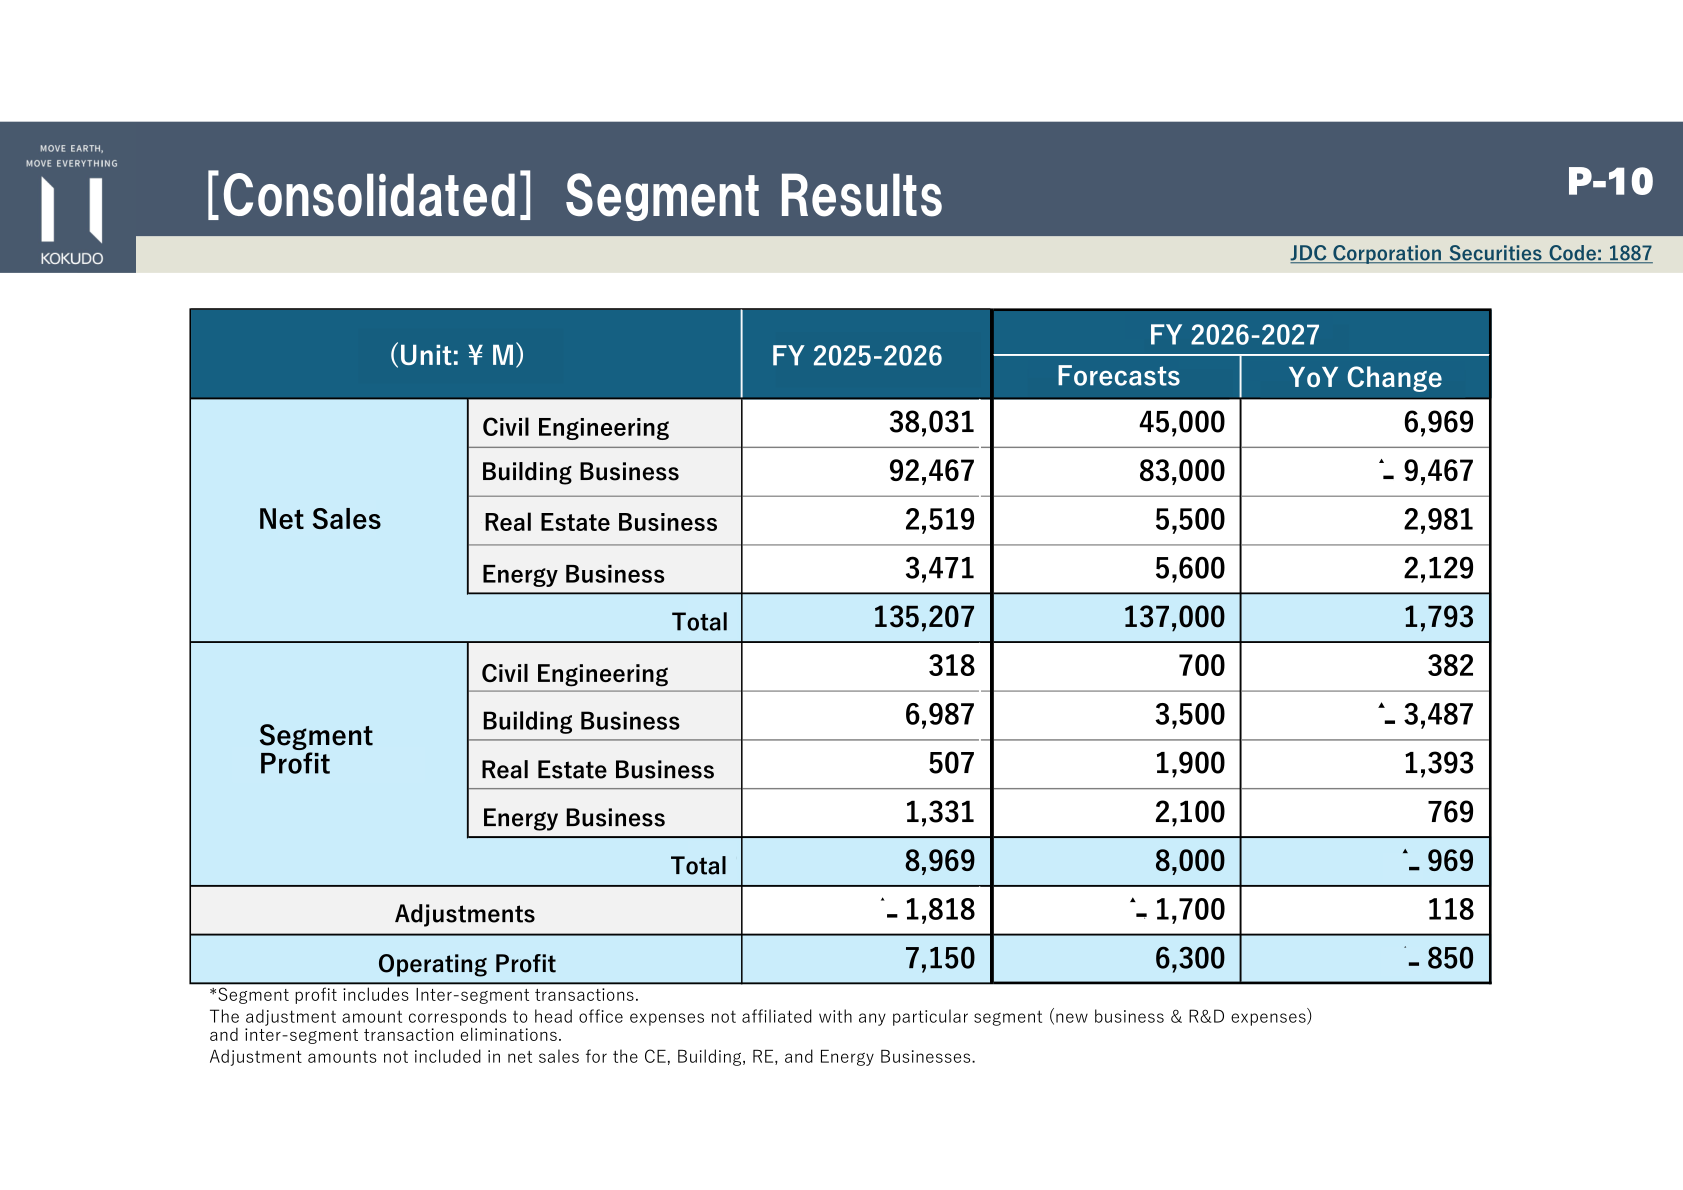
The company guides for net sales of ¥137,000 M (+1.3%) but lower profits, with operating profit of ¥6,300 M (▲11.9%), ordinary profit of ¥5,700 M (▲13.2%) and profit attributable to owners of parent of ¥4,000 M (▲26.6%). By segment, the Civil Engineering Business is expected to grow net sales to ¥45,000 M on a favourable order environment, while the Building Business plan takes a conservative view on the completed construction revenue recognised from its backlog, with net sales of ¥83,000 M and segment profit of ¥3,500 M.
| (Unit: ¥ M) | FY 2026-2027 Forecast | FY 2025-2026 | YoY Change | Change (%) |
|---|---|---|---|---|
| Net Sales | 137,000 | 135,207 | 1,793 | 1.3% |
| Operating Profit | 6,300 | 7,150 | ▲850 | ▲11.9% |
| (Operating Profit Margin) | (4.6%) | (5.3%) | – | – |
| Ordinary Profit | 5,700 | 6,566 | ▲866 | ▲13.2% |
| Profit Attributable to Owners of Parent | 4,000 | 5,450 | ▲1,450 | ▲26.6% |
| Net Sales: Civil Engineering | 45,000 | 38,031 | 6,969 | – |
| Net Sales: Building Business | 83,000 | 92,467 | ▲9,467 | – |
| Net Sales: Real Estate Business | 5,500 | 2,519 | 2,981 | – |
| Net Sales: Energy Business | 5,600 | 3,471 | 2,129 | – |
| Segment Profit: Civil Engineering | 700 | 318 | 382 | – |
| Segment Profit: Building Business | 3,500 | 6,987 | ▲3,487 | – |
| Segment Profit: Real Estate Business | 1,900 | 507 | 1,393 | – |
| Segment Profit: Energy Business | 2,100 | 1,331 | 769 | – |
| Segment Profit: Total | 8,000 | 8,969 | ▲969 | – |
| Adjustments | ▲1,700 | ▲1,818 | 118 | – |
Shareholder Returns
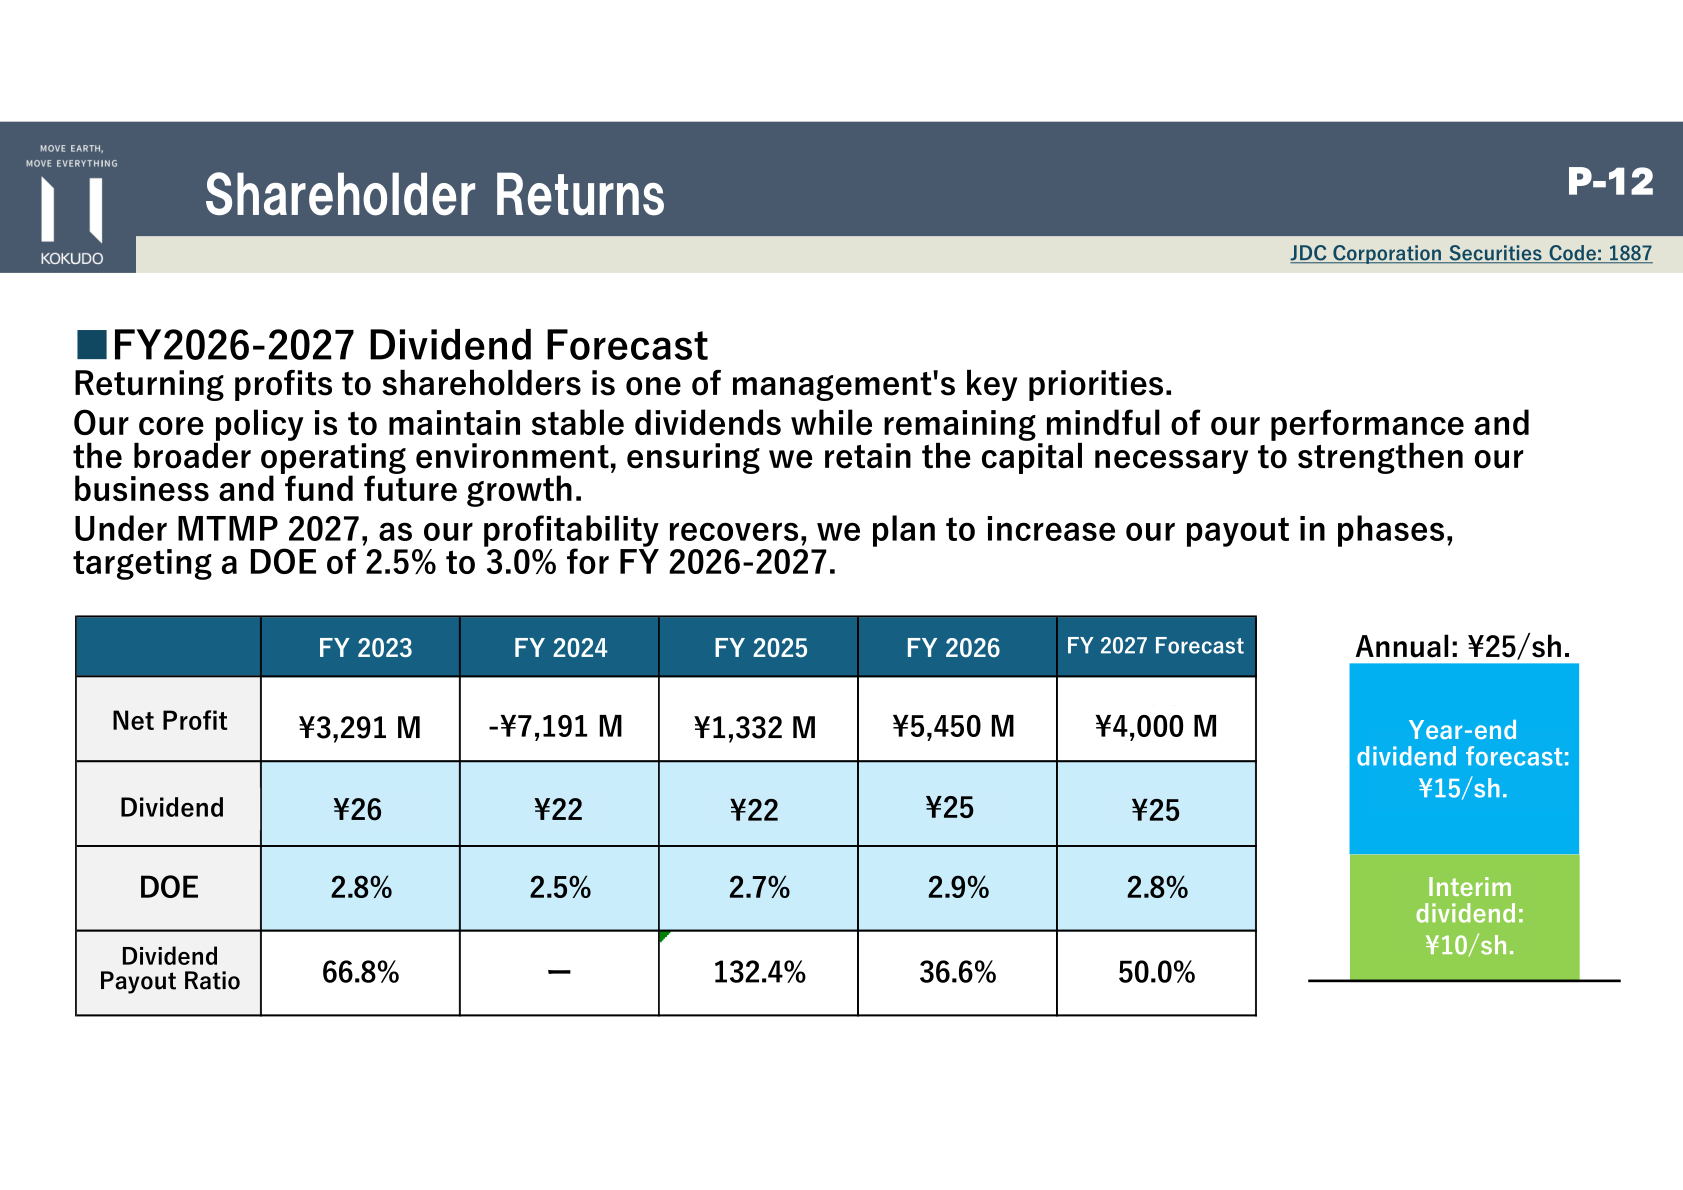
The company states that returning profits to shareholders is one of management’s key priorities, and that its core policy is to maintain stable dividends while remaining mindful of performance and the broader operating environment, ensuring it retains the capital necessary to strengthen the business and fund future growth. Under MTMP 2027, as profitability recovers, it plans to increase the payout in phases, targeting a DOE of 2.5% to 3.0% for FY 2026-2027. The annual dividend was raised to ¥25 per share for FY 2026, and the FY 2027 forecast is also an annual ¥25 per share, comprising an interim dividend of ¥10 per share and a year-end dividend forecast of ¥15 per share.
| Item | FY 2023 | FY 2024 | FY 2025 | FY 2026 | FY 2027 Forecast |
|---|---|---|---|---|---|
| Net Profit | ¥3,291 M | -¥7,191 M | ¥1,332 M | ¥5,450 M | ¥4,000 M |
| Dividend | ¥26 | ¥22 | ¥22 | ¥25 | ¥25 |
| DOE | 2.8% | 2.5% | 2.7% | 2.9% | 2.8% |
| Dividend Payout Ratio | 66.8% | – | 132.4% | 36.6% | 50.0% |
Medium-Term Management Plan 2027 — Status Update
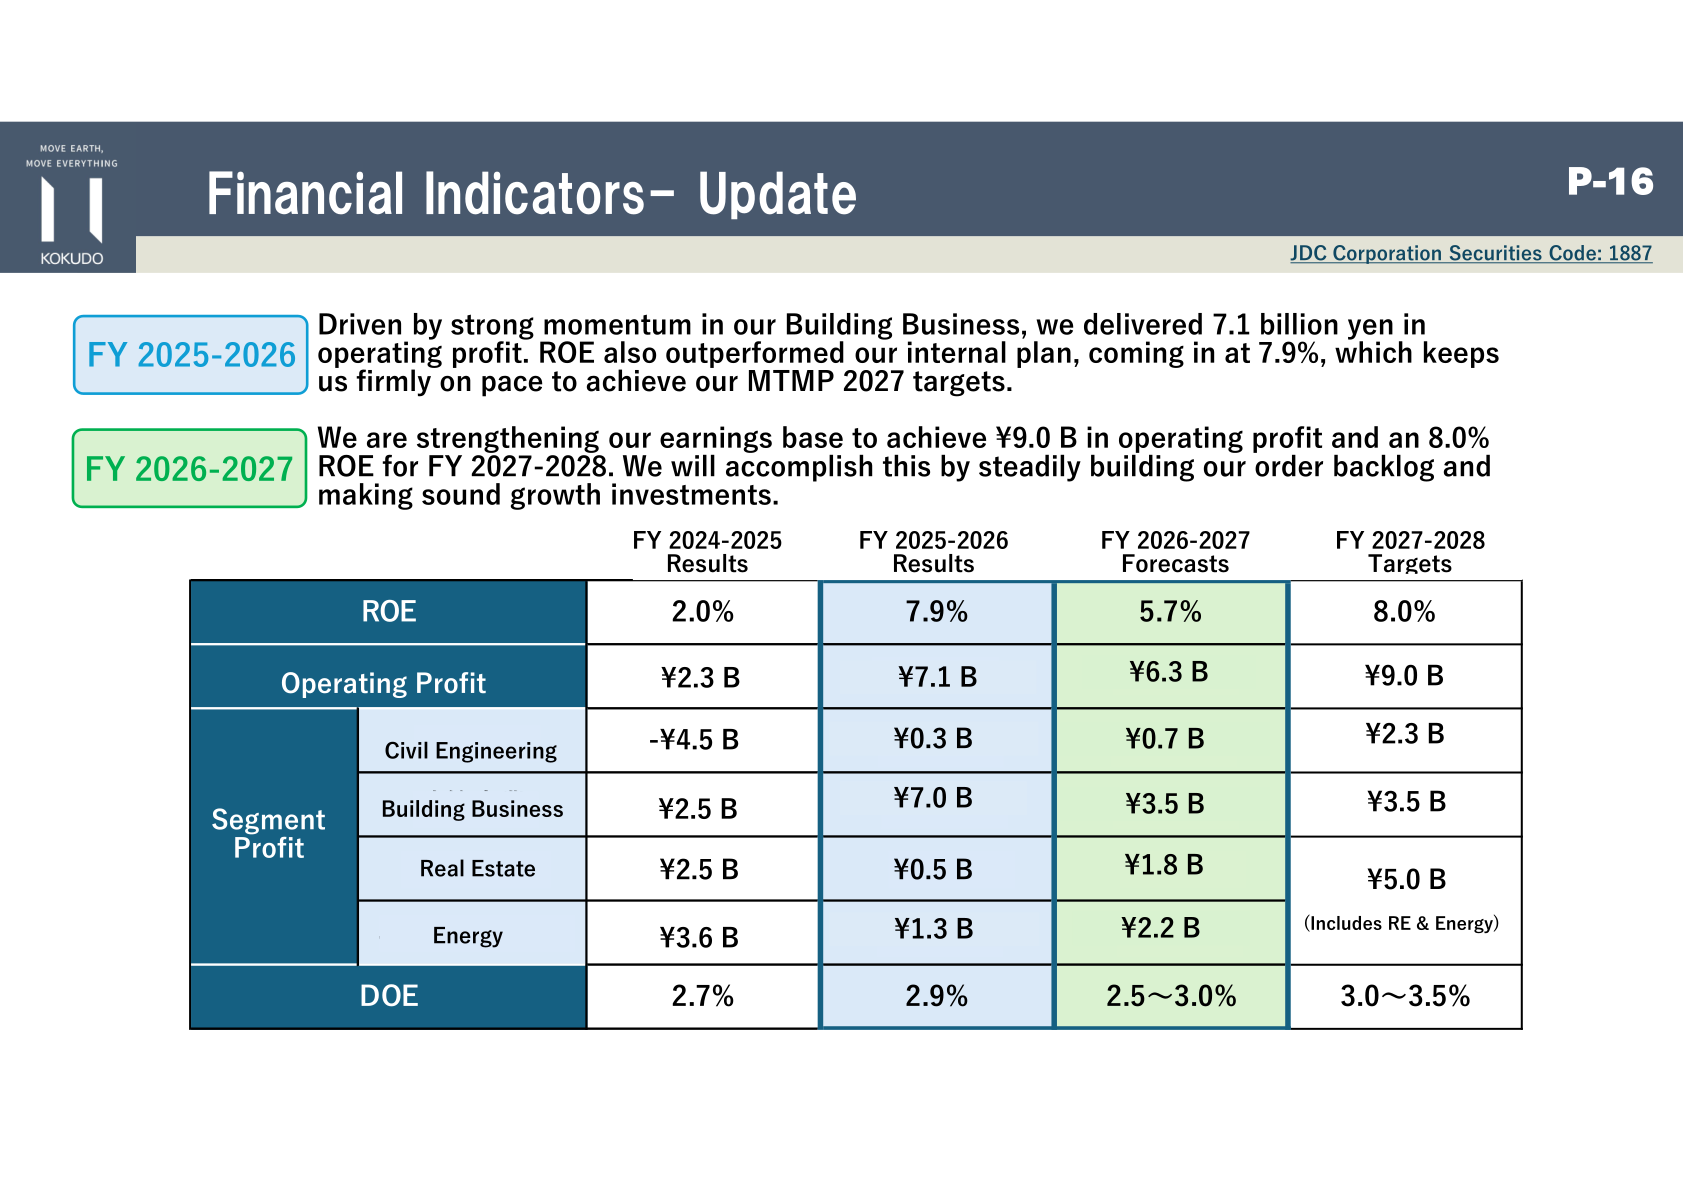
The company says earnings recovery in the Civil Engineering and Building Businesses and the fruits of its growth investments are materializing, keeping Medium-Term Management Plan 2027 firmly on track. ROE outperformed the internal plan at 7.9%, and the company is strengthening its earnings base to achieve ¥9.0 B in operating profit and an 8.0% ROE for FY 2027-2028.
| Item | FY 2024-2025 Results | FY 2025-2026 Results | FY 2026-2027 Forecasts | FY 2027-2028 Targets |
|---|---|---|---|---|
| ROE | 2.0% | 7.9% | 5.7% | 8.0% |
| Operating Profit | ¥2.3 B | ¥7.1 B | ¥6.3 B | ¥9.0 B |
| Segment Profit: Civil Engineering | -¥4.5 B | ¥0.3 B | ¥0.7 B | ¥2.3 B |
| Segment Profit: Building Business | ¥2.5 B | ¥7.0 B | ¥3.5 B | ¥3.5 B |
| Segment Profit: Real Estate | ¥2.5 B | ¥0.5 B | ¥1.8 B | ¥5.0 B (Includes RE & Energy) |
| Segment Profit: Energy | ¥3.6 B | ¥1.3 B | ¥2.2 B | ¥5.0 B (Includes RE & Energy) |
| DOE | 2.7% | 2.9% | 2.5~3.0% | 3.0~3.5% |
On financial strategy, equity capital grew to ¥71.1 B against the MTMP 2027 target of ¥72.0 B, the equity ratio was 45.1% and the D/E ratio was 0.53x. In the first year of MTMP 2027 the company deployed ¥14.2 B toward growth initiatives against a three-year investment plan of ¥74.0 B: ¥7.70 B of a planned ¥42.0 B in real estate development investment, ¥4.50 B of ¥22.0 B in energy development investment, ¥0.50 B of ¥1.80 B in R&D, and ¥1.50 B of ¥8.20 B in new businesses, M&A, DX investment and other items.
By business, the company reports that tighter risk management and strict preventive controls meant zero major unprofitable projects in the Civil Engineering Business in FY 2025-2026, although segment profit of ¥300 M fell short of the ¥600 M target because completed construction revenue at group companies missed plan. The Building Business exceeded expectations on large projects ordered in FY 2024-2025 and has secured a backlog of ¥125 billion. The Real Estate Business fell just short of plan because of a shift in the timing of property sales, and the Energy Business faced a difficult year-on-year comparison created by a FY 2024-2025 facility sale while recurring electricity sales held steady. In new businesses, the ANION business has entered its commercialization phase and the Fukushima Ecocrete coal ash recycling business continues to deliver consistent profits.
This article is an analysis based on publicly available information and is not a recommendation to buy or sell any specific securities. Investment decisions are your own responsibility.
















