
This article is based on publicly available IR materials and is not a recommendation to buy or sell any specific securities.
Note: Nihon House Holdings does not publish an English results presentation; this article is an English translation of the Japanese-language article on our sister site Investalk, which is based on the company’s Japanese-language IR materials, with figures transcribed as reported. The company labels the period covered here as the fiscal year ended April 30, 2026 (the 58th term); this site classifies the most recently completed fiscal year as FY2025 in the title and slug, while the body text, tables and segment labels follow the company’s own labelling.
In Nihon House Holdings’ consolidated results for the fiscal year ended April 30, 2026 (the 58th term), net sales fell 15.3% year on year to 29,618 million yen (approximately 29.6 billion yen) as completed construction sales declined on a smaller order backlog in the housing business. On the other hand, on the back of lower retirement benefit expenses and improved occupancy in the hotel business, operating profit rose 1.9% year on year to 2,380 million yen and profit attributable to owners of parent rose 18.1% to 1,340 million yen, securing profit growth. Operating profit, ordinary profit and net profit all finished above the full-year plan.
Consolidated Results (Fiscal Year Ended April 30, 2026, Actual)
Net sales were 29,618 million yen, down 15.3% year on year, falling 4,302 million yen short of the full-year plan of 33,920 million yen. The gross profit margin improved to 45.4% from 42.0% in the previous fiscal year, and selling, general and administrative expenses were also compressed by 10.6% year on year. As a result, operating profit was 2,380 million yen (up 1.9% year on year, 800 million yen above plan), ordinary profit was 2,152 million yen (up 4.6%, 822 million yen above plan) and profit attributable to owners of parent was 1,340 million yen (up 18.1%, 640 million yen above plan), all exceeding the full-year plan.
| Item | 58th Term (Actual) | 57th Term (Actual) | YoY change |
|---|---|---|---|
| Net sales | 29,618 million yen | 34,980 million yen | -15.3% |
| Gross profit | 13,435 million yen (45.4% of net sales) | 14,701 million yen (42.0% of net sales) | -8.6% |
| Selling, general and administrative expenses | 11,054 million yen | 12,365 million yen | -10.6% |
| Operating profit | 2,380 million yen | 2,335 million yen | +1.9% |
| Ordinary profit | 2,152 million yen | 2,057 million yen | +4.6% |
| Profit attributable to owners of parent | 1,340 million yen | 1,135 million yen | +18.1% |
Segment Results
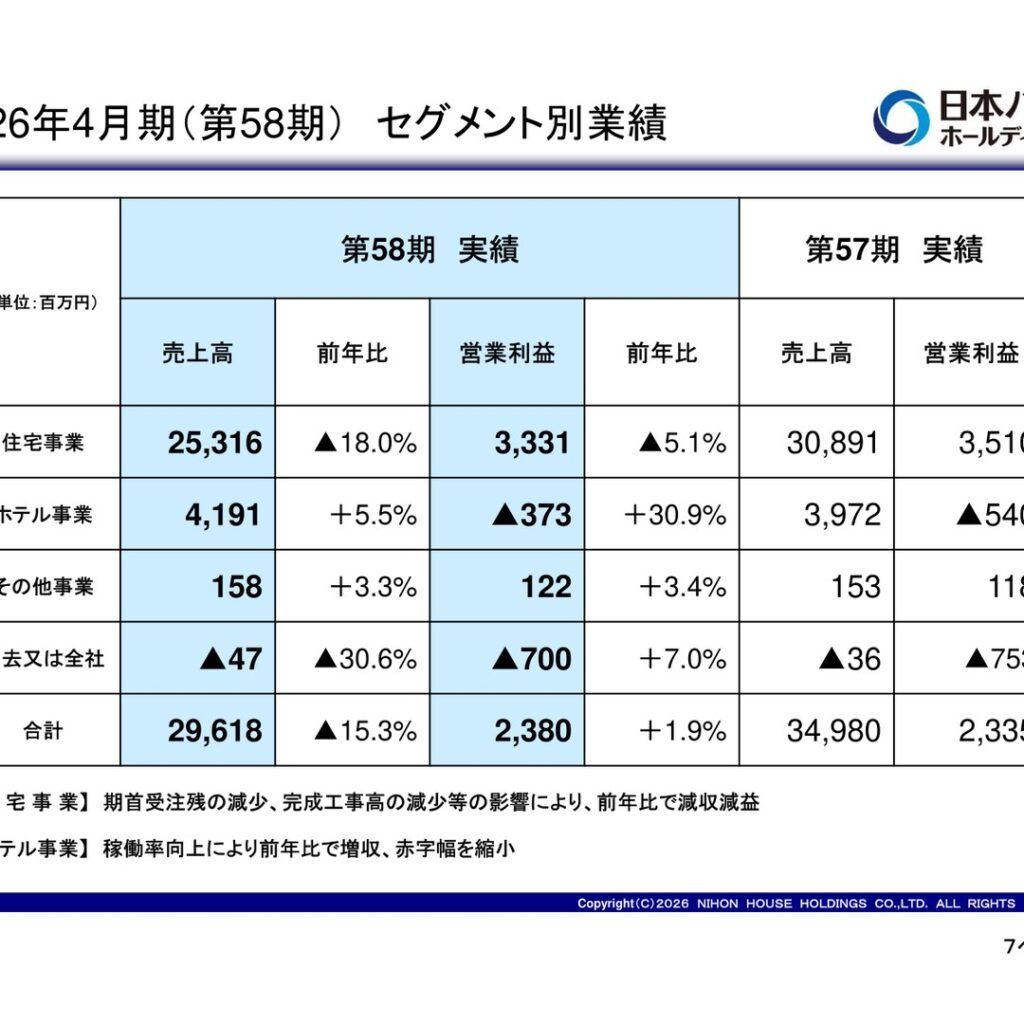
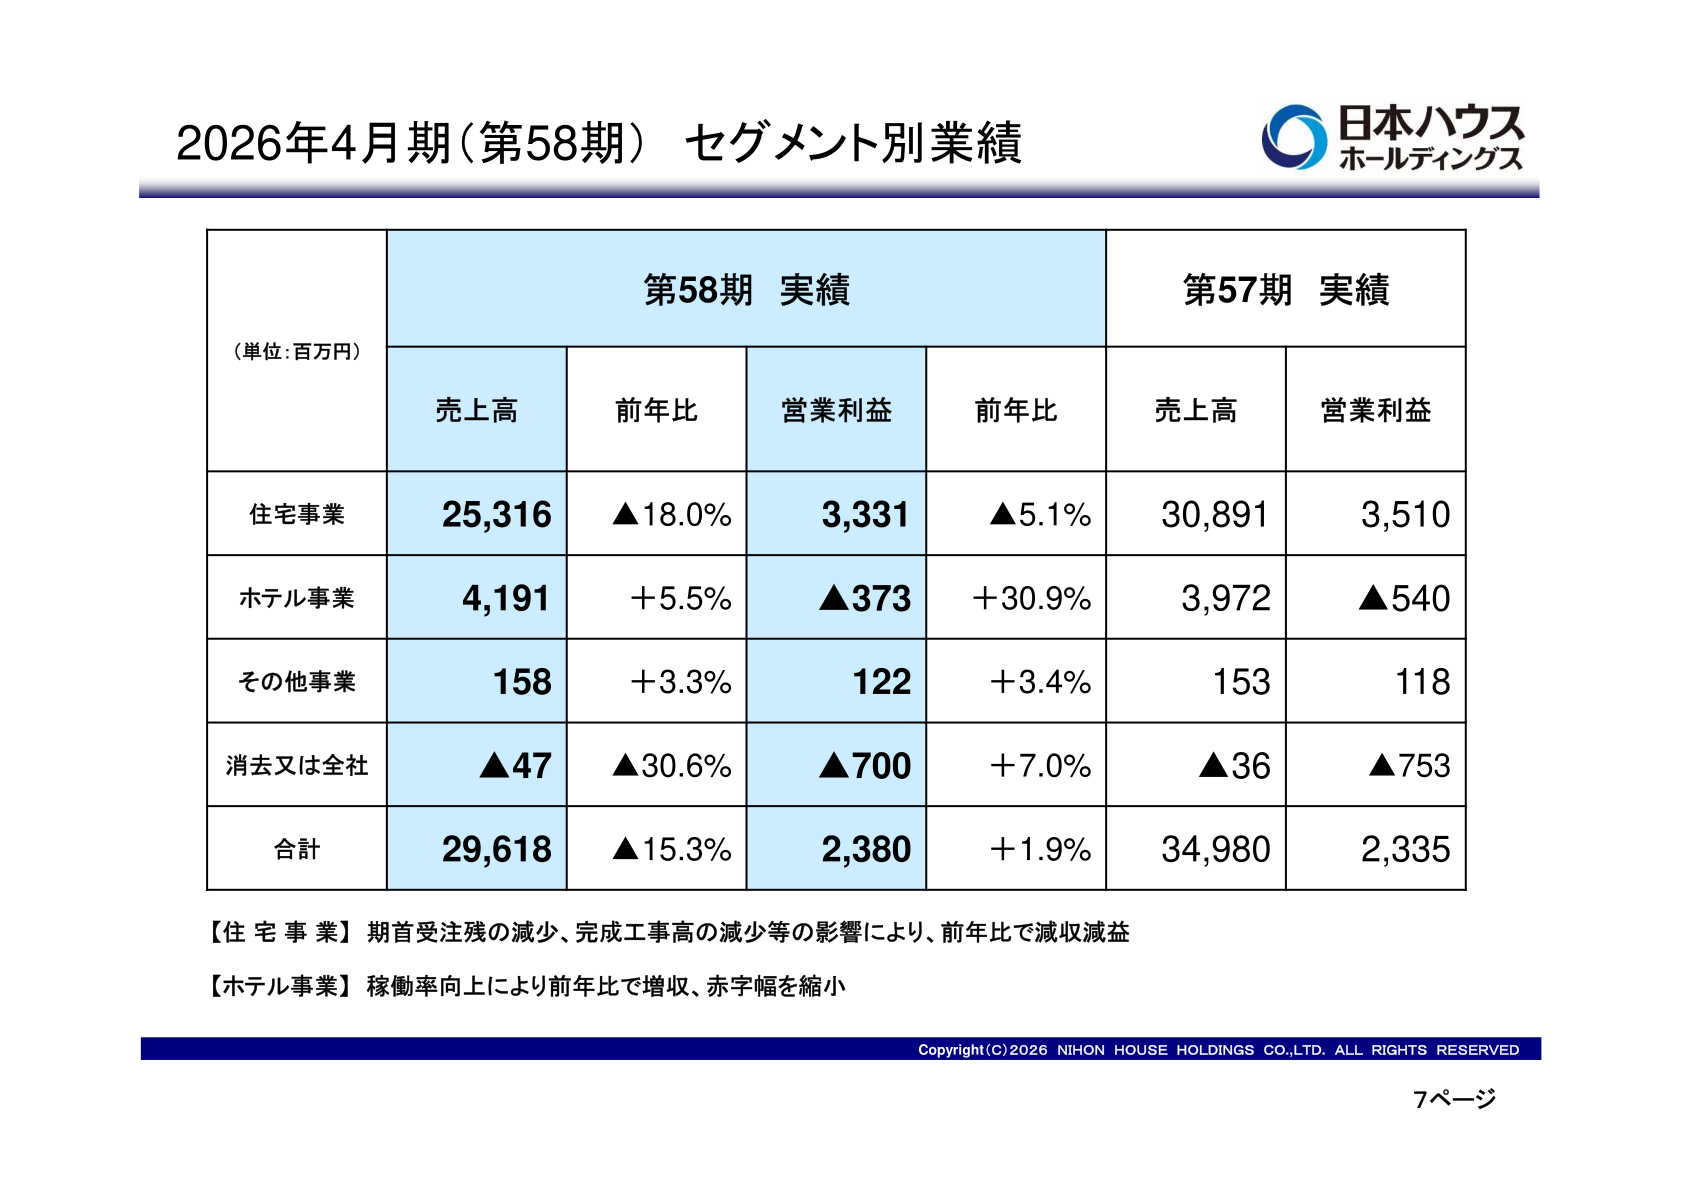
The housing business recorded net sales of 25,316 million yen (down 18.0% year on year) and operating profit of 3,331 million yen (down 5.1%), a decline in both sales and profit, reflecting factors such as a smaller order backlog at the start of the period and lower completed construction sales. The breakdown of the sales decline was a decrease of 3.9 billion yen at the Nihon House Division, 1.1 billion yen at the Condominium Division and 0.4 billion yen at the Renovation Division. The hotel business, by contrast, grew sales to 4,191 million yen (up 5.5% year on year) on higher room occupancy, and its operating loss was held to 373 million yen, narrowing from the 540 million yen loss of the previous fiscal year.
| Segment | Metric | 58th Term (Actual) | 57th Term (Actual) |
|---|---|---|---|
| Housing business | Net sales | 25,316 million yen | 30,891 million yen |
| Housing business | Operating profit | 3,331 million yen | 3,510 million yen |
| Hotel business | Net sales | 4,191 million yen | 3,972 million yen |
| Hotel business | Operating profit | -373 million yen | -540 million yen |
| Other businesses | Net sales | 158 million yen | 153 million yen |
| Other businesses | Operating profit | 122 million yen | 118 million yen |
| Eliminations or corporate | Operating profit | -700 million yen | -753 million yen |
| Total | Net sales | 29,618 million yen | 34,980 million yen |
| Total | Operating profit | 2,380 million yen | 2,335 million yen |
Non-Consolidated Results
On a non-consolidated basis, net sales were 25,186 million yen (down 17.5% year on year and 3,954 million yen below the full-year plan), while operating profit was 2,324 million yen (up 2.6% year on year, 824 million yen above plan), ordinary profit was 2,295 million yen (up 3.8%, 855 million yen above plan) and net profit was 1,530 million yen (up 15.0%, 660 million yen above plan), securing profit growth.
| Item | 58th Term (Actual) | 57th Term (Actual) | YoY change |
|---|---|---|---|
| Net sales | 25,186 million yen | 30,542 million yen | -17.5% |
| Operating profit | 2,324 million yen | 2,265 million yen | +2.6% |
| Ordinary profit | 2,295 million yen | 2,210 million yen | +3.8% |
| Net profit | 1,530 million yen | 1,331 million yen | +15.0% |
Full-Year Forecast for the Fiscal Year Ending April 30, 2027 (the 59th Term)
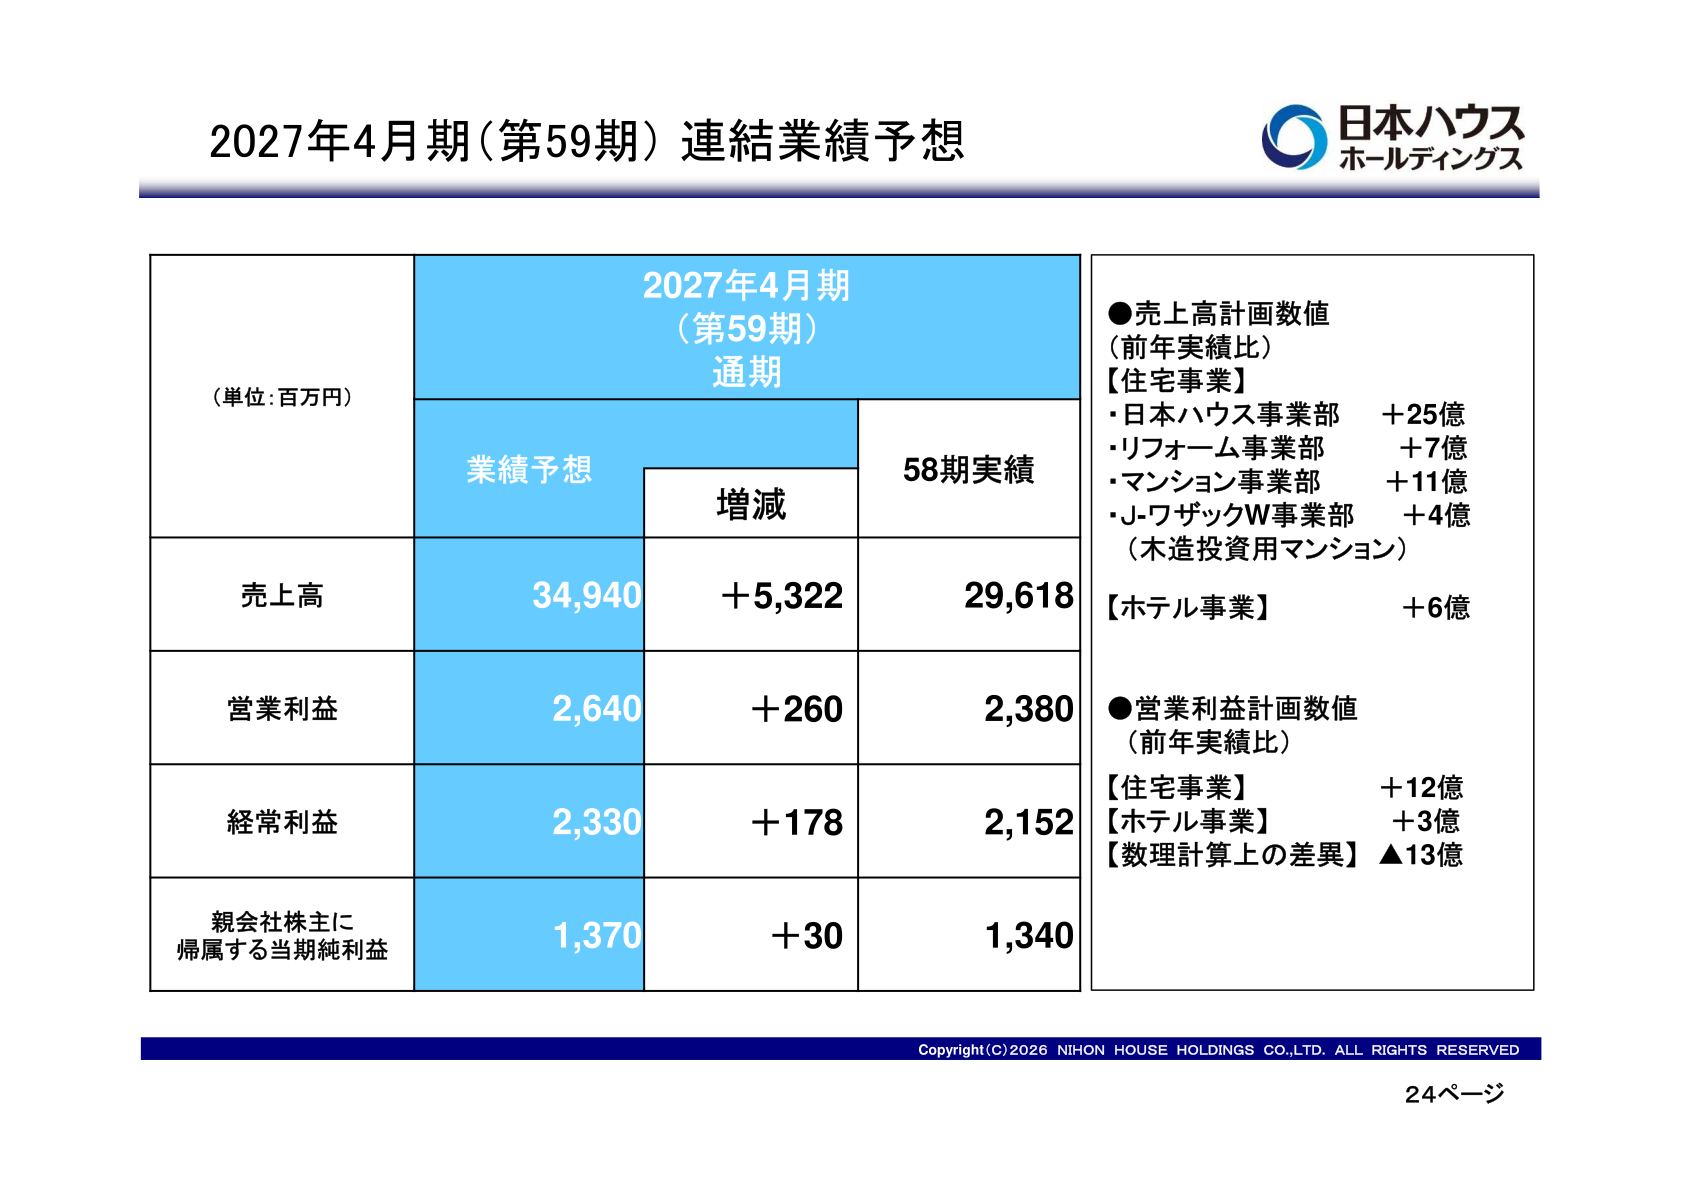
For the following fiscal year, ending April 30, 2027 (the 59th term), the consolidated forecast calls for net sales of 34,940 million yen (up 5,322 million yen from the previous fiscal year), operating profit of 2,640 million yen (up 260 million yen), ordinary profit of 2,330 million yen (up 178 million yen) and profit attributable to owners of parent of 1,370 million yen (up 30 million yen). The sales plan assumes increases of 2.5 billion yen at the Nihon House Division, 1.1 billion yen at the Condominium Division, 0.7 billion yen at the Renovation Division and 0.4 billion yen at the J-WAZAC W Division within the housing business, and an increase of 0.6 billion yen in the hotel business. The operating profit plan assumes positive factors of 1.2 billion yen in the housing business and 0.3 billion yen in the hotel business, while incorporating a negative factor of 1.3 billion yen from the impact of actuarial differences.
| Item | 59th Term (Forecast) | 58th Term (Actual) | Change |
|---|---|---|---|
| Net sales | 34,940 million yen | 29,618 million yen | +5,322 million yen |
| Operating profit | 2,640 million yen | 2,380 million yen | +260 million yen |
| Ordinary profit | 2,330 million yen | 2,152 million yen | +178 million yen |
| Profit attributable to owners of parent | 1,370 million yen | 1,340 million yen | +30 million yen |
Shareholder Returns
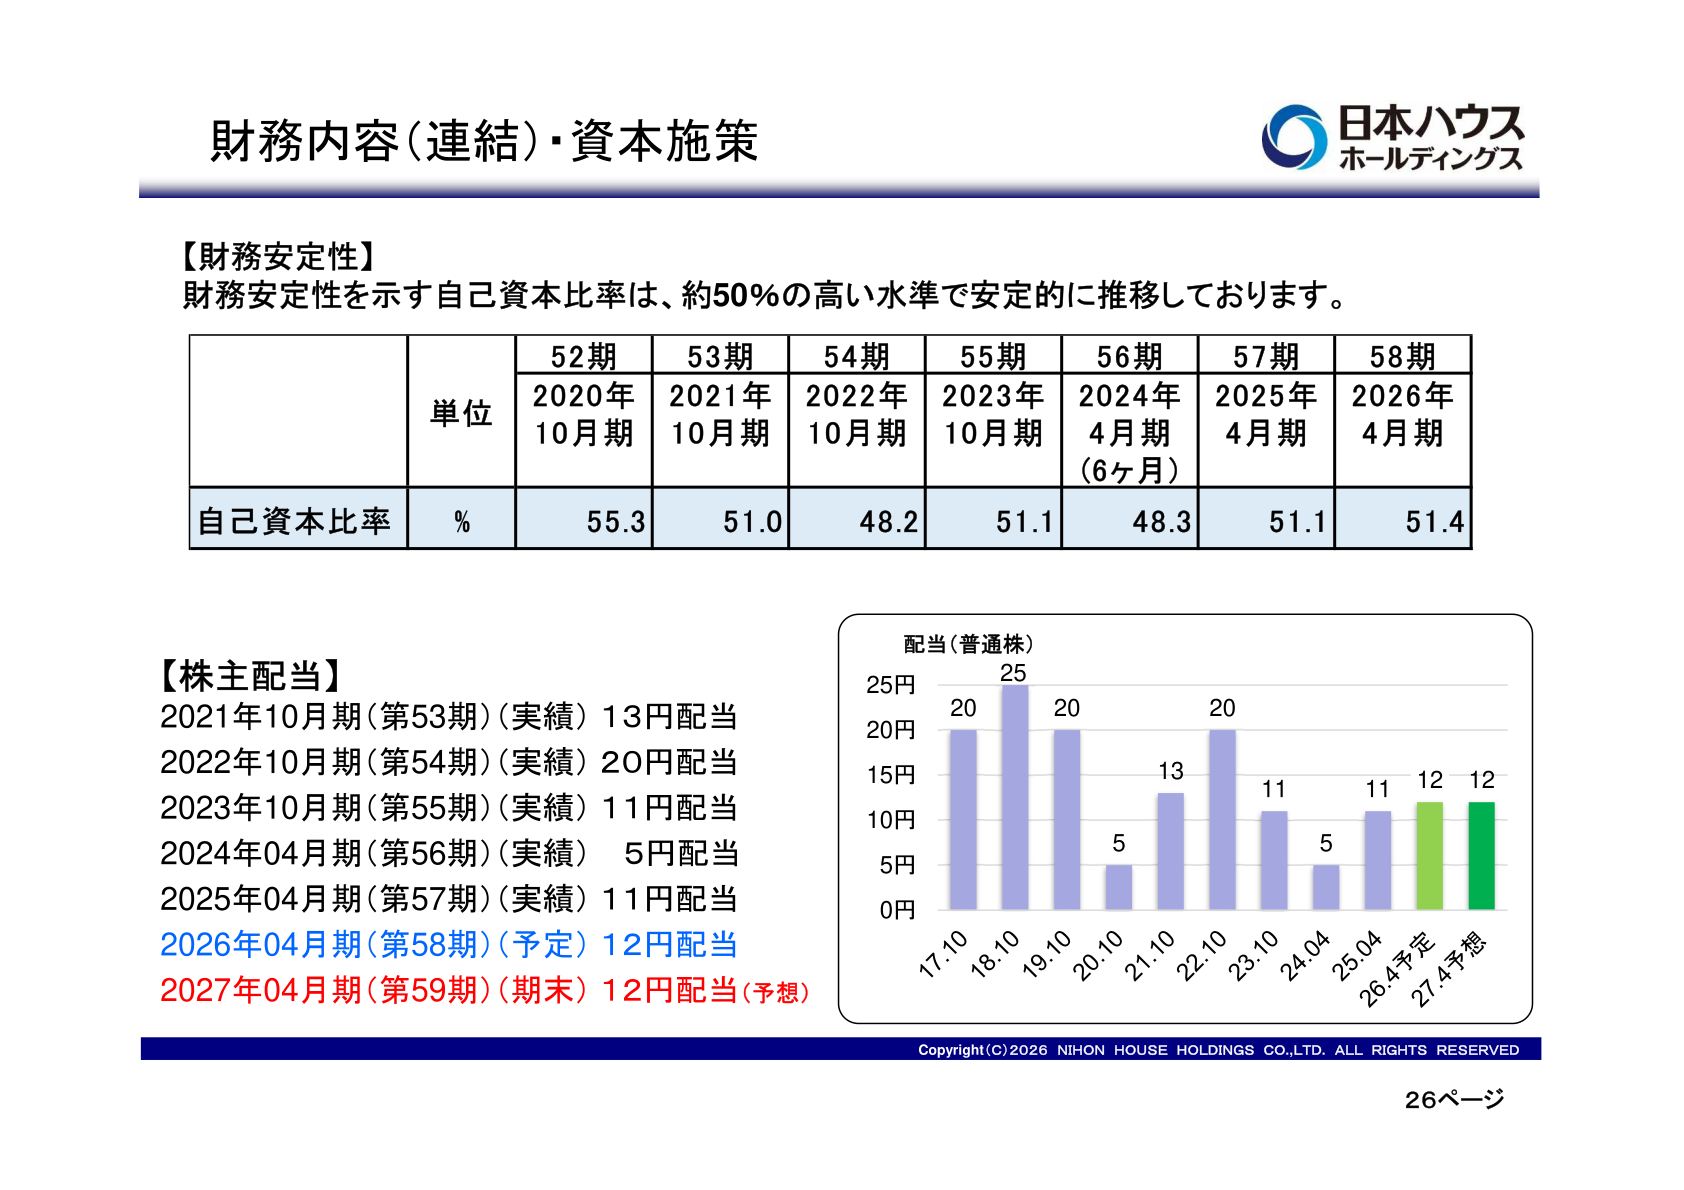
On shareholder returns, the company plans a dividend of 12 yen per share for the fiscal year ended April 30, 2026 (the 58th term), which is expected to give a consolidated payout ratio of 35.8%. For the fiscal year ending April 30, 2027 (the 59th term) it likewise plans a year-end dividend of 12 yen. The company’s basic policy is to maintain a stable dividend using a consolidated payout ratio of around 30% as a guide. Its equity ratio, an indicator of financial stability, was 51.4%, staying above the company’s own 50% standard.
Medium-Term Management Plan / Topics
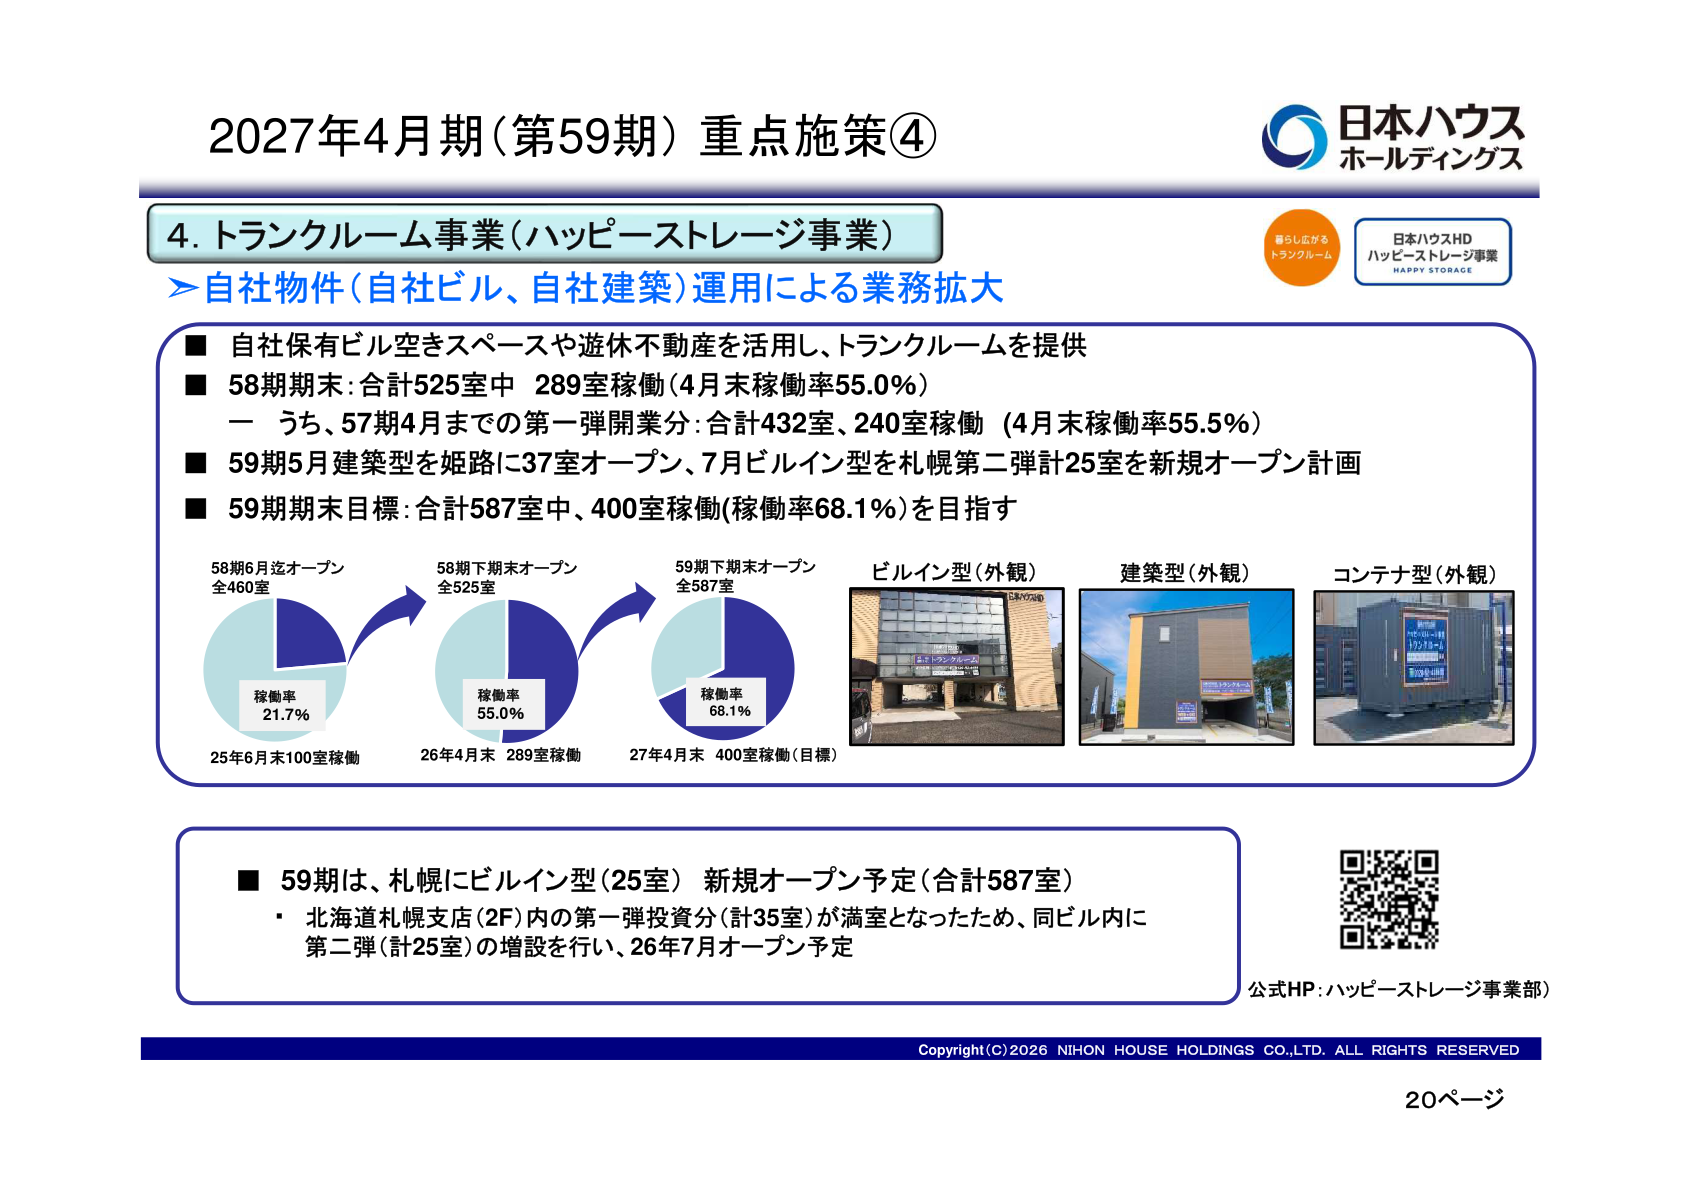
Toward the fiscal year ending April 30, 2027, the final year of the medium-term management plan “Revised Leap: Three-Year Future Plan,” the company aims to achieve group sales of 34.9 billion yen and operating profit of 2.6 billion yen. In addition, the trunk room business (Happy Storage business), which it operates as a leasing business, had 289 of a total 525 units in use at the end of the 58th term (an occupancy rate of 55.0%), and the company’s policy is to aim for 400 of a total 587 units in use at the end of the 59th term (an occupancy rate of 68.1%).
This article is an analysis based on publicly available information and is not a recommendation to buy or sell any specific securities. Investment decisions are your own responsibility.
















