
This article is based on publicly available IR materials and is not a recommendation to buy or sell any specific securities.
Note: Oriental Shiraishi Corporation does not publish an English results presentation; this article is an English translation of the Japanese-language article on our sister site Investalk, which is based on the company’s Japanese-language IR materials, with figures transcribed as reported. Note also that the company labels this fiscal year as the year ended March 31, 2026 (FY26/03), whereas this site classifies the most recent completed fiscal year as FY2025; the source’s own period labels are retained in the text, tables and slide captions below.
Oriental Shiraishi’s fiscal year ended March 31, 2026 produced revenue of 68.8 billion yen, operating profit of 5.3 billion yen and net income of 3.3 billion yen. These fell short of the targets of the previous medium-term management plan (revenue of 73.0 billion yen, operating profit of 6.2 billion yen and net income of 4.5 billion yen); although the core businesses secured a record-high order backlog, the materials attribute the shortfall to timing shifts in the start of large caisson work, progress and timing shifts caused by the impact of an accident in repair and reinforcement work, the occurrence of remanufacturing and re-erection work in the consolidated businesses, and delays in large projects. Meanwhile, the new and peripheral businesses broadly achieved their targets through M&A and overseas business expansion. The materials cover the results together with the new medium-term management plan (fiscal 2026 to 2028, themed “Completing the transformation and challenging beyond boundaries”), which sets targets of revenue of 80.0 billion yen, operating profit of 6.8 billion yen and ROE of 8.0% or higher for the fiscal year ending March 31, 2029.
Consolidated Results (Fiscal Year Ended March 31, 2026)
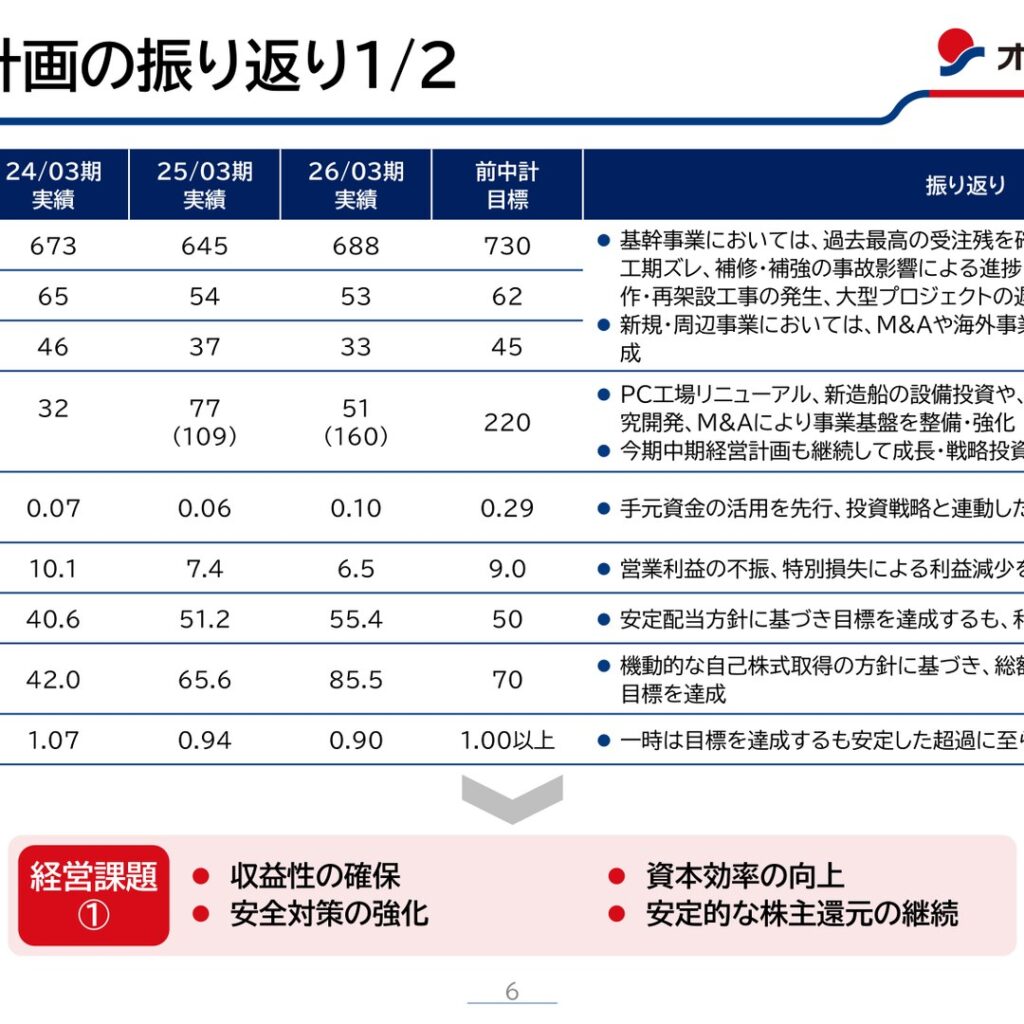
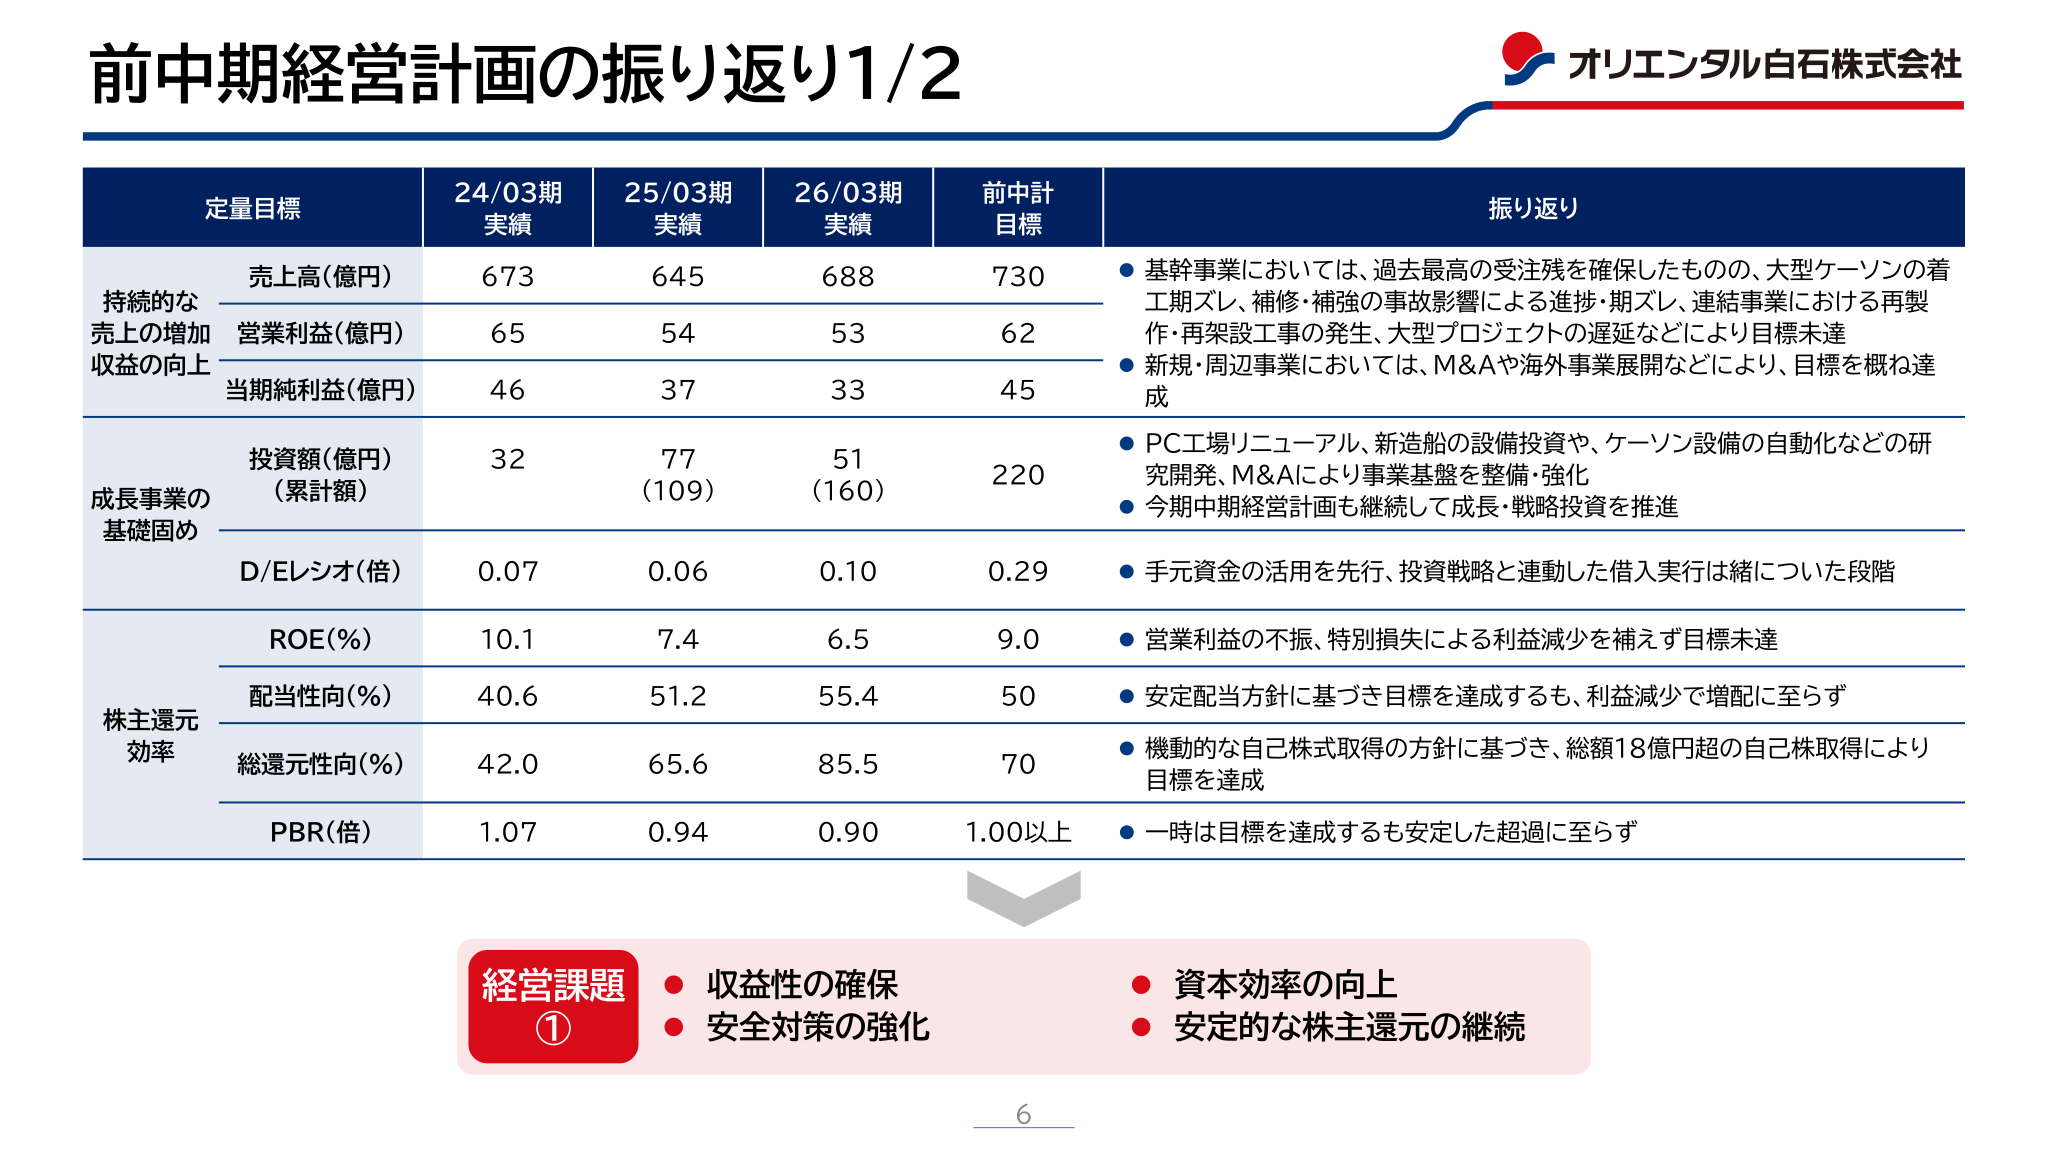
In the review of the previous medium-term management plan (P.6), revenue moved from 67.3 billion yen in FY24/03 to 64.5 billion yen in FY25/03 and 68.8 billion yen in FY26/03, falling short of the previous plan’s target of 73.0 billion yen. Operating profit declined from 6.5 billion yen to 5.4 billion yen and then 5.3 billion yen, and net income declined from 4.6 billion yen to 3.7 billion yen and then 3.3 billion yen. ROE stood at 6.5% (target 9.0%) and PBR at 0.90 times (target 1.00 times or higher), while the dividend payout ratio of 55.4% (target 50%) and the total return ratio of 85.5% (target 70%) achieved their targets. The materials cite “securing profitability,” “strengthening safety measures,” “improving capital efficiency” and “continuing stable shareholder returns” as management issues.
| Item | FY26/03 Actual | FY25/03 Actual | FY24/03 Actual | Previous Plan Target |
|---|---|---|---|---|
| Revenue (100 million yen) | 688 | 645 | 673 | 730 |
| Operating profit (100 million yen) | 53 | 54 | 65 | 62 |
| Net income (100 million yen) | 33 | 37 | 46 | 45 |
| ROE (%) | 6.5 | 7.4 | 10.1 | 9.0 |
| Dividend payout ratio (%) | 55.4 | 51.2 | 40.6 | 50 |
| Total return ratio (%) | 85.5 | 65.6 | 42.0 | 70 |
| D/E ratio (times) | 0.10 | 0.06 | 0.07 | 0.29 |
| PBR (times) | 0.90 | 0.94 | 1.07 | 1.00 or higher |
| Investment (100 million yen; parentheses are cumulative) | 51 (160) | 77 (109) | 32 | 220 |
Business Segment Results
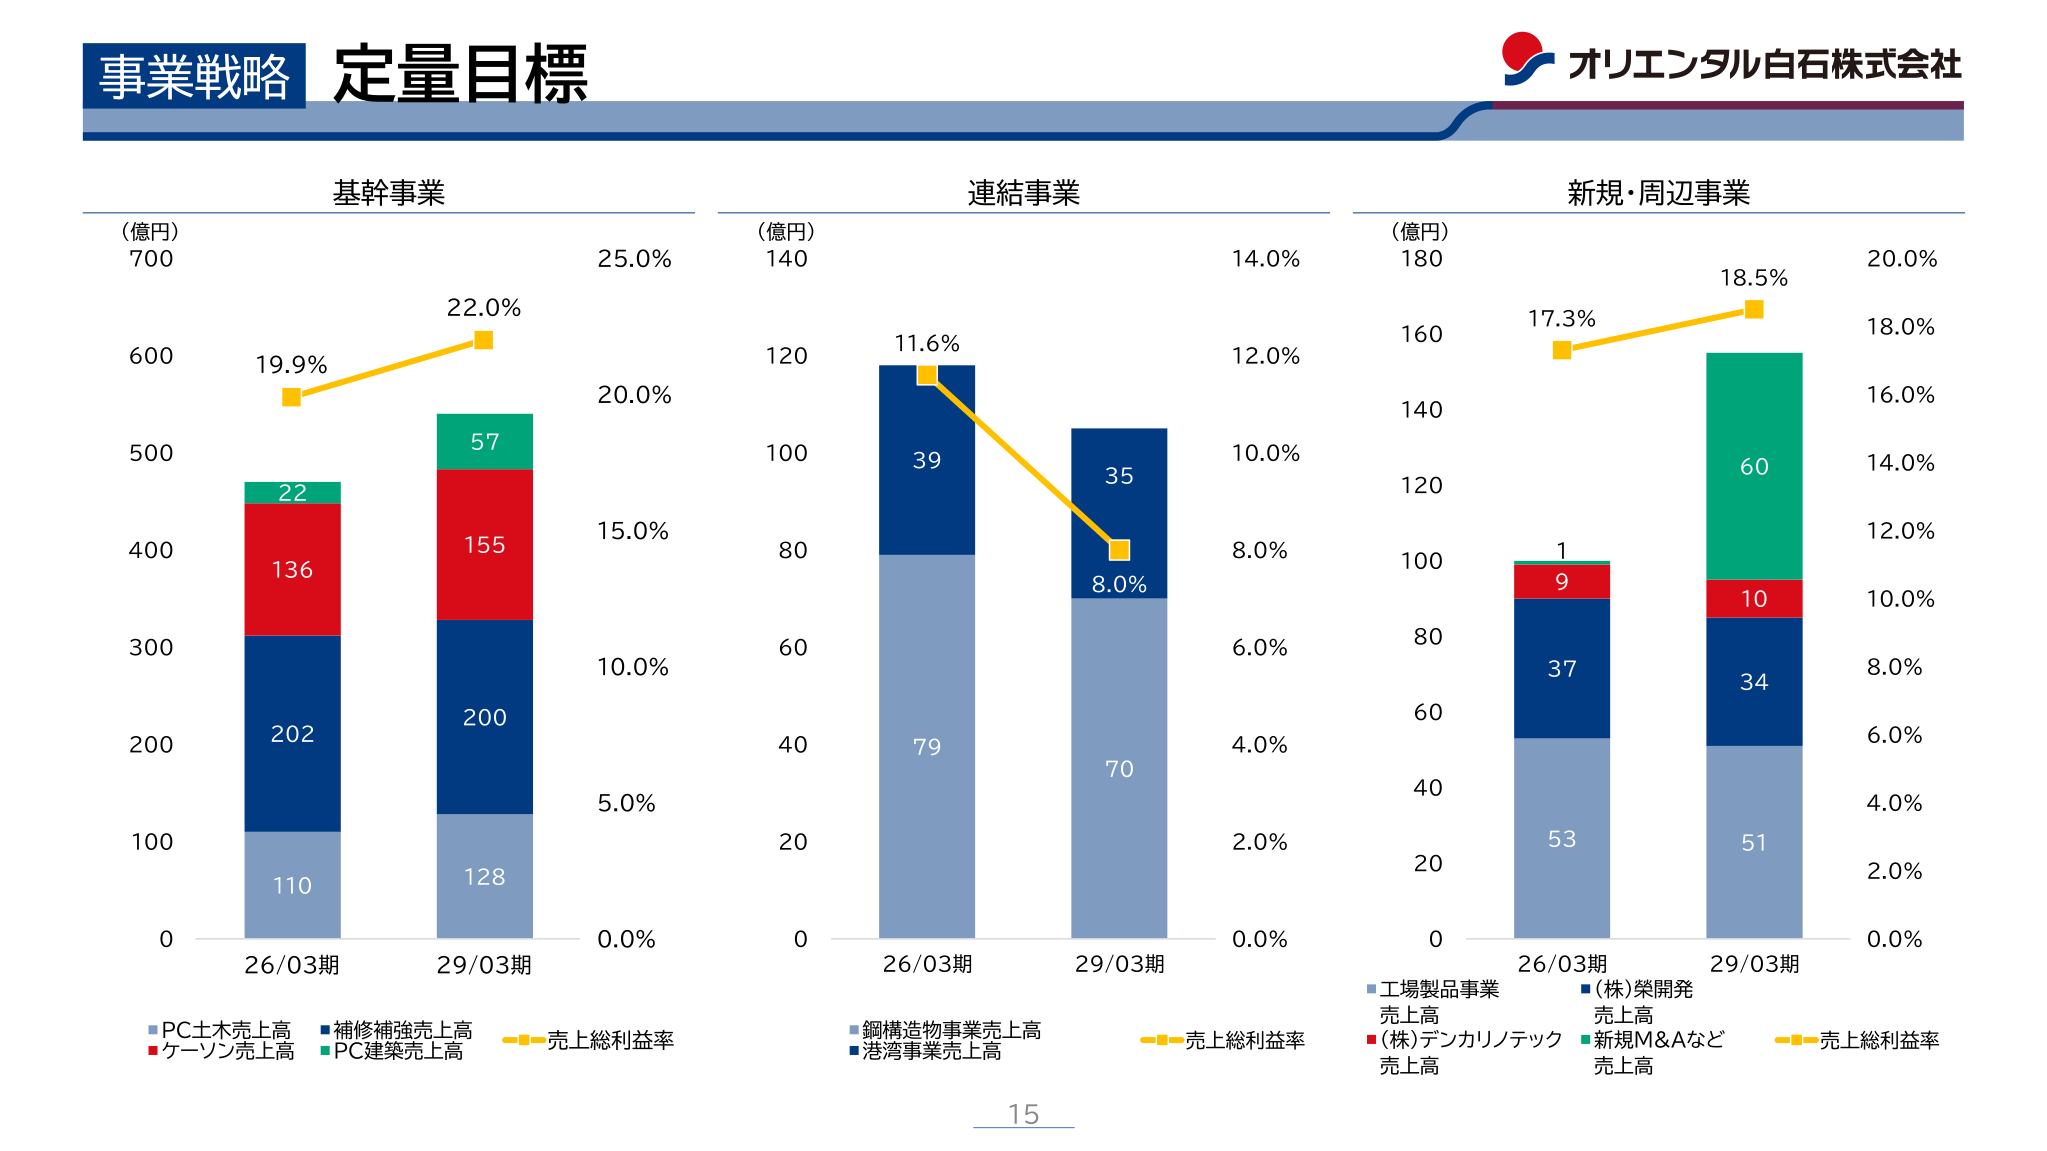
According to the quantitative targets by business (P.15), FY26/03 revenue in the core businesses was 11.0 billion yen for PC civil engineering, 20.2 billion yen for repair and reinforcement, 13.6 billion yen for caissons and 2.2 billion yen for PC building construction, with a gross profit margin of 19.9%. The consolidated businesses comprised 7.9 billion yen for the steel structures business and 3.9 billion yen for the port and harbor business, with a gross profit margin of 11.6%. The new and peripheral businesses comprised 5.3 billion yen for the factory products business, 3.7 billion yen for Sakae Kaihatsu Co., Ltd., 0.9 billion yen for Denka Rinotech Co., Ltd. and 0.1 billion yen for new M&A and other activities, with a gross profit margin of 17.3%. Toward FY29/03, the company plans to grow PC building construction in the core businesses from 2.2 billion yen to 5.7 billion yen, and new M&A and other activities in the new and peripheral businesses from 0.1 billion yen to 6.0 billion yen. Within the consolidated businesses, the steel structures business is positioned as facing the challenges of completing remanufacturing and re-erection work and of business restructuring, with a plan for revenue to move from 7.9 billion yen to 7.0 billion yen and the gross profit margin from 11.6% to 8.0%.
| Category | Business | FY26/03 Revenue | FY29/03 Target |
|---|---|---|---|
| Core businesses | PC civil engineering | 11.0 billion yen | 12.8 billion yen |
| Core businesses | Repair and reinforcement | 20.2 billion yen | 20.0 billion yen |
| Core businesses | Caissons | 13.6 billion yen | 15.5 billion yen |
| Core businesses | PC building construction | 2.2 billion yen | 5.7 billion yen |
| Core businesses | Gross profit margin | 19.9% | 22.0% |
| Consolidated businesses | Steel structures business | 7.9 billion yen | 7.0 billion yen |
| Consolidated businesses | Port and harbor business | 3.9 billion yen | 3.5 billion yen |
| Consolidated businesses | Gross profit margin | 11.6% | 8.0% |
| New and peripheral businesses | Factory products business | 5.3 billion yen | 5.1 billion yen |
| New and peripheral businesses | Sakae Kaihatsu Co., Ltd. | 3.7 billion yen | 3.4 billion yen |
| New and peripheral businesses | Denka Rinotech Co., Ltd. | 0.9 billion yen | 1.0 billion yen |
| New and peripheral businesses | New M&A and others | 0.1 billion yen | 6.0 billion yen |
| New and peripheral businesses | Gross profit margin | 17.3% | 18.5% |
Medium-Term Management Plan (Fiscal 2026 to 2028): Management Indicators
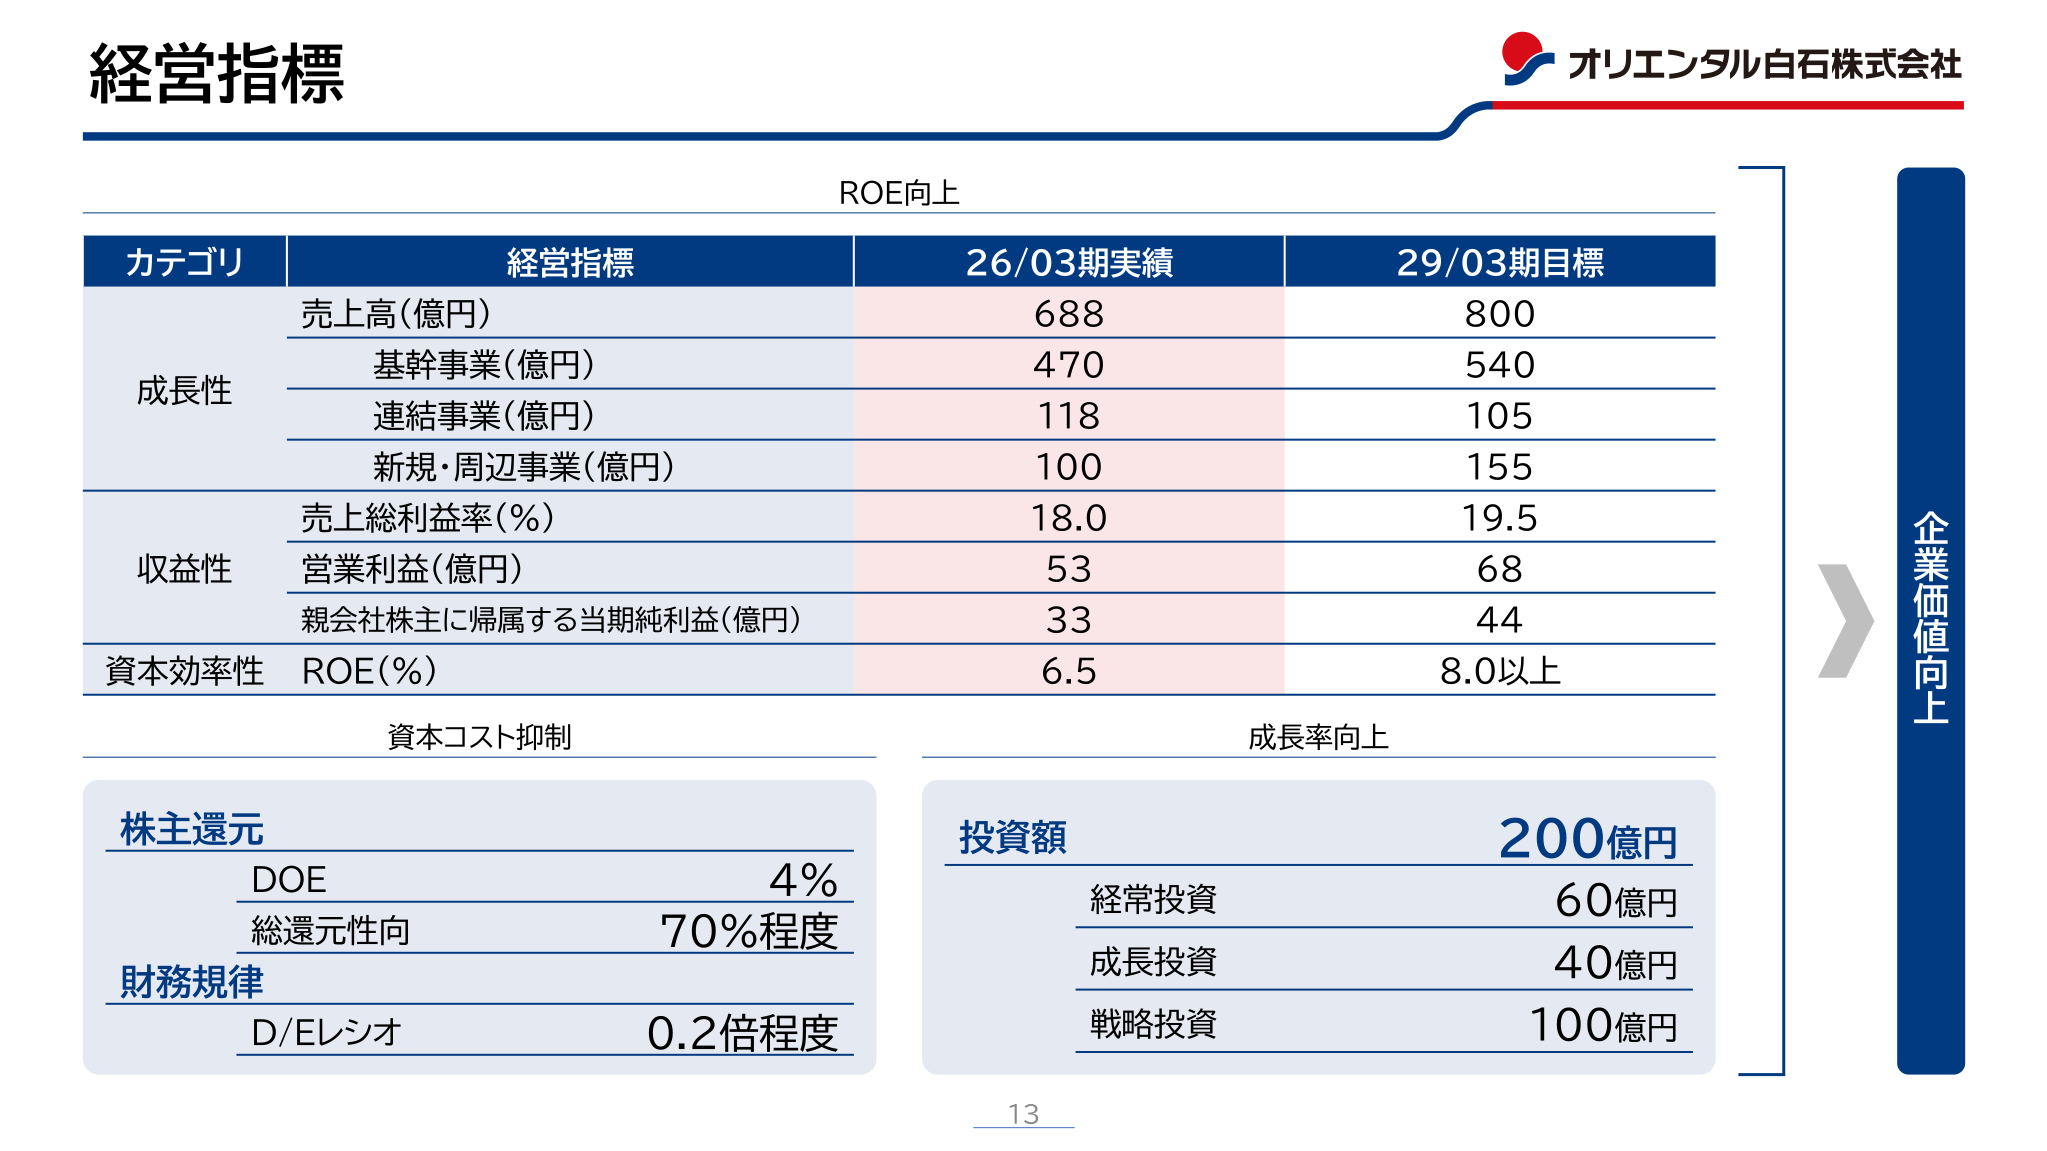
Under the management indicators of the new medium-term management plan (P.13), the company targets revenue of 80.0 billion yen for the fiscal year ending March 31, 2029 (54.0 billion yen from the core businesses, 10.5 billion yen from the consolidated businesses and 15.5 billion yen from the new and peripheral businesses), a gross profit margin of 19.5%, operating profit of 6.8 billion yen, net income attributable to owners of parent of 4.4 billion yen, and ROE of 8.0% or higher. Investment over the three years is set at 20.0 billion yen (6.0 billion yen of ordinary investment, 4.0 billion yen of growth investment and 10.0 billion yen of strategic investment), with financial discipline targeting a D/E ratio of around 0.2 times. The basic policy rests on three pillars: “continuously creating a base volume of business,” “changing how we earn” and “advancing into new domains.” The long-term vision aims for revenue of 90.0 billion yen in the fiscal year ending March 31, 2031 (P.14). The materials contain no single-year earnings forecast for the next fiscal year, ending March 31, 2027.
| Management Indicator | FY26/03 Actual | FY29/03 Target |
|---|---|---|
| Revenue | 68.8 billion yen | 80.0 billion yen |
| Core businesses | 47.0 billion yen | 54.0 billion yen |
| Consolidated businesses | 11.8 billion yen | 10.5 billion yen |
| New and peripheral businesses | 10.0 billion yen | 15.5 billion yen |
| Gross profit margin | 18.0% | 19.5% |
| Operating profit | 5.3 billion yen | 6.8 billion yen |
| Net income attributable to owners of parent | 3.3 billion yen | 4.4 billion yen |
| ROE | 6.5% | 8.0% or higher |
| Investment | — | 20.0 billion yen (ordinary 6.0 / growth 4.0 / strategic 10.0) |
| DOE | — | 4% |
| Total return ratio | — | Around 70% |
| D/E ratio | — | Around 0.2 times |
Shareholder Returns
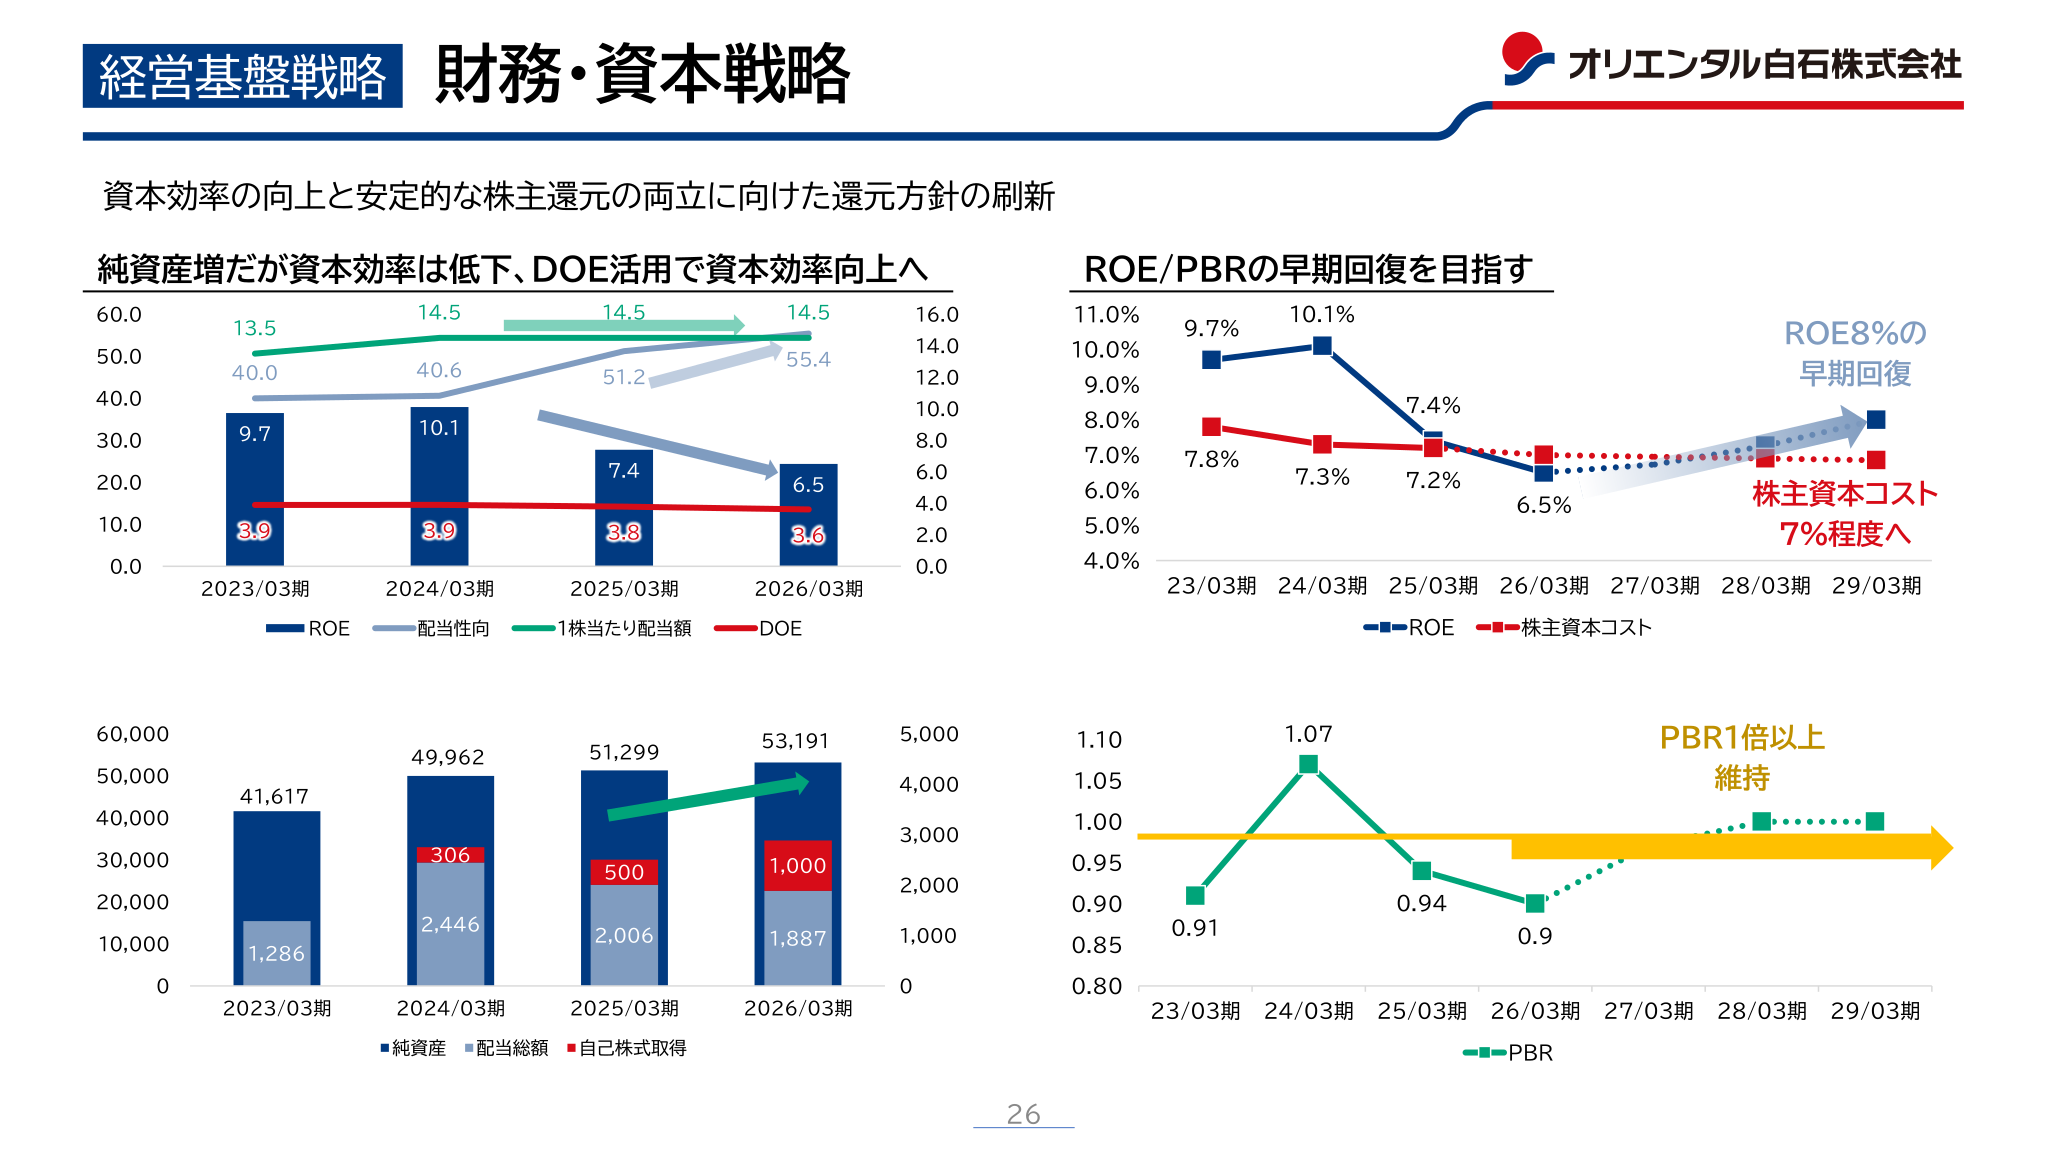
Under the financial and capital strategy (P.25), based on the basic policy of “maintaining stable profit dividends,” the company retains the previous plan’s policy of a total return ratio of around 70% while newly introducing a dividend on equity (DOE) ratio of 4%. Through stable dividends that are not swayed by earnings and active profit returns including share buybacks, it aims for ROE of 8% or higher and PBR above 1.0 times. During the previous plan period, the company acquired more than 1.8 billion yen of treasury shares in total under its policy of flexible share buybacks and achieved its total return ratio target (P.6). The dividend per share has remained at 14.5 yen since FY2024/03, and for FY2026/03 the dividend payout ratio was 55.4% and DOE was 3.6% (P.26). In the three-year cumulative cash flow plan, operating cash flow of 18.0 billion yen and other sources are allocated to 6.0 billion yen of ordinary investment, 4.0 billion yen of growth investment, 10.0 billion yen of strategic investment and shareholder returns.
| Item | FY2023/03 | FY2024/03 | FY2025/03 | FY2026/03 |
|---|---|---|---|---|
| Dividend per share (yen) | 13.5 | 14.5 | 14.5 | 14.5 |
| Dividend payout ratio (%) | 40.0 | 40.6 | 51.2 | 55.4 |
| DOE (%) | 3.9 | 3.9 | 3.8 | 3.6 |
| ROE (%) | 9.7 | 10.1 | 7.4 | 6.5 |
| PBR (times) | 0.91 | 1.07 | 0.94 | 0.90 |
| Net assets (million yen) | 41,617 | 49,962 | 51,299 | 53,191 |
Topics
The materials highlight the deepening of collaboration with ITOCHU Corporation, citing the construction of a public-private partnership business base starting from bridge infrastructure maintenance, reductions in logistics costs and CO2 by using the ITOCHU Group’s marine transport functions, the establishment of a centralized purchasing system, and the continuous and flexible pursuit of M&A (P.31). On the environmental front, the company obtained SBTi certification in October 2025 and revised its targets to reduce Scope 1 and 2 emissions by 42% and Scope 3 emissions by 25% by fiscal 2030 compared with fiscal 2023 (P.29). In its human resources strategy, it has set KPIs of 130 hires over three years, an engagement score of 75p or higher, a turnover rate of 15% (lower limit) and human capital investment of 0.7 billion yen (P.28). In the new and peripheral businesses, it is promoting overseas expansion targeting Taiwan and Indonesia, external sales of factory products, comprehensive maintenance and management operations and public-private partnership projects for local governments, and environmental businesses such as aquaponics and hybrid methane fermentation systems.
This article is an analysis based on publicly available information and is not a recommendation to buy or sell any specific securities. Investment decisions are your own responsibility.
















