
This article is based on publicly available IR materials and is not a recommendation to buy or sell any specific securities.
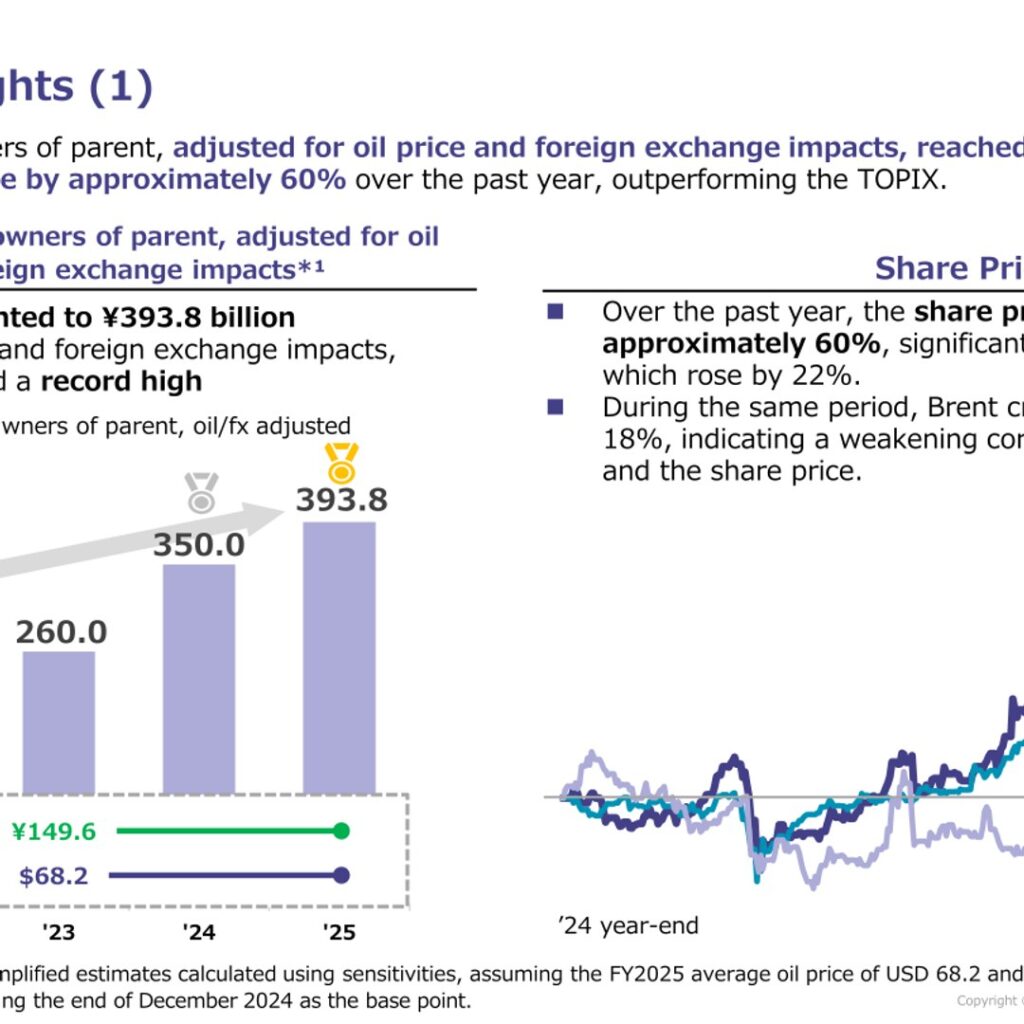
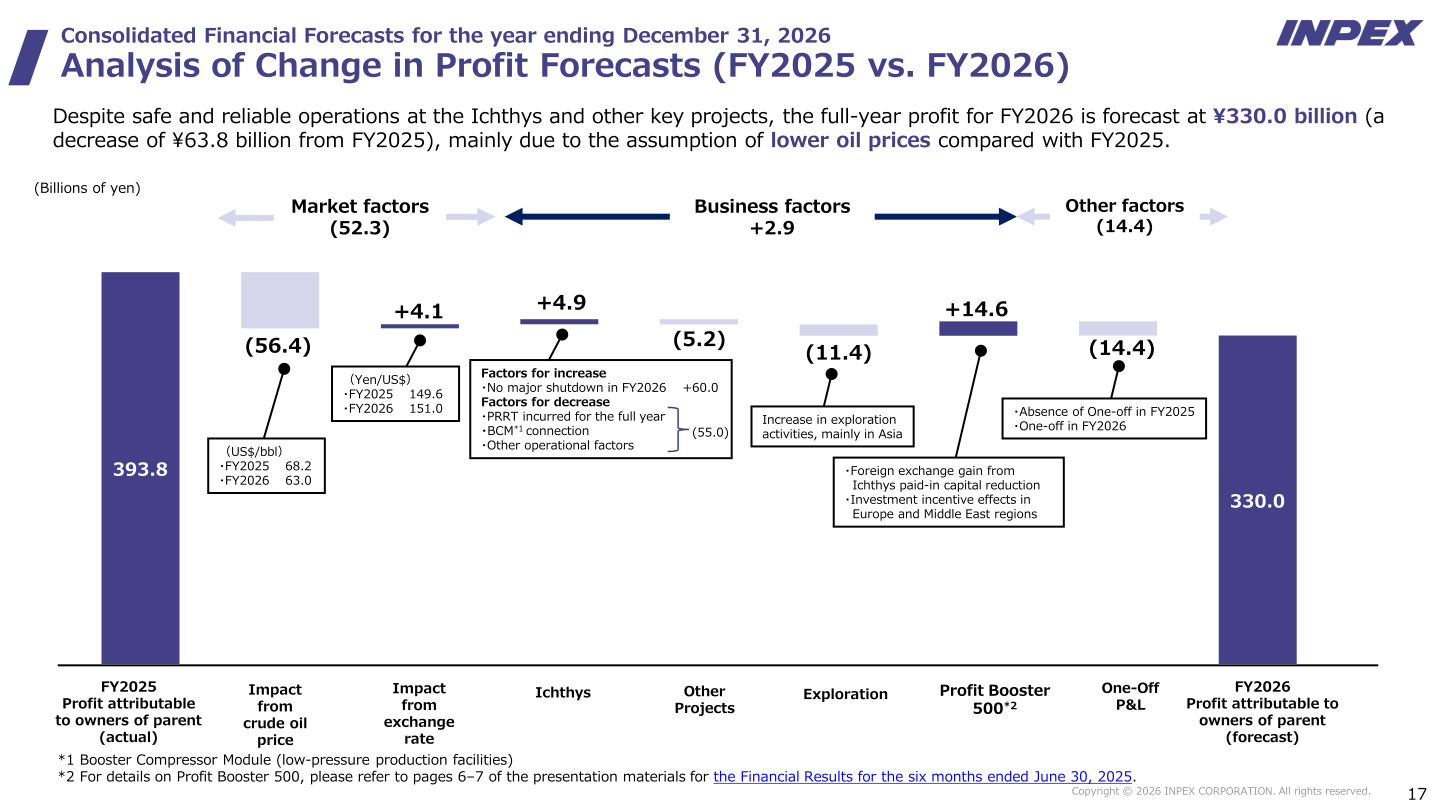
INPEX CORPORATION reported consolidated results for the fiscal year ended December 31, 2025 (FY2025). Profit attributable to owners of parent was ¥393.8 billion, down ¥33.5 billion (7.8%) year on year, mainly reflecting a lower average crude oil price (Brent, $68.19/bbl, down $11.67 or 14.6% YoY) and yen appreciation (average exchange rate of ¥149.62/$, a 2.07 yen or 1.4% appreciation YoY), partly offset by a decrease in income tax expense. Adjusted for oil price and foreign exchange impacts, FY2025 profit reached a record high. Revenue was ¥2,011.3 billion (down 11.2% YoY) and operating profit was ¥1,135.4 billion (down 10.7% YoY). For FY2026, INPEX forecasts profit attributable to owners of parent of ¥330.0 billion, down ¥63.8 billion (16.2%) YoY, mainly due to a lower assumed oil price ($63.0/bbl); core earnings (profit excluding the impacts of crude oil prices, foreign exchange rates and one-off factors) are expected to remain at the same level as FY2025. INPEX also announced INPEX Vision 2035 during the results period.
Consolidated Results (Full-Year Actual)
The table below summarizes INPEX’s consolidated financial results for FY2025 (year ended December 31, 2025) compared with FY2024, as disclosed in the results briefing materials.
| Item | FY2025 (Actual) | FY2024 | Change | % Change |
|---|---|---|---|---|
| Average crude oil price (Brent) ($/bbl) | 68.19 | 79.86 | (11.67) | (14.6%) |
| Average exchange rate (¥/$) | 149.62 | 151.69 | 2.07 yen appreciation | 1.4% appreciation |
| Revenue (Billions of yen) | 2,011.3 | 2,265.8 | (254.4) | (11.2%) |
| Operating profit (Billions of yen) | 1,135.4 | 1,271.7 | (136.3) | (10.7%) |
| Profit before tax (Billions of yen) | 1,173.4 | 1,298.8 | (125.3) | (9.7%) |
| Profit attributable to owners of parent (Billions of yen) | 393.8 | 427.3 | (33.5) | (7.8%) |
| Basic EPS (Yen) | 330.82 | 345.31 | (14.49) | (4.2%) |
| BPS (Yen) | 4,073.44 | 4,026.22 | 47.22 | 1.2% |
| ROIC (%) | 7.3 | 8.4 | (1.1) | – |
| ROE (%) | 8.2 | 9.5 | (1.3) | – |
| Net debt/equity ratio | 0.35 | 0.33 | 0.02 | – |
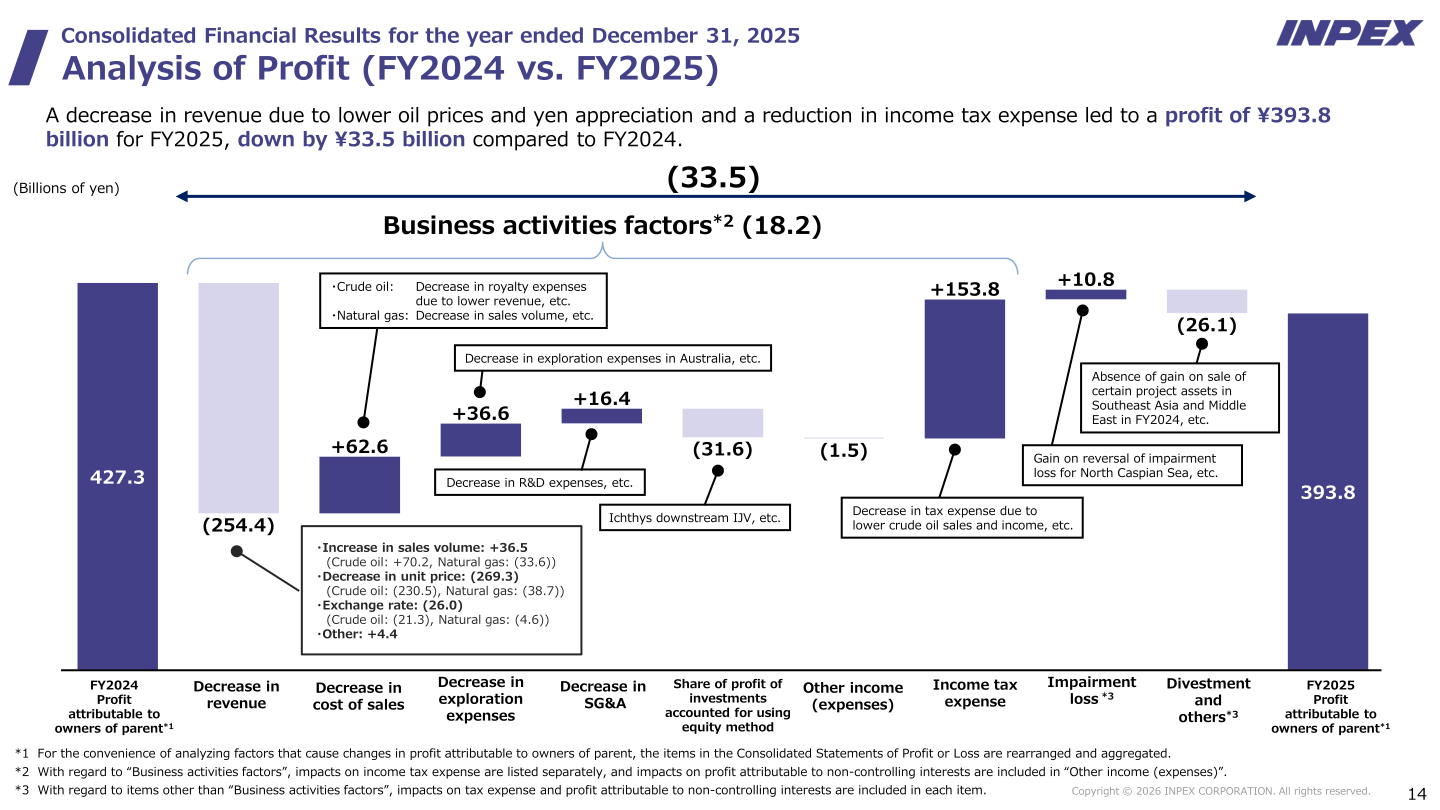
According to the materials, the decrease in revenue due to lower oil prices and yen appreciation, combined with a reduction in income tax expense, led to profit of ¥393.8 billion for FY2025, down ¥33.5 billion compared with FY2024. Business activities factors (a decrease of ¥18.2 billion) reflected decreased royalty expenses on crude oil due to lower revenue and a decrease in natural gas sales volume, among other items; other items affecting the change included a gain on reversal of impairment loss for the North Caspian Sea and the absence of a gain on sale of certain project assets in Southeast Asia and the Middle East recorded in FY2024.
Segment Results
INPEX manages its business through Oil & Gas Japan, Oil & Gas Overseas Ichthys, Oil & Gas Overseas Others, Others, Renewable Energy, and Hydrogen and CCUS (inclusive of R&D expenses). Profit contribution (segment profit) from the Ichthys LNG Project was ¥270.8 billion in FY2025, up from ¥248.2 billion in FY2024, and is forecast at approximately ¥220.0 billion in FY2026. By ROIC, O&G Japan was 8.3% in FY2025 (forecast (0.4)% in FY2026), O&G Overseas Ichthys was 7.5% (forecast 6.7%), O&G Overseas Others was 9.9% (forecast 5.9%), Others was (9.5)% (forecast (4.8)%), and Renewable Energy etc. was (5.0)% (forecast (2.3)%); consolidated ROIC was 7.3% in FY2025 and is forecast at 6.0% in FY2026. Invested capital and adjusted profit by segment for FY2025 (actual) and FY2026 (forecast), as disclosed in the appendix, are shown below.
| Segment | Metric | FY2025 (Actual) | FY2026 (Forecast) | Change |
|---|---|---|---|---|
| O&G Japan | Invested Capital | 267.7 | 272.7 | 5.0 |
| O&G Japan | Adjusted Profit | 22.2 | (1.1) | (23.3) |
| O&G Overseas Ichthys | Invested Capital | 4,278.9 | 3,969.2 | (309.7) |
| O&G Overseas Ichthys | Adjusted Profit | 321.4 | 264.1 | (57.3) |
| O&G Overseas Others | Invested Capital | 1,564.6 | 1,773.3 | 208.7 |
| O&G Overseas Others | Adjusted Profit | 155.5 | 105.4 | (50.1) |
| Others | Invested Capital | 175.0 | 181.2 | 6.2 |
| Others | Adjusted Profit | (16.5) | (8.6) | 7.9 |
| Renewable Energy | Invested Capital | 161.4 | 175.6 | 14.2 |
| Renewable Energy | Adjusted Profit | (8.0) | (4.0) | 4.0 |
| Hydrogen and CCUS (incl. R&D) | Invested Capital | – | – | – |
| Hydrogen and CCUS (incl. R&D) | Adjusted Profit | (15.0) | (10.5) | 4.5 |
| Consolidated | Invested Capital | 6,883.6 | 6,778.9 | (64.8) |
| Consolidated | Adjusted Profit | 505.6 | 405.7 | (99.9) |
FY2026 Forecast
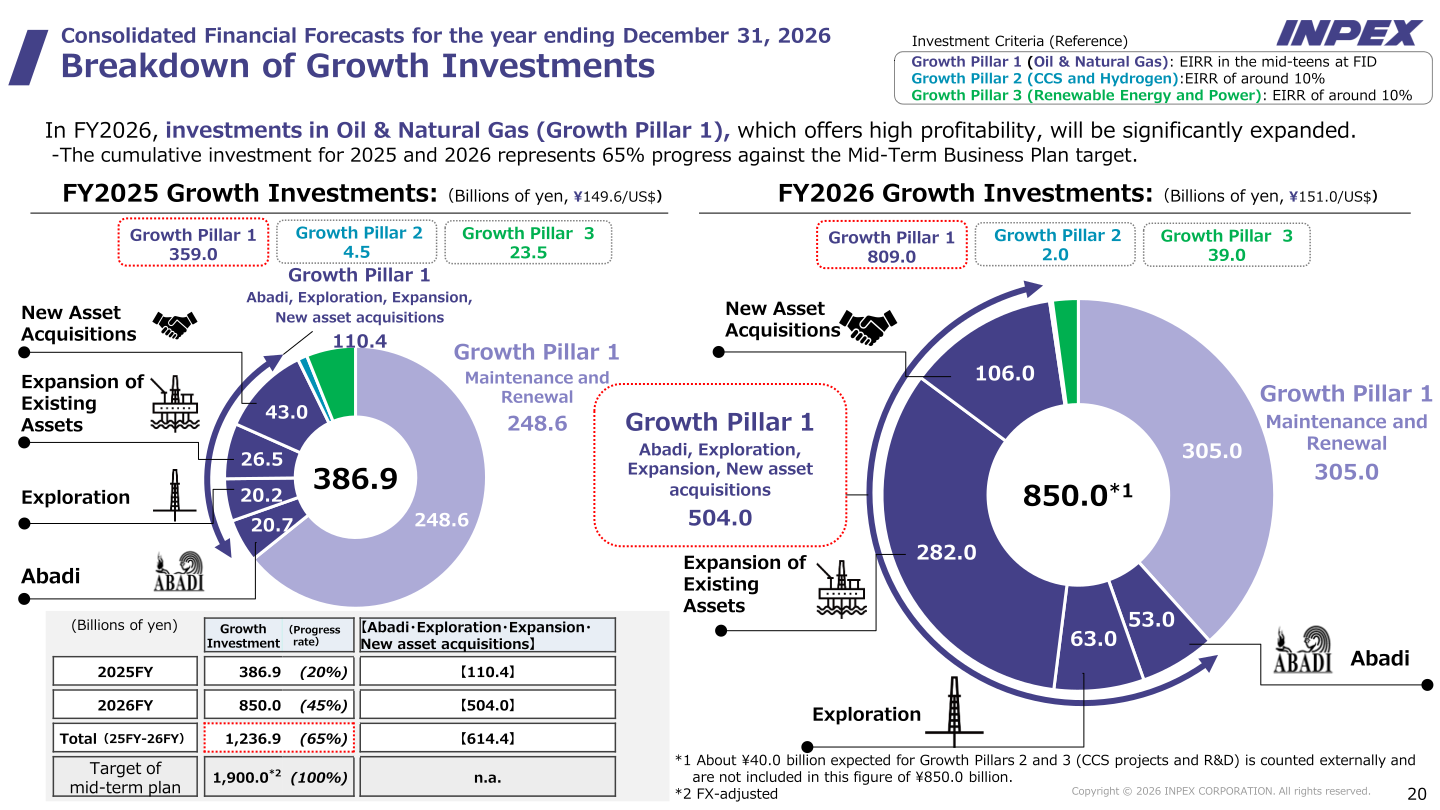
For FY2026, INPEX forecasts full-year revenue of ¥1,893.0 billion, operating profit of ¥957.0 billion, and profit attributable to owners of parent of ¥330.0 billion, based on an assumed average Brent crude oil price of $63.0/bbl (down $5.19 YoY) and an average exchange rate of ¥151.0/$ (a 1.38 yen depreciation YoY). CFFO is expected to be ¥842.0 billion, down ¥20.6 billion YoY. Cash flow from investment (including exploration investment) is expected to be (¥862.0) billion, of which growth investment is expected to increase to ¥850.0 billion (from ¥386.9 billion in FY2025), primarily allocated to Growth Pillar 1 (expansion of oil and natural gas, mainly LNG) at ¥809.0 billion. The fund balance at the end of FY2026 is expected to be ¥200.0 billion, down ¥0.8 billion from the ¥200.8 billion balance at the end of FY2025.
| Item | FY2026 (Forecast) | FY2025 (Actual) | Change | % Change |
|---|---|---|---|---|
| Average crude oil price (Brent) ($/bbl) | 63.0 | 68.19 | (5.19) | (7.6%) |
| Average exchange rate (¥/$) | 151.0 | 149.62 | 1.38 yen depreciation | 0.9% depreciation |
| Revenue (Billions of yen) | 1,893.0 | 2,011.3 | (118.3) | (5.9%) |
| Operating profit (Billions of yen) | 957.0 | 1,135.4 | (178.4) | (15.7%) |
| Profit before tax (Billions of yen) | 1,000.0 | 1,173.4 | (173.4) | (14.8%) |
| Profit attributable to owners of parent (Billions of yen) | 330.0 | 393.8 | (63.8) | (16.2%) |
| ROIC (%) | 6.0 | 7.3 | (1.3) | – |
| ROE (%) | 7.0 | 8.2 | (1.2) | – |
| Net debt/equity ratio | 0.39 | 0.35 | 0.04 | – |
Shareholder Returns
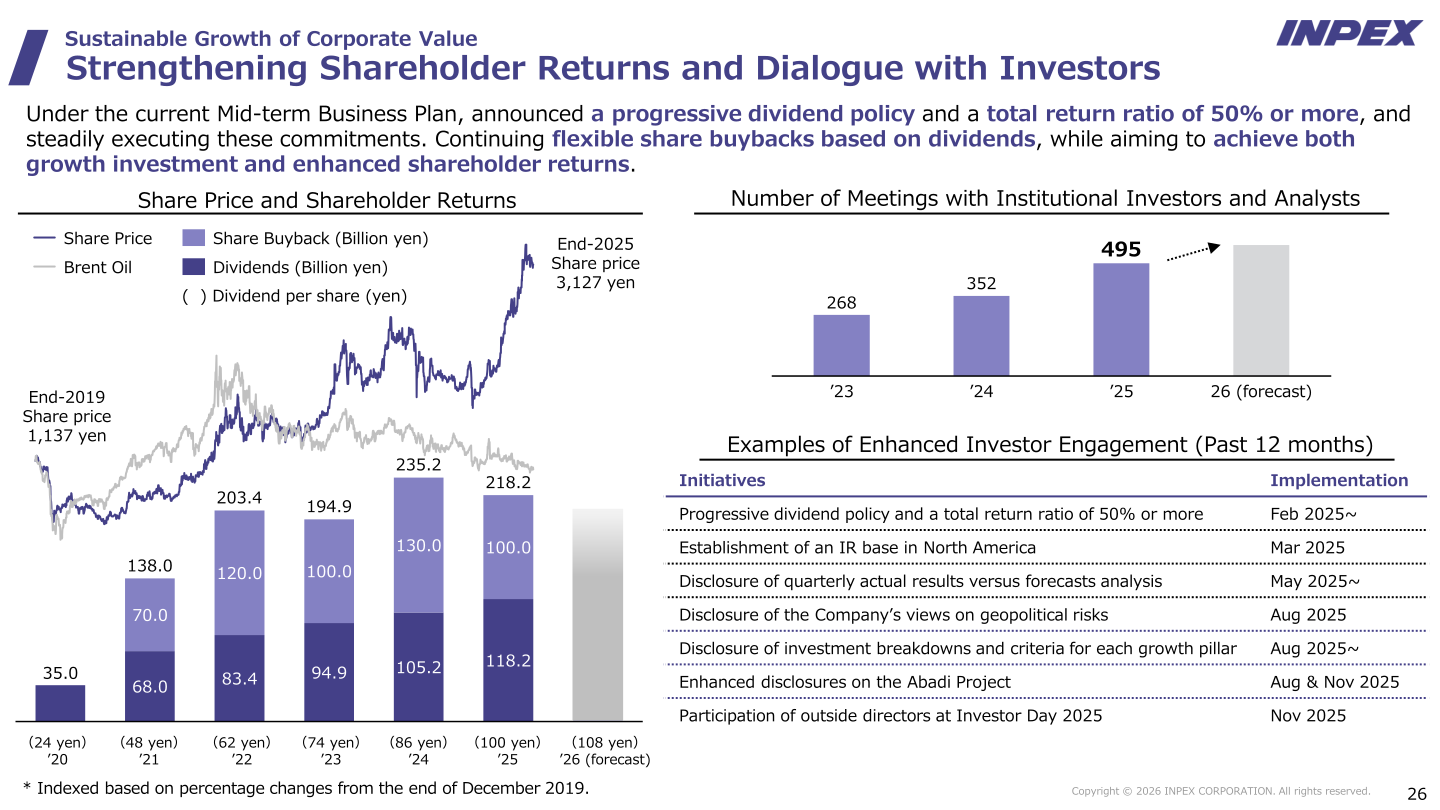
For FY2025, INPEX paid an annual dividend of ¥100 per share and conducted share buybacks totaling ¥100.0 billion, resulting in a total shareholder return ratio of 55.4% for the full year. The annual dividend per share has risen each year, from ¥24 in FY2020 to ¥48 (FY2021), ¥62 (FY2022), ¥74 (FY2023), ¥86 (FY2024) and ¥100 (FY2025), as disclosed in the presentation. For FY2026, INPEX plans an annual dividend of ¥108 per share under its progressive dividend policy, an increase of ¥8 from FY2025, and will maintain a total shareholder return ratio of 50% or more; the company states it will consider additional shareholder returns based on the business environment, financial base and management conditions. The number of meetings with institutional investors and analysts increased to 495 in FY2025, from 352 in FY2024 and 268 in FY2023.
| Item | FY2025 (Actual) | FY2026 (Forecast/Plan) |
|---|---|---|
| Annual DPS | ¥100 | ¥108 (Progressive Dividend) |
| Share Buybacks | ¥100.0 billion | Consider additional shareholder returns based on business environment, financial base and management conditions |
| Total Return Ratio | 55.4% | 50% or more |
Medium-Term Plan / Topics
INPEX highlighted progress under its “Sustainable Growth of Corporate Value” initiatives: (1) enhancing capital efficiency through disciplined investment execution and strengthening earnings foundations, (2) building confidence in future growth through the August 2025 commencement of the FEED phase for the Abadi LNG Project, and (3) strengthening shareholder returns and dialogue with investors through the progressive dividend policy, enhanced disclosure, and active dialogue. The company’s year-end P/B ratio improved to 0.77 as of end-2025 (from 0.49 at end-2024) and reached 0.94 as of February 10; the company targets a P/B ratio of over 1x. INPEX targets an ROE of 10% or higher in 2035, partly through the “Profit Booster 500” initiative (a targeted profit contribution of ¥50 billion per year, ¥500 billion over 10 years). For the FY2025–FY2027 period, the Mid-term Business Plan targets growth investment of ¥1,900.0 billion or more, shareholder returns of ¥600.0 billion or more, and debt of ¥400.0 billion or more, with the net debt-to-equity ratio expected to remain within the 0.3–0.5 range even during the Abadi development phase (FY2028–FY2030).
Regarding progress against the FY2025–2027 Mid-term Business Plan (as shown in the appendix), INPEX reported 2 major incidents in FY2025 against a target of zero (FY2026 forecast: zero); a total shareholder return ratio of 55.4% in FY2025 (FY2026 forecast: 50% or more) against a Mid-term Business Plan target of a total return ratio of 50% or more with a progressive annual dividend starting at ¥90; CFFO of ¥862.6 billion in FY2025 (FY2026 forecast: ¥842.0 billion) against a 3-year cumulative Mid-term Business Plan target of ¥2,200.0 billion or more; and Net Carbon Intensity of 26kg/boe in FY2025 (FY2026 forecast: 27kg/boe) against a Mid-term Business Plan target of a 35% reduction versus 2019 levels and an FY2035 target of a 60% reduction. ROE was 8.2% in FY2025 (FY2026 forecast: 7.0%) against a Mid-term Business Plan target of exceeding the cost of equity and an FY2035 target of 10% or more; ROIC was 7.3% in FY2025 (FY2026 forecast: 6.0%) against a Mid-term Business Plan target of exceeding the WACC and an FY2035 target of 10% or more.
This article is an analysis based on publicly available information and is not a recommendation to buy or sell any specific securities. Investment decisions are your own responsibility.
![[Obayashi] Investors’ Guide 2026 — The Complete 24-Article Breakdown](https://japan-equity.com/wp-content/uploads/2026/07/hub_cover-1024x1024.png)
![[Obayashi] IR & SR Policy — Feeding Dialogue Back into Management](https://japan-equity.com/wp-content/uploads/2026/07/p32_sq-1024x1024.jpg)
![[Obayashi] Domestic Civil Engineering — Resilience Spending Supports 9.6% Margin](https://japan-equity.com/wp-content/uploads/2026/07/p11_sq-1024x1024.jpg)
![[Obayashi] Overseas Construction — Orders Reach ¥1.2tn](https://japan-equity.com/wp-content/uploads/2026/07/p15_sq-1024x1024.jpg)
![[Obayashi] Share Price & External Ratings — vs TOPIX, ESG Index Inclusion](https://japan-equity.com/wp-content/uploads/2026/07/p40_sq-1024x1024.jpg)
![[Construction] ¥75.5tn Investment, Shrinking Workforce — Big-5 Market Share](https://japan-equity.com/wp-content/uploads/2026/07/p12_sq-1024x1024.jpg)



![[Obayashi] Capital Policy & Shareholder Returns — ROE 10%+, DOE ~5%, ¥100bn Buyback](https://japan-equity.com/wp-content/uploads/2026/07/p27_sq-1024x1024.jpg)
![[Obayashi] Reducing Cross-Shareholdings — ¥285.2bn Sold in Five Years](https://japan-equity.com/wp-content/uploads/2026/07/p29_sq-1024x1024.jpg)
![[Obayashi] ¥750bn Investment Plan — ¥300bn to Development, ¥190bn to Tech/DX](https://japan-equity.com/wp-content/uploads/2026/07/p30_sq-1024x1024.jpg)
![[Obayashi] MTP2022 KPIs — Operating Profit ~2x Target, ROE 14.4%](https://japan-equity.com/wp-content/uploads/2026/07/p25_sq-1024x1024.jpg)
![[Obayashi] Cash Allocation — ¥420bn Investment CF Over Five Years](https://japan-equity.com/wp-content/uploads/2026/07/p26_sq-1024x1024.jpg)
![[Obayashi] Green Energy — 44 Plants, 344MW, and the Green Hydrogen Challenge](https://japan-equity.com/wp-content/uploads/2026/07/p21_sq-1024x1024.jpg)
![[Obayashi] Tackling the Labor Shortage — Robotics Construction®](https://japan-equity.com/wp-content/uploads/2026/07/p14_sq-1024x1024.jpg)
