
This article is based on publicly available IR materials and is not a recommendation to buy or sell any specific securities.
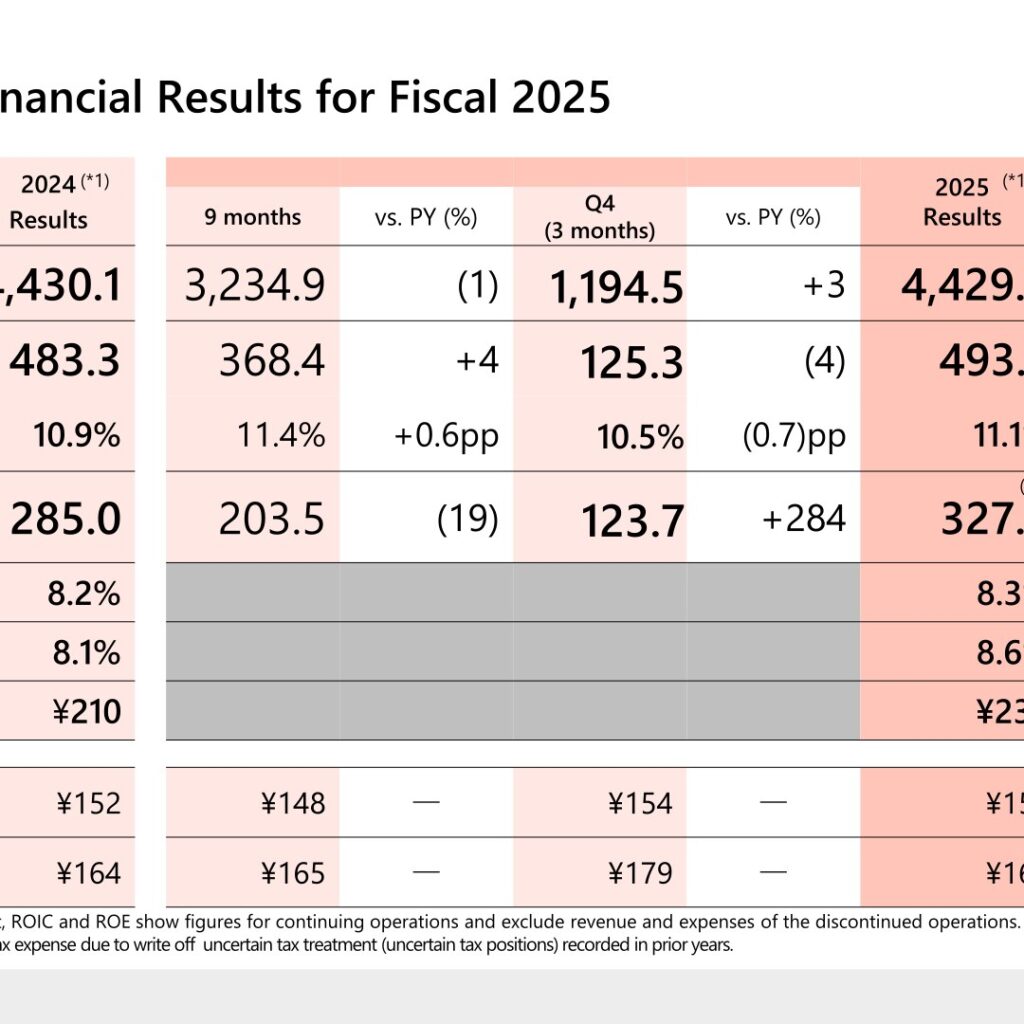
Bridgestone Corporation reported consolidated financial results for fiscal 2025 (the year ended December 31, 2025) with revenue of ¥4,429.5 billion, essentially flat year-on-year at (0)% versus the prior year, while Adjusted Operating Profit rose to ¥493.7 billion (+2% vs. PY; +4% excluding currency exchange impact), lifting the Adjusted Operating Profit margin to 11.1% (+0.2pp vs. PY; +0.4pp excluding FX). Profit Attributable to Owners of Parent increased 15% year-on-year to ¥327.3 billion (+42.3 billion yen vs. PY), reflecting both higher Adjusted Operating Profit and a ¥70.4 billion reversal of tax expense from the write-off of uncertain tax positions recorded in prior years. The annual dividend per share for FY2025 was ¥230, up ¥20 from FY2024. Bridgestone characterized the results as a decrease in revenue and increase in profit versus the prior year, or an increase in both revenue and profit when excluding currency exchange impact.
Consolidated Results (Full-Year Actual)
Business restructuring & rebuilding was described as almost completed as planned, and business cost reduction significantly exceeded the company’s February guidance: full-year business cost reduction benefit reached approximately ¥72 billion (+¥42 billion versus the February guidance), bringing the cumulative total for 2024–2025 to approximately ¥147 billion. By region, North America saw profit increase through restructuring & rebuilding, the passenger-tire multi-brand strategy, and steady truck & bus (TB) tire business performance; Latin America secured black-ink results despite a challenging business environment in Brazil; and Europe achieved a significant profit increase driven by restructuring & rebuilding, a turnaround in the TB business, and improvements in the retail business. The direct impact of U.S. tariffs on FY2025 results was approximately ¥25 billion (full year), which the company sought to minimize through measures including globally optimized supply chain management.
| Item | FY2025 | FY2024 | YoY Change | YoY Change (excl. FX) |
|---|---|---|---|---|
| Revenue | ¥4,429.5B | ¥4,430.1B | (0)% | +0% |
| Adjusted Operating Profit | ¥493.7B | ¥483.3B | +2% | +4% |
| Margin | 11.1% | 10.9% | +0.2pp | +0.4pp |
| Profit Attributable to Owners of Parent | ¥327.3B | ¥285.0B | +15% | Not stated in the materials |
| ROIC | 8.3% | 8.2% | +0.2pp | Not stated in the materials |
| ROE | 8.6% | 8.1% | +0.5pp | Not stated in the materials |
| Dividend per Share | ¥230 | ¥210 | +¥20 | Not stated in the materials |
Reconciling Adjusted Operating Profit of ¥493.7 billion to Operating Profit, Bridgestone recorded total Adjustment Items of ¥112.5 billion in FY2025, comprising EU TB/Retread/Retail/AG tire plant rebuilding of ¥38.3 billion, North America TB tire plant rebuilding of ¥26.6 billion, Latin America business rebuilding of ¥12.8 billion, an Air Spring business impairment in the Americas of ¥10.9 billion, North America AG tire plant/business footprint optimization of ¥5.5 billion, and other items of ¥18.4 billion, resulting in Operating Profit of ¥381.2 billion, Profit Before Tax of ¥354.7 billion, Profit from Continuing Operations of ¥317.1 billion, and Profit from Discontinued Operations of ¥10.2 billion. On the balance sheet, as of December 31, 2025, Total Assets were ¥5,747.7 billion (+¥24.2 billion vs. December 31, 2024), Total Equity was ¥3,719.9 billion (down ¥66.6 billion), and the Equity Ratio was 63.7% (down 1.5pp vs. December 31, 2024). Cash Flows from Operating Activities were ¥660.4 billion (+¥111.6 billion vs. PY) and Free Cash Flow was ¥435.5 billion (+¥141.7 billion vs. PY).
Segment Results
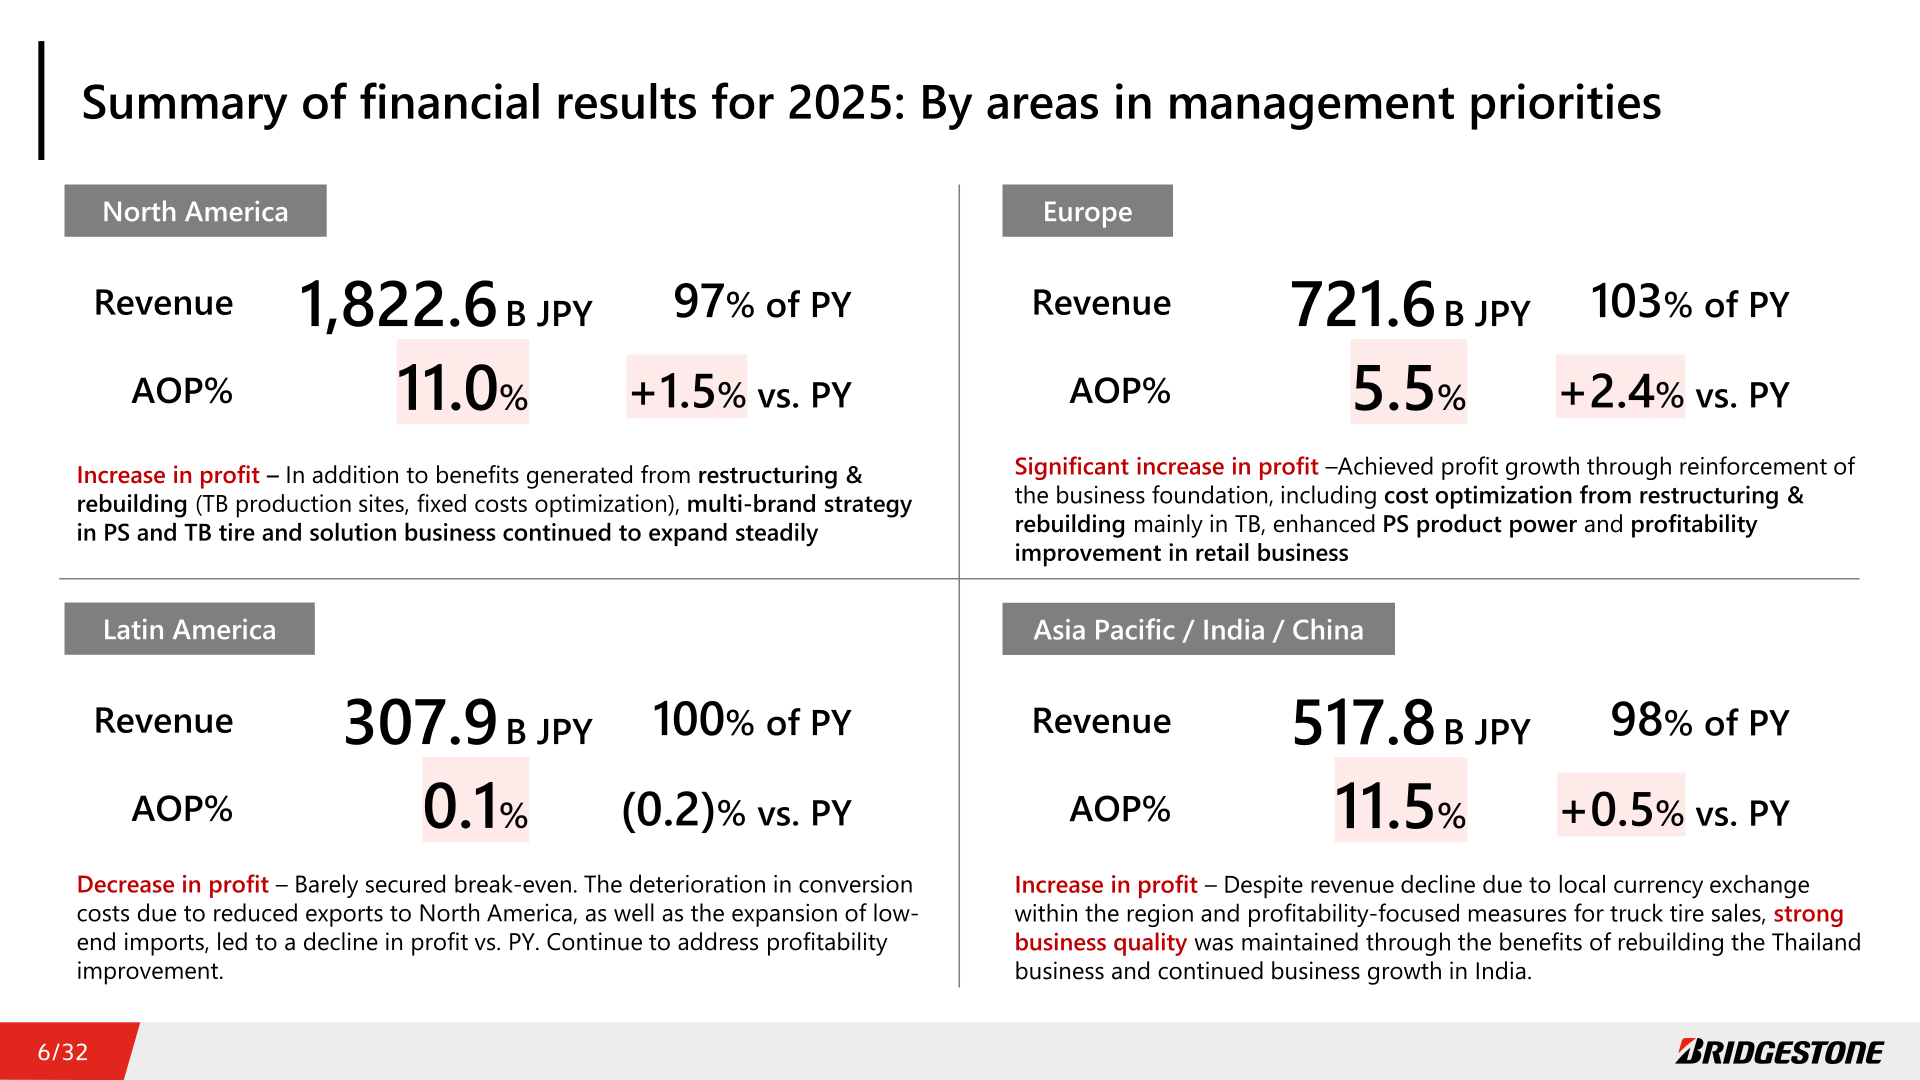
Bridgestone reports segment results across four regions: Japan, Asia/Pacific/India and China, Americas, and Europe/Middle East and Africa. In FY2025, Japan achieved higher revenue on robust ultra-large mining tire sales and expanded replacement tire sales, with profit increasing on higher sales volume and price/mix improvement. Asia, Pacific, India and China saw a revenue decline from negative local currency fluctuations within the region, but thorough lean expense management and business-rebuilding benefits contributed to a year-on-year profit increase and margin improvement. In the Americas, robust truck & bus (TB) replacement tire sales and business-rebuilding benefits in North America led to profit increase and margin improvement, while Latin America secured black-ink results, with performance improving year-on-year in the second half despite Brazil’s continued challenging business environment. Europe, Middle East and Africa recorded revenue and profit growth with improved margins, driven by increased premium tire sales in Europe (primarily HRD tires) and steady progress in business rebuilding, mainly in the TB business.
| Segment | Metric | FY2025 | FY2024 | YoY Change |
|---|---|---|---|---|
| Japan | Revenue | ¥1,265.9B | ¥1,226.1B | +3% |
| Japan | Adjusted Operating Profit | ¥198.1B | ¥187.3B | +6% |
| Japan | Margin | 15.7% | 15.3% | +0.4pp |
| Asia, Pacific, India and China | Revenue | ¥517.8B | ¥529.7B | (2)% |
| Asia, Pacific, India and China | Adjusted Operating Profit | ¥59.6B | ¥58.5B | +2% |
| Asia, Pacific, India and China | Margin | 11.5% | 11.0% | +0.5pp |
| Americas | Revenue | ¥2,130.5B | ¥2,180.0B | (2)% |
| Americas | Adjusted Operating Profit | ¥201.5B | ¥180.1B | +12% |
| Americas | Margin | 9.5% | 8.3% | +1.2pp |
| Europe, Middle East and Africa | Revenue | ¥852.9B | ¥835.6B | +2% |
| Europe, Middle East and Africa | Adjusted Operating Profit | ¥42.4B | ¥29.8B | +42% |
| Europe, Middle East and Africa | Margin | 5.0% | 3.6% | +1.4pp |
FY2026 Forecast
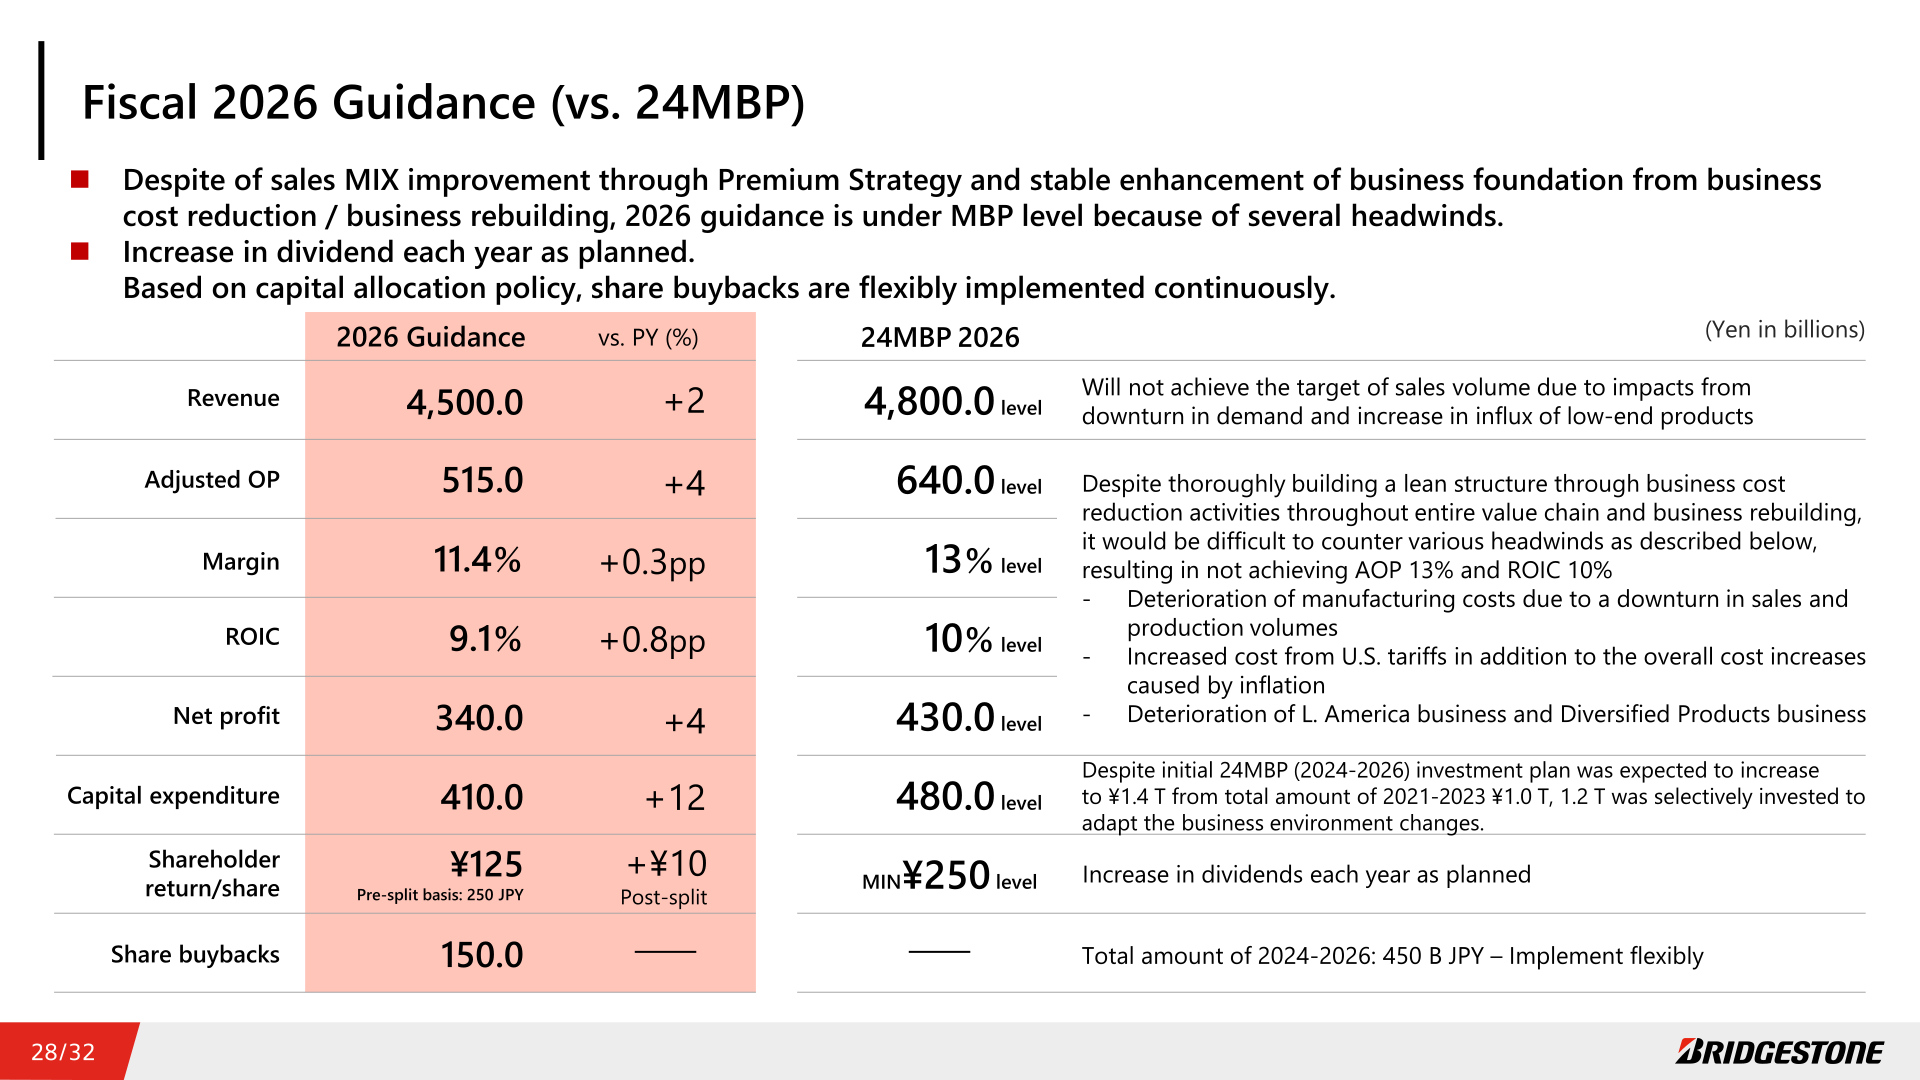
For fiscal 2026 (the year ending December 31, 2026), Bridgestone guides for Revenue of ¥4,500.0 billion (+2% vs. PY), Adjusted Operating Profit of ¥515.0 billion (+4%), margin of 11.4% (+0.3pp), Profit Attributable to Owners of Parent of ¥340.0 billion (+4%), ROIC of 9.1% (+0.8pp vs. FY2025’s 8.3%), and ROE of 9.5% (+0.9pp vs. FY2025’s 8.6%). Growth is planned mainly in the PS/TB replacement tire business: for passenger tires, despite a decline in OE demand, the company plans sales exceeding demand in the replacement market and continued sales growth in HRD tires with an increased sales mix; for truck & bus tires, steady replacement sales growth is planned in line with expanding solutions business; original-equipment (OR) sales are expected to be maintained at a solid level. The company plans to continue reinforcing business cost reduction and enhancing productivity, with benefits from business restructuring & rebuilding continuing to contribute steadily to financial performance. The estimated direct impact of U.S. tariffs on FY2026 is approximately ¥55 billion, with some impact expected to remain despite continued mitigation efforts.
| Item | FY2025 Results | FY2026 Guidance | YoY Change |
|---|---|---|---|
| Revenue | ¥4,429.5B | ¥4,500.0B | +2% |
| Adjusted Operating Profit | ¥493.7B | ¥515.0B | +4% |
| Margin | 11.1% | 11.4% | +0.3pp |
| Profit Attributable to Owners of Parent | ¥327.3B | ¥340.0B | +4% |
| ROIC | 8.3% | 9.1% | +0.8pp |
| ROE | 8.6% | 9.5% | +0.9pp |
| Dividend per Share (post-split basis) | ¥115 | ¥125 | +¥10 |
| Dividend per Share (pre-split basis, reference) | ¥230 | ¥250 | +¥20 |
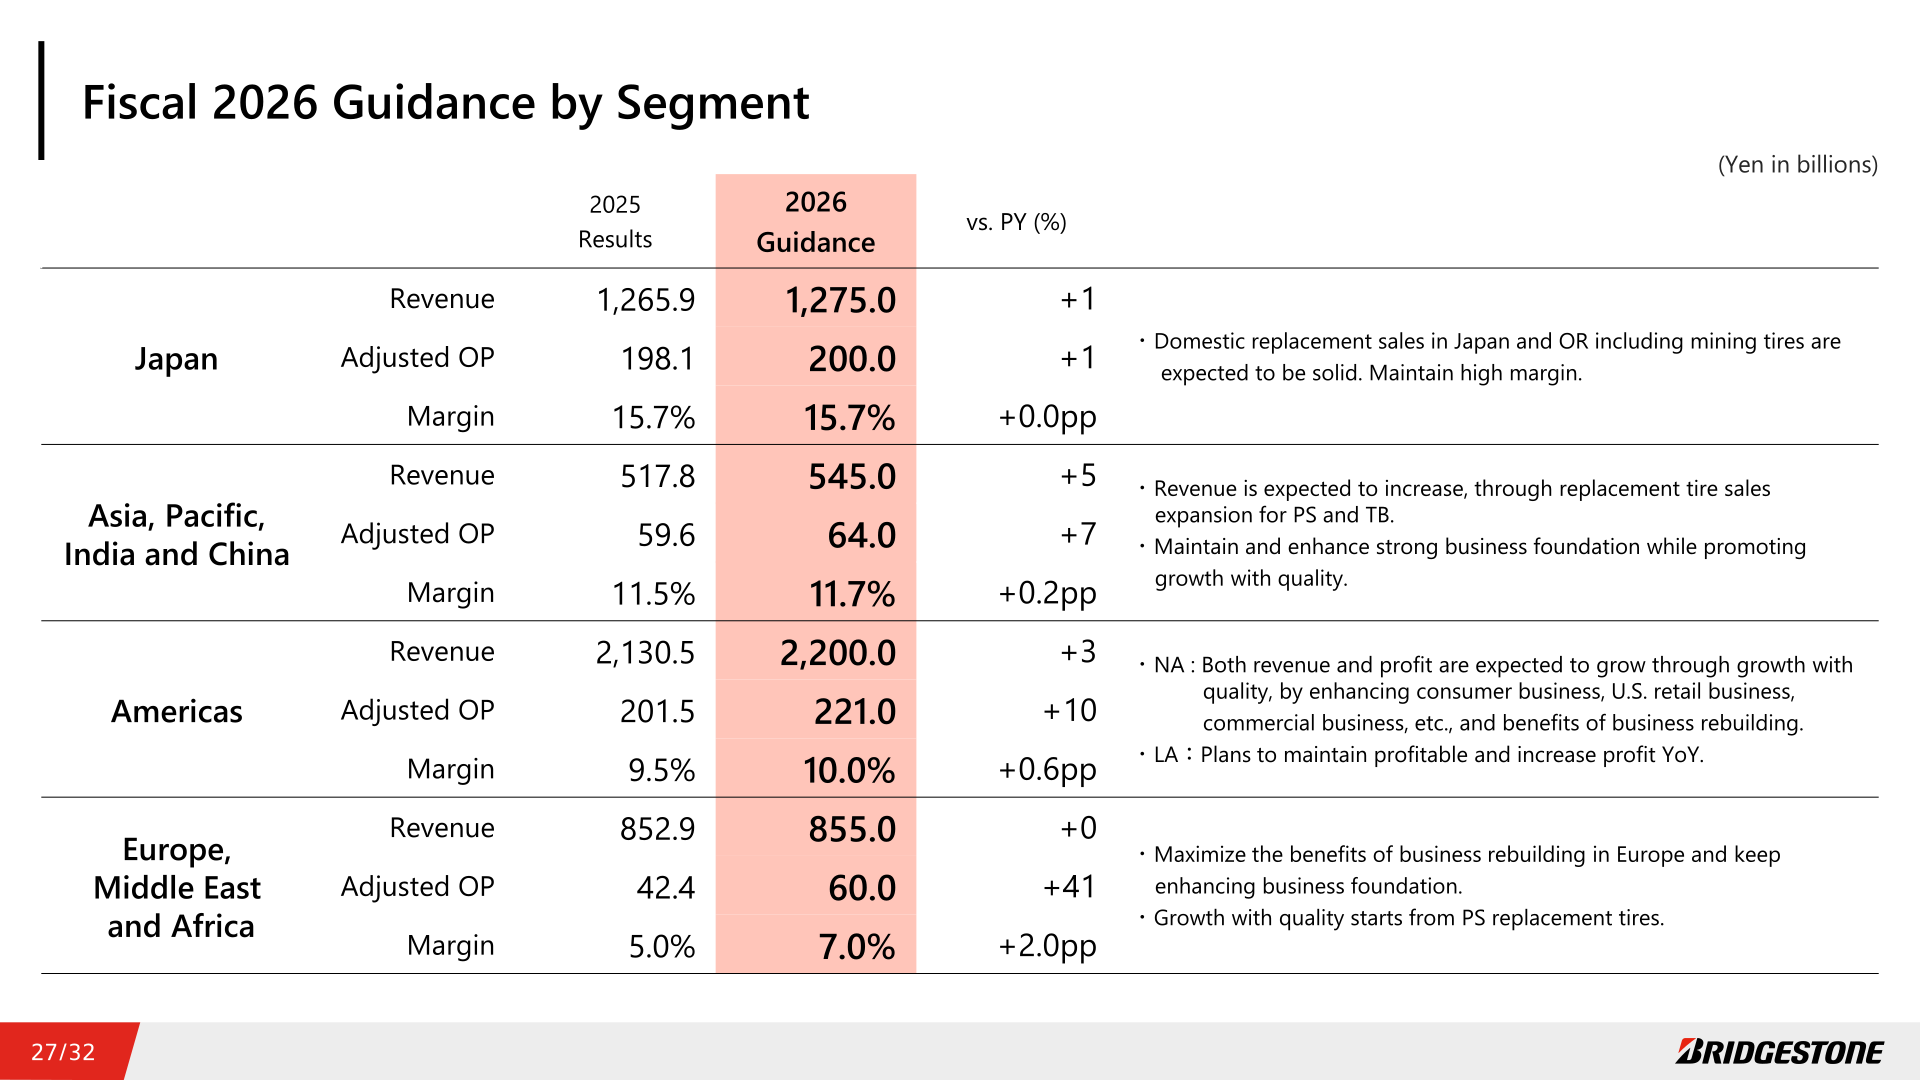
By segment, FY2026 guidance calls for revenue and Adjusted Operating Profit growth in all four regions versus FY2025 results: Japan revenue of ¥1,275.0 billion (+1%) and Adjusted Operating Profit of ¥200.0 billion (+1%, margin 15.7%, +0.0pp); Asia, Pacific, India and China revenue of ¥545.0 billion (+5%) and Adjusted Operating Profit of ¥64.0 billion (+7%, margin 11.7%, +0.2pp); Americas revenue of ¥2,200.0 billion (+3%) and Adjusted Operating Profit of ¥221.0 billion (+10%, margin 10.0%, +0.6pp); and Europe, Middle East and Africa revenue of ¥855.0 billion (+0%) and Adjusted Operating Profit of ¥60.0 billion (+41%, margin 7.0%, +2.0pp).
Shareholder Returns
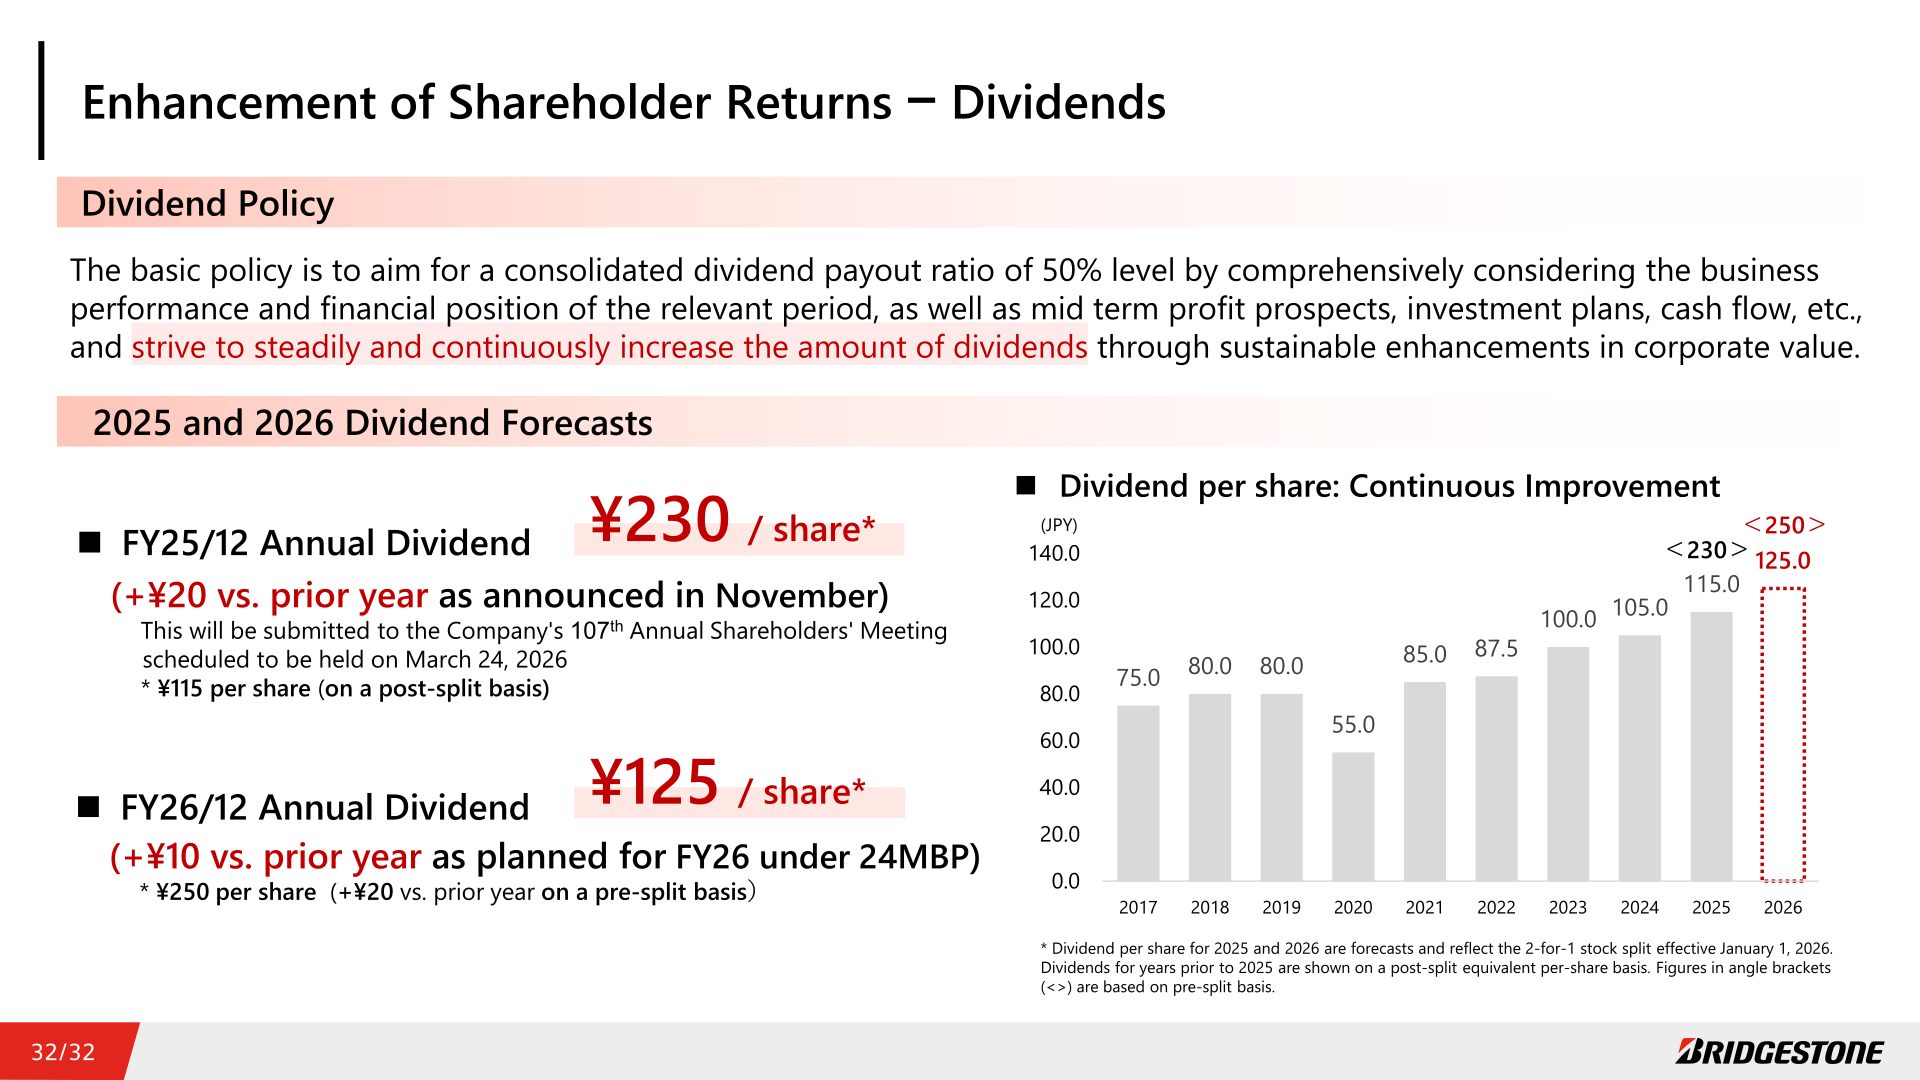
Bridgestone’s basic dividend policy is to aim for a consolidated dividend payout ratio at the 50% level, comprehensively considering business performance, financial position, mid-term profit prospects, investment plans, and cash flow, while striving to steadily and continuously increase dividend amounts. The FY2025 (year ended December 31, 2025) annual dividend per share was ¥230 (+¥20 vs. prior year, as announced in November), equivalent to ¥115 per share on a post-split basis reflecting the 2-for-1 stock split effective January 1, 2026; this dividend will be submitted to the company’s 107th Annual Shareholders’ Meeting scheduled for March 24, 2026. For FY2026 (year ending December 31, 2026), Bridgestone plans an annual dividend of ¥125 per share on a post-split basis (+¥10 vs. prior year, as planned under the 24MBP), equivalent to ¥250 per share on a pre-split basis (+¥20 vs. prior year on a pre-split basis). On capital policy, the FY2025 treasury stock acquisition of up to ¥300.0 billion and debt financing of ¥200.0 billion were both implemented as planned, and all acquired treasury stock was cancelled. For FY2026, the company determined to acquire treasury stock of up to ¥150.0 billion / up to 60 million shares, and plans to raise ¥150.0 billion through debt financing, continuing its disciplined financial strategy of building an optimal capital structure while maintaining industry-leading credit ratings.
| Item | Value |
|---|---|
| FY2025 Annual Dividend per Share | ¥230 (+¥20 vs. PY); ¥115 per share on a post-split basis |
| FY2026 Annual Dividend per Share (Plan) | ¥125 post-split basis (+¥10 vs. PY); ¥250 on a pre-split basis (+¥20 vs. PY, pre-split) |
| FY2025 Treasury Stock Acquisition | Up to ¥300.0 billion (max.); implemented as planned; all acquired shares cancelled (7.3% of total shares issued prior to cancellation, excl. treasury stock) |
| FY2025 Debt Financing | ¥200.0 billion raised as planned (April: ¥100.0B straight bonds + ¥60.0B syndicated loan; October: ¥40.0B syndicated loan) |
| FY2026 Share Buyback Plan | Up to ¥150.0 billion / up to 60 million shares (February 17, 2026 – August 31, 2026); all acquired treasury stock scheduled to be cancelled in September 2026 |
| FY2026 Debt Financing Plan | Plans to raise funds at ¥150.0 billion through debt financing |
| Credit Ratings (as of Feb 2026) | Moody’s Japan K.K. (Moody’s): A1; Standard & Poor’s (S&P): A; Rating and Investment Information (R&I): AA+; Japan Credit Rating Agency (JCR): AA+ |
Medium-Term Plan / Topics
FY2026 is the final year of Bridgestone’s 24MBP (2024–2026 Mid-Term Business Plan), positioned as the year to move toward growth with quality, following FY2025, which the company described as the year of Emergency and Crisis Management. Global business cost reduction reached a cumulative total of approximately ¥147 billion for 2024–2025, exceeding the 24MBP’s cumulative target of approximately ¥100 billion one year ahead of schedule. The ratio of replacement passenger and light-truck tires equipped with the company’s ENLITEN technology rose from 23% in 2024 to 39% in 2025, with the cumulative number of ENLITEN-equipped products launched increasing from 20 in 2024 to 32 in 2025. However, Bridgestone stated that FY2026 guidance remains below 24MBP target levels: versus 24MBP targets of Revenue at the ¥4,800.0 billion level, Adjusted Operating Profit at the ¥640.0 billion level, margin at the 13% level, and ROIC at the 10% level, FY2026 guidance calls for Revenue of ¥4,500.0 billion, Adjusted Operating Profit of ¥515.0 billion, margin of 11.4%, and ROIC of 9.1%. The company attributed this gap to headwinds including deterioration of manufacturing costs from a downturn in sales and production volumes, increased costs from U.S. tariffs in addition to overall inflation-driven cost increases, and deterioration in the Latin America business and Diversified Products business. Cumulative capital expenditure for 2024–2026 is now expected at approximately ¥1.2 trillion, versus an initial 24MBP plan of approximately ¥1.4 trillion, reflecting selective investment amid business environment changes, while cumulative shareholder returns (dividends and share buybacks) for 2024–2026 are planned to total ¥450.0 billion, to be implemented flexibly.
This article is an analysis based on publicly available information and is not a recommendation to buy or sell any specific securities. Investment decisions are your own responsibility.
![[Obayashi] Investors’ Guide 2026 — The Complete 24-Article Breakdown](https://japan-equity.com/wp-content/uploads/2026/07/hub_cover-1024x1024.png)
![[Obayashi] IR & SR Policy — Feeding Dialogue Back into Management](https://japan-equity.com/wp-content/uploads/2026/07/p32_sq-1024x1024.jpg)
![[Obayashi] Real Estate Development — 18.7% Margin, ¥287.7bn Unrealized Gains](https://japan-equity.com/wp-content/uploads/2026/07/p20_sq-1024x1024.jpg)
![[Obayashi] Domestic Civil Engineering — Resilience Spending Supports 9.6% Margin](https://japan-equity.com/wp-content/uploads/2026/07/p11_sq-1024x1024.jpg)
![[Obayashi] Share Price & External Ratings — vs TOPIX, ESG Index Inclusion](https://japan-equity.com/wp-content/uploads/2026/07/p40_sq-1024x1024.jpg)
![[Construction] ¥75.5tn Investment, Shrinking Workforce — Big-5 Market Share](https://japan-equity.com/wp-content/uploads/2026/07/p12_sq-1024x1024.jpg)



![[Obayashi] Capital Policy & Shareholder Returns — ROE 10%+, DOE ~5%, ¥100bn Buyback](https://japan-equity.com/wp-content/uploads/2026/07/p27_sq-1024x1024.jpg)
![[Obayashi] Reducing Cross-Shareholdings — ¥285.2bn Sold in Five Years](https://japan-equity.com/wp-content/uploads/2026/07/p29_sq-1024x1024.jpg)
![[Obayashi] ¥750bn Investment Plan — ¥300bn to Development, ¥190bn to Tech/DX](https://japan-equity.com/wp-content/uploads/2026/07/p30_sq-1024x1024.jpg)
![[Obayashi] MTP2022 KPIs — Operating Profit ~2x Target, ROE 14.4%](https://japan-equity.com/wp-content/uploads/2026/07/p25_sq-1024x1024.jpg)
![[Obayashi] Cash Allocation — ¥420bn Investment CF Over Five Years](https://japan-equity.com/wp-content/uploads/2026/07/p26_sq-1024x1024.jpg)
![[Obayashi] Green Energy — 44 Plants, 344MW, and the Green Hydrogen Challenge](https://japan-equity.com/wp-content/uploads/2026/07/p21_sq-1024x1024.jpg)
![[Obayashi] Tackling the Labor Shortage — Robotics Construction®](https://japan-equity.com/wp-content/uploads/2026/07/p14_sq-1024x1024.jpg)
