
This article is based on publicly available IR materials and is not a recommendation to buy or sell any specific securities.
Note: This site classifies each company’s most recently completed full fiscal year as “FY2025”. Daio Paper Corporation’s materials label this period “FY2026/3” (FY26/3, the fiscal year ended March 31, 2026), and that labeling is retained in the body and tables below. Amounts in the materials are rounded off to the nearest 0.1 billion yen.
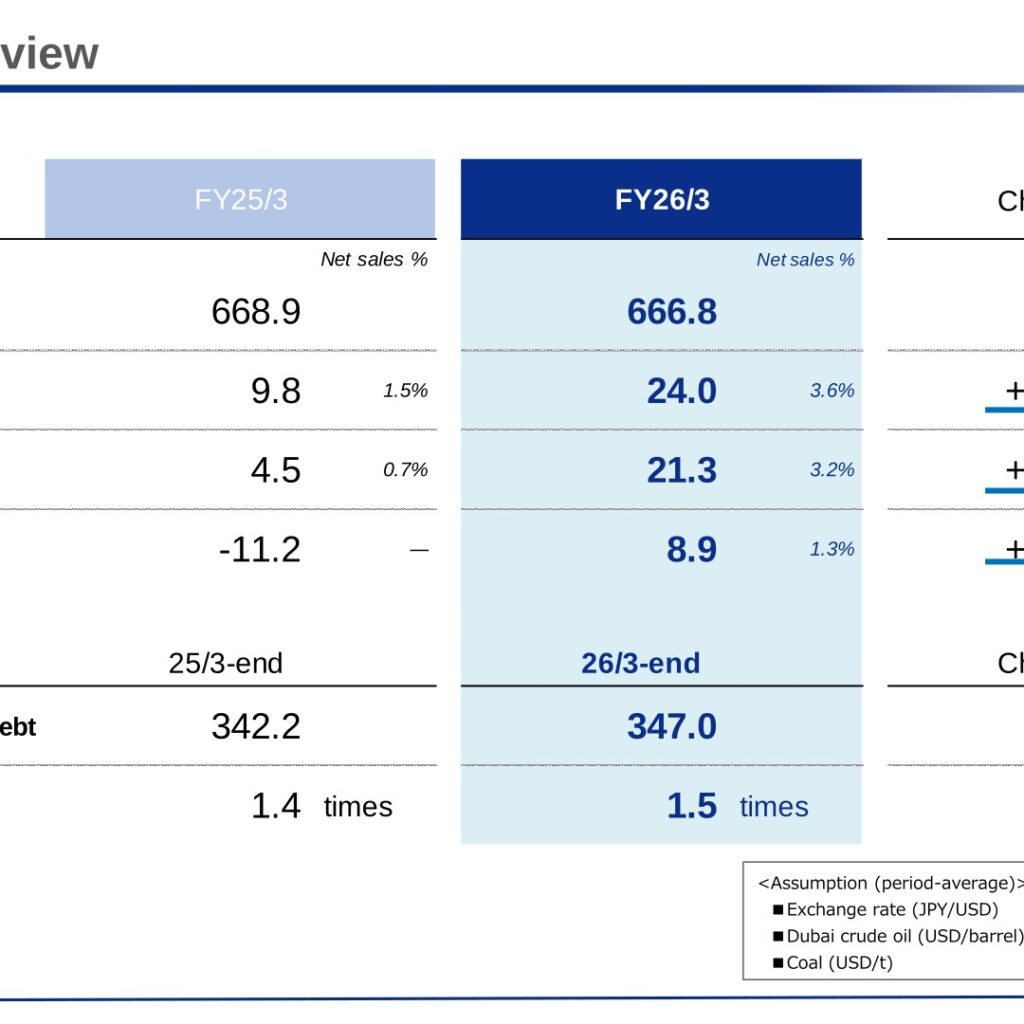
Daio Paper Corporation (3880) reported FY2026/3 net sales of 666.8 billion yen (-2.1 billion yen, -0.3% YoY) and operating profit of 24.0 billion yen (+14.2 billion yen, 145.0% YoY). According to the company, operating profit, ordinary profit and profit attributable to owners of parent all exceeded the previous fiscal year and achieved the initial forecast. Structural reforms in the Home & Personal Care (H&PC) overseas business delivered visible results and contributed significantly to profit improvement, while profit attributable to owners of parent swung to 8.9 billion yen from -11.2 billion yen. For FY2027/3 the company forecasts net sales of 680.0 billion yen and operating profit of 24.0 billion yen, flat YoY, reflecting Middle East uncertainties and foreign exchange.
Consolidated Results (Full-Year Actual)
Net sales edged down to 666.8 billion yen from 668.9 billion yen. Operating profit rose to 24.0 billion yen from 9.8 billion yen, lifting the operating margin to 3.6% from 1.5%. Ordinary profit increased to 21.3 billion yen from 4.5 billion yen (+16.8 billion yen, 371.0%), and profit attributable to owners of parent was 8.9 billion yen compared with -11.2 billion yen in FY25/3 (+20.1 billion yen). Net interest-bearing debt at the end of March 2026 was 347.0 billion yen (+4.8 billion yen), and the net D/E ratio was 1.5 times (+0.1). Period-average assumptions were an exchange rate of 150.7 JPY/USD (FY25/3: 152.6), Dubai crude oil at 72.1 USD/barrel (FY25/3: 78.5) and coal at 108 USD/t (FY25/3: 172).
| Item (Billions of yen) | FY26/3 | FY25/3 | Change |
|---|---|---|---|
| Net sales | 666.8 | 668.9 | -2.1 (-0.3%) |
| Operating profit | 24.0 | 9.8 | +14.2 (145.0%) |
| Operating margin | 3.6% | 1.5% | ― |
| Ordinary profit | 21.3 | 4.5 | +16.8 (371.0%) |
| Profit attributable to owners of parent | 8.9 | -11.2 | +20.1 |
| Net interest-bearing debt (fiscal year-end) | 347.0 | 342.2 | +4.8 |
| Net D/E ratio (fiscal year-end) | 1.5 times | 1.4 times | +0.1 |
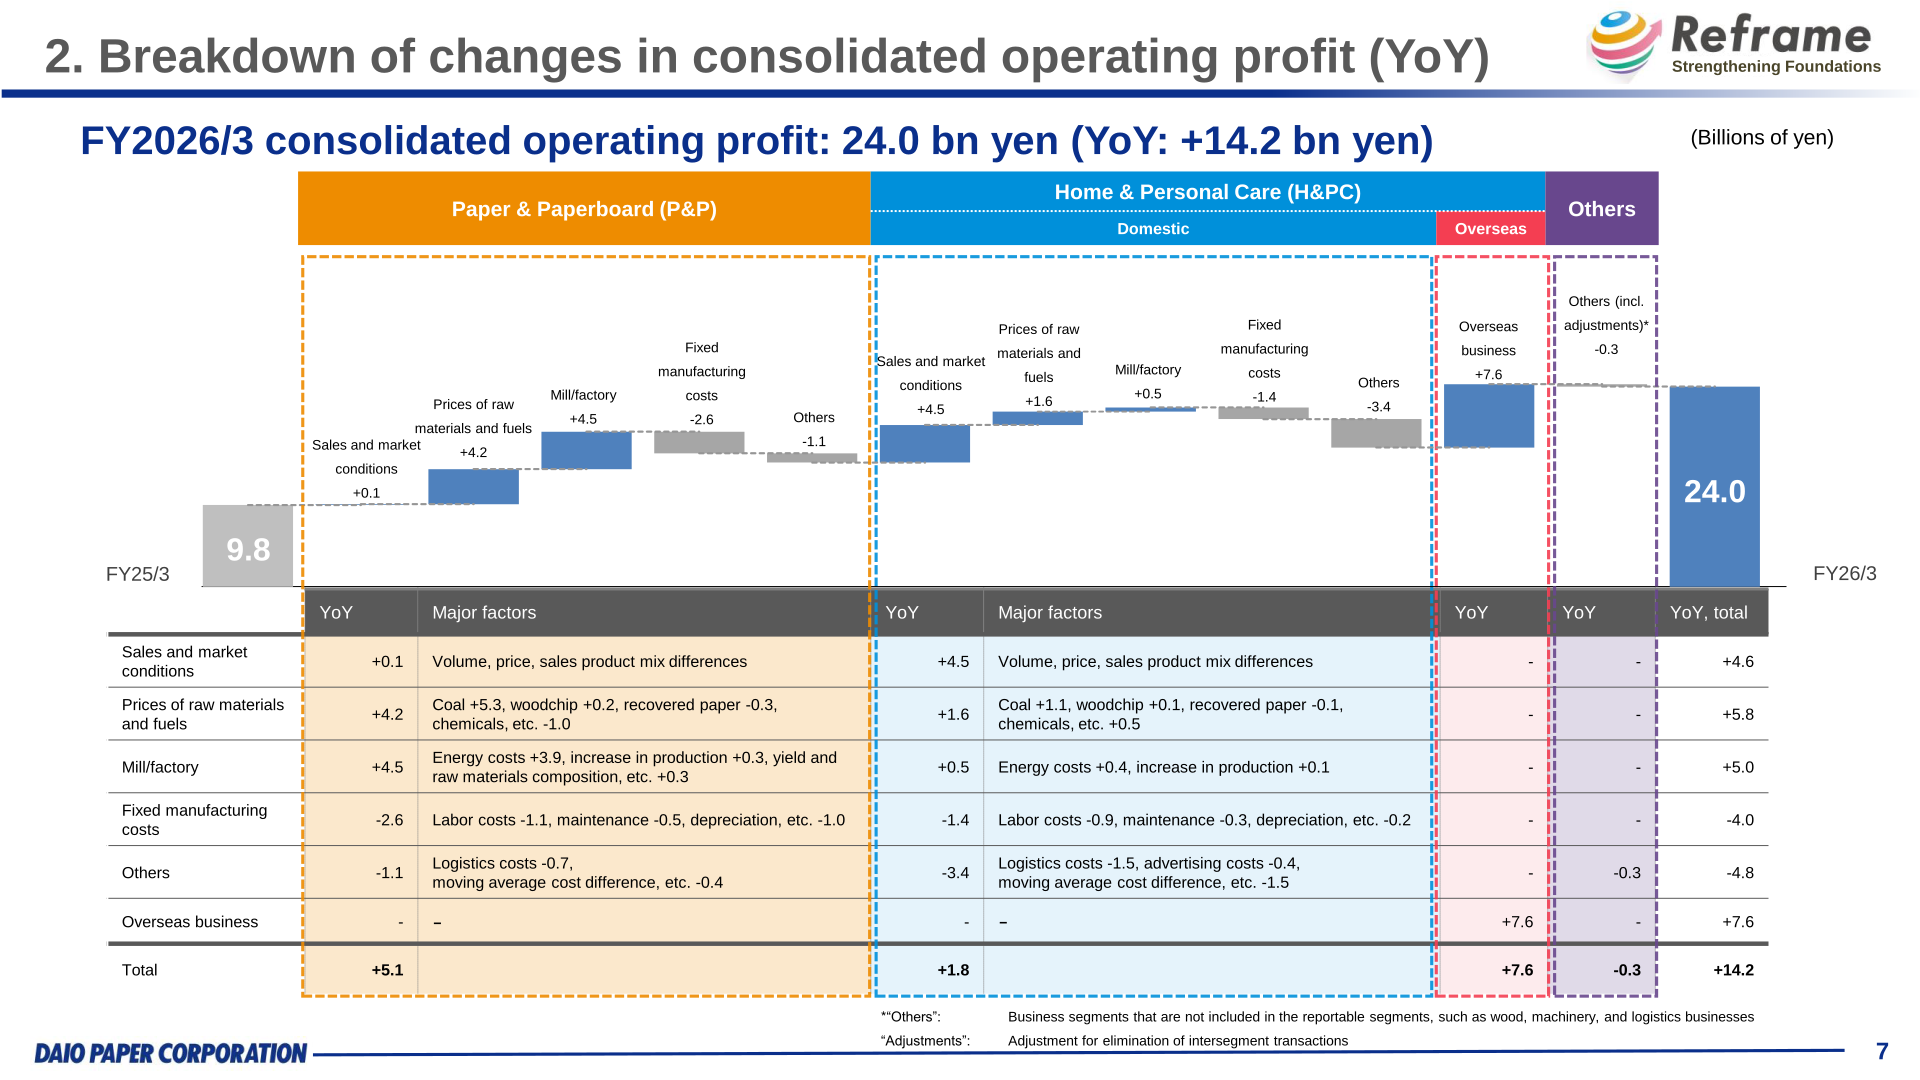
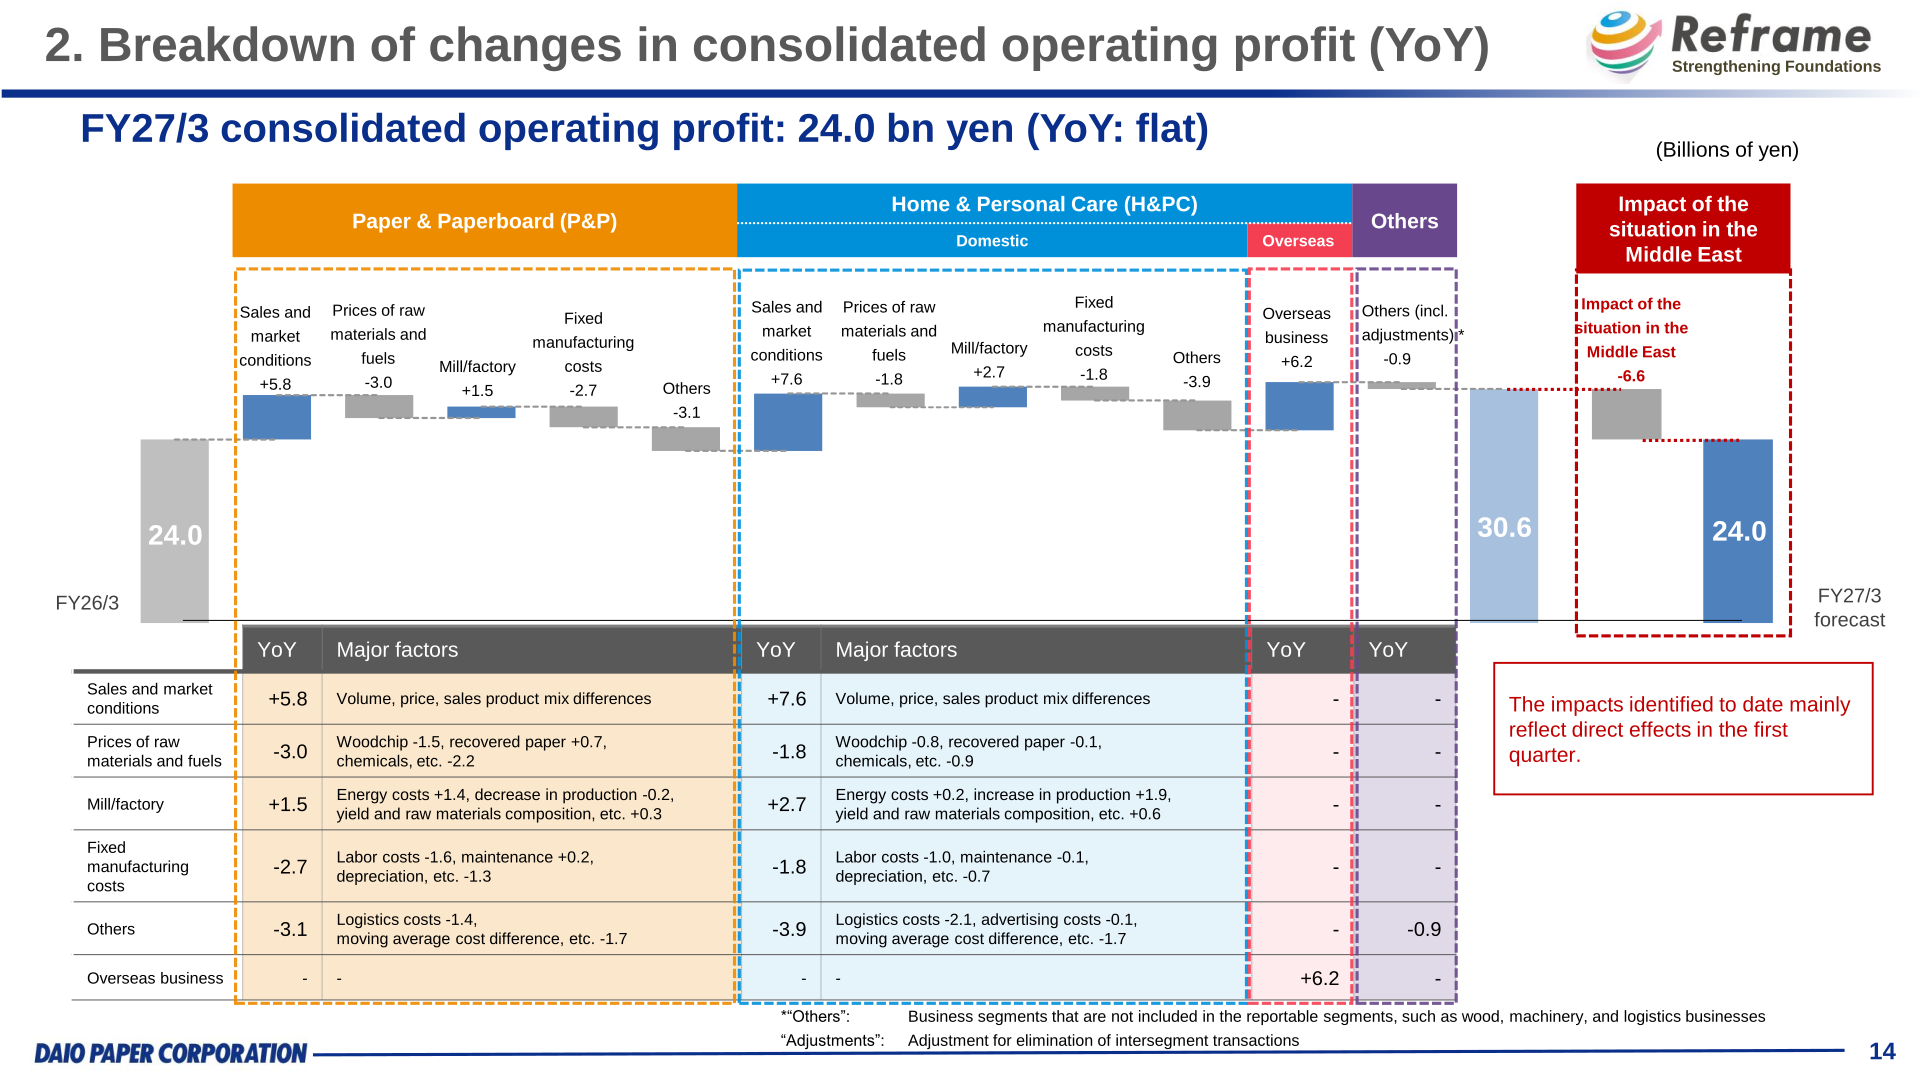
By factor, the 14.2 billion yen increase in consolidated operating profit breaks down into sales and market conditions of +4.6 billion yen, prices of raw materials and fuels of +5.8 billion yen, mill/factory of +5.0 billion yen, fixed manufacturing costs of -4.0 billion yen, others of -4.8 billion yen and the overseas business of +7.6 billion yen. In Paper & Paperboard (P&P), raw material and fuel prices contributed +4.2 billion yen (including coal +5.3 billion yen) and mill/factory +4.5 billion yen (including energy costs +3.9 billion yen). In the H&PC domestic business, sales and market conditions contributed +4.5 billion yen.
Segment Results
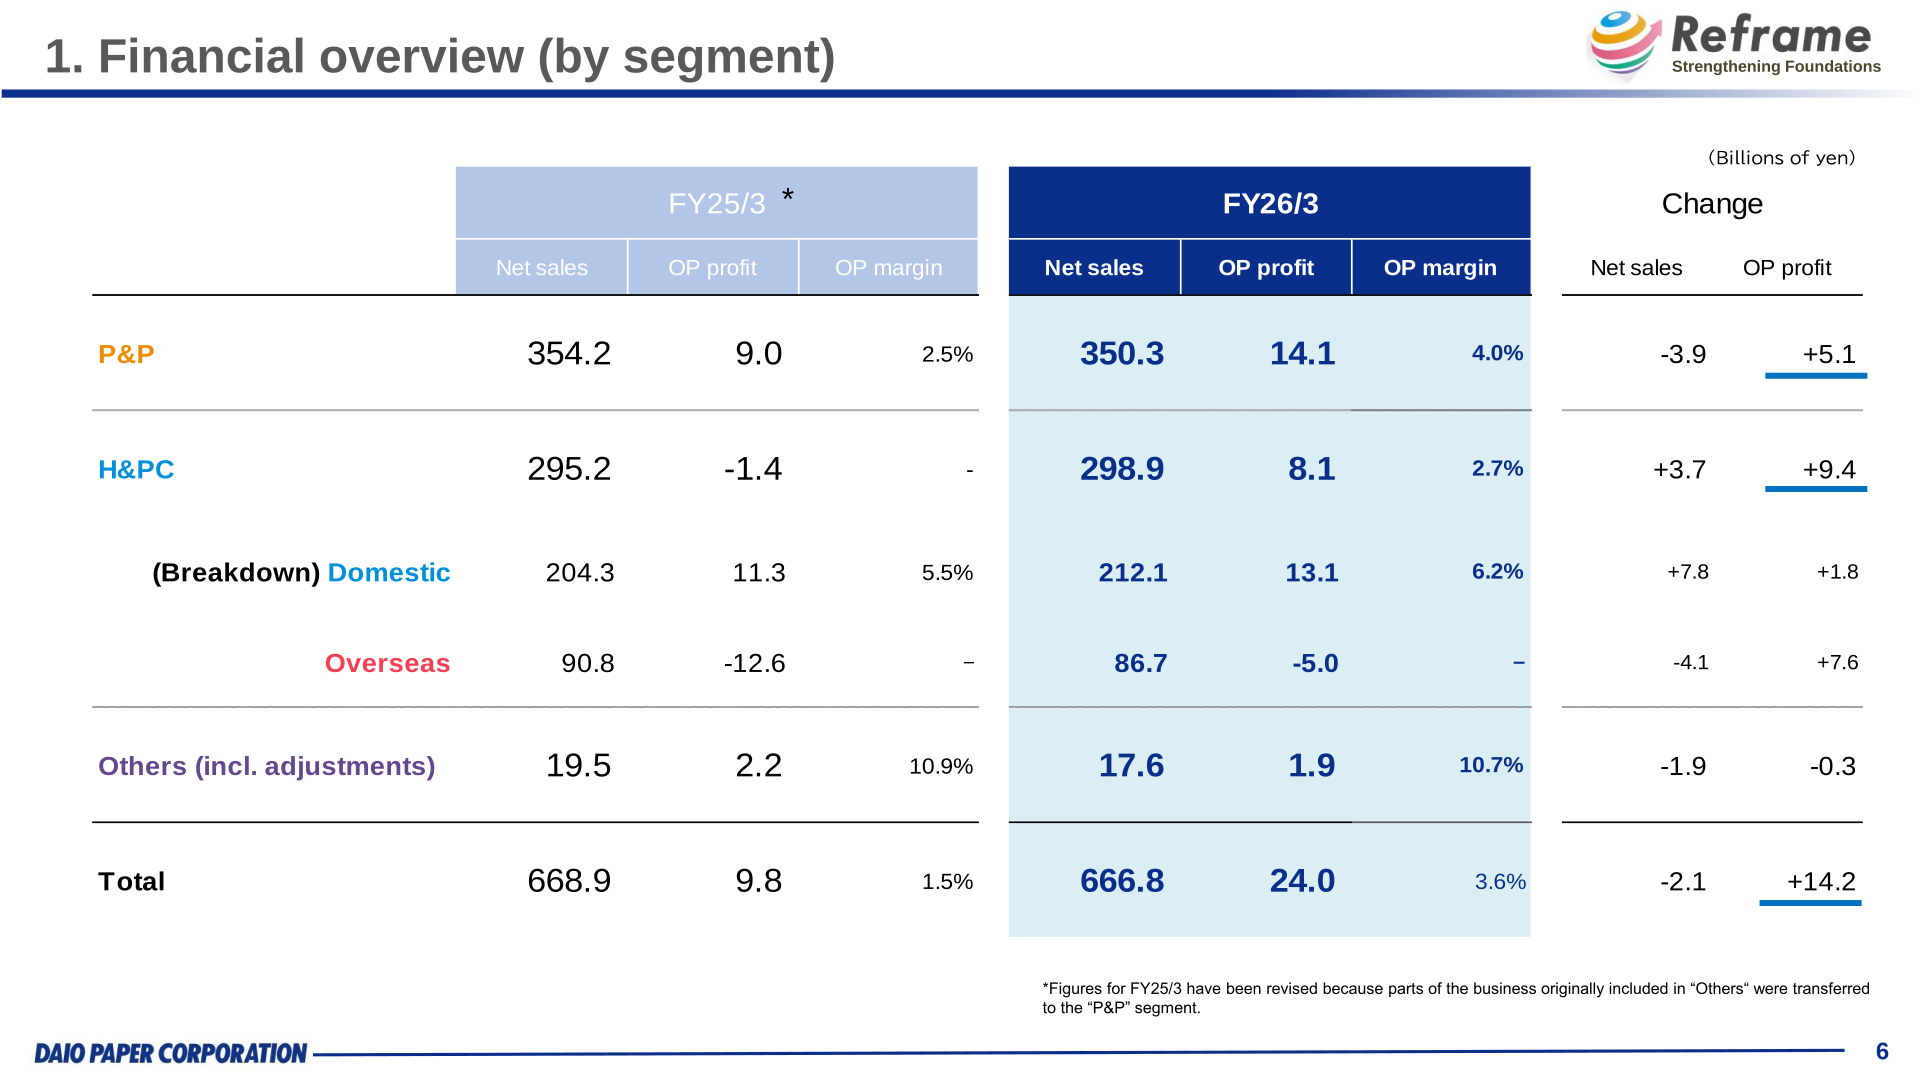
P&P net sales were 350.3 billion yen (-3.9 billion yen, -1.1%) and operating profit rose to 14.1 billion yen (+5.1 billion yen, +56.7%), with the operating margin at 4.0% (FY25/3: 2.5%). The company cites cost reductions despite declining demand, including the spread of price revisions for paper amid accelerating paperless trends, growth in sales of products for the EC market and environmentally-friendly products, and an increase in export sales of containerboard and corrugated container. H&PC net sales were 298.9 billion yen and operating profit 8.1 billion yen (FY25/3: -1.4 billion yen). Within H&PC, the domestic business posted net sales of 212.1 billion yen (+7.8 billion yen, +3.8%) and operating profit of 13.1 billion yen (+1.8 billion yen, +16.4%), supported by growth in value-added sanitary paper products such as soft pack tissues and larger-volume toilet paper, strong pet care sales and the spread of price revisions. The overseas business recorded net sales of 86.7 billion yen (-4.1 billion yen, -4.5%) and an operating loss narrowed to -5.0 billion yen from -12.6 billion yen (+7.6 billion yen). Figures for FY25/3 have been revised because parts of the business originally included in “Others” were transferred to the P&P segment.
| Segment | Metric (Billions of yen) | FY26/3 | FY25/3 | Change |
|---|---|---|---|---|
| P&P | Net sales | 350.3 | 354.2 | -3.9 |
| P&P | Operating profit | 14.1 | 9.0 | +5.1 |
| H&PC | Net sales | 298.9 | 295.2 | +3.7 |
| H&PC | Operating profit | 8.1 | -1.4 | +9.4 |
| H&PC (Domestic) | Net sales | 212.1 | 204.3 | +7.8 |
| H&PC (Domestic) | Operating profit | 13.1 | 11.3 | +1.8 |
| H&PC (Overseas) | Net sales | 86.7 | 90.8 | -4.1 |
| H&PC (Overseas) | Operating profit | -5.0 | -12.6 | +7.6 |
| Others (incl. adjustments) | Net sales | 17.6 | 19.5 | -1.9 |
| Others (incl. adjustments) | Operating profit | 1.9 | 2.2 | -0.3 |
| Total | Net sales | 666.8 | 668.9 | -2.1 |
| Total | Operating profit | 24.0 | 9.8 | +14.2 |
In the H&PC overseas business, sales in Central and South America (Brazil) recovered as distributors optimized inventory, with a foreign exchange impact from the strong Brazilian real, and Southeast Asia (Thailand, etc.) saw growth in sales of adult care value-added products. In East Asia (China, etc.), growth in adult care products was offset by a decrease in sales of baby care products.
FY2027/3 Forecast
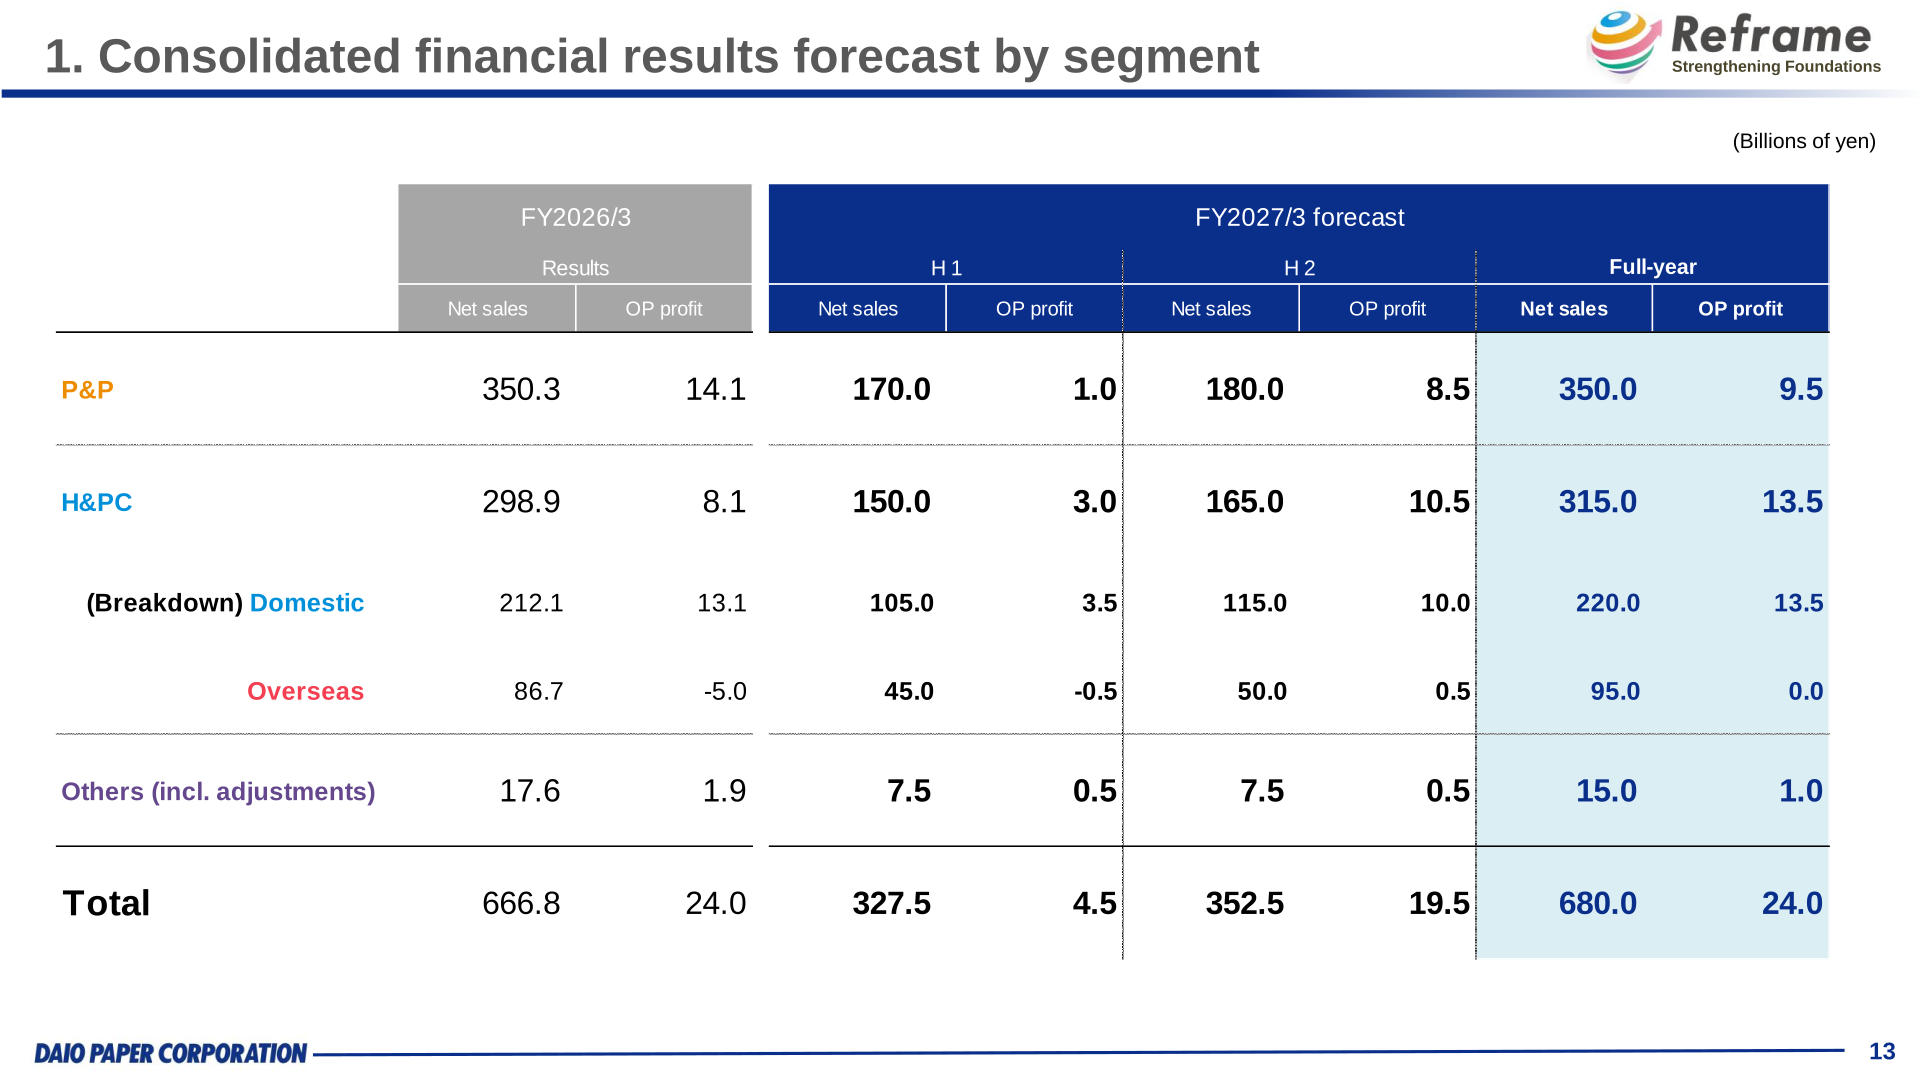
For FY2027/3 the company forecasts net sales of 680.0 billion yen (+13.2 billion yen, 2.0%), operating profit of 24.0 billion yen (±0.0), ordinary profit of 17.0 billion yen (-4.3 billion yen, -20.3%) and profit attributable to owners of parent of 12.0 billion yen (+3.1 billion yen, 35.0%). Net interest-bearing debt is expected to fall to 315.0 billion yen (-32.0 billion yen) and the net D/E ratio to 1.3 times. Assumptions are 155.0 JPY/USD, Dubai crude oil at 69.8 USD/barrel and coal at 112 USD/t. In the operating profit bridge, segment factors add up to 30.6 billion yen before an impact of the situation in the Middle East of -6.6 billion yen, which the company says mainly reflects direct effects in the first quarter identified to date. The H&PC overseas business is expected to contribute +6.2 billion yen as the benefits of structural reforms continue, bringing its operating profit to 0.0 billion yen.
| Item (Billions of yen) | FY27/3 Forecast | FY26/3 Results | Change |
|---|---|---|---|
| Net sales | 680.0 | 666.8 | +13.2 (2.0%) |
| Operating profit | 24.0 | 24.0 | ±0.0 (-0.1%) |
| Ordinary profit | 17.0 | 21.3 | -4.3 (-20.3%) |
| Profit attributable to owners of parent | 12.0 | 8.9 | +3.1 (35.0%) |
| Net interest-bearing debt (fiscal year-end) | 315.0 | 347.0 | -32.0 |
| Net D/E ratio (fiscal year-end) | 1.3 times | 1.5 times | -0.2 |
| Segment (Billions of yen) | FY27/3 Net sales (Full-year) | FY27/3 OP profit (Full-year) | FY27/3 OP profit (H1) | FY27/3 OP profit (H2) |
|---|---|---|---|---|
| P&P | 350.0 | 9.5 | 1.0 | 8.5 |
| H&PC | 315.0 | 13.5 | 3.0 | 10.5 |
| H&PC (Domestic) | 220.0 | 13.5 | 3.5 | 10.0 |
| H&PC (Overseas) | 95.0 | 0.0 | -0.5 | 0.5 |
| Others (incl. adjustments) | 15.0 | 1.0 | 0.5 | 0.5 |
| Total | 680.0 | 24.0 | 4.5 | 19.5 |
Shareholder Returns and Financial Indicators
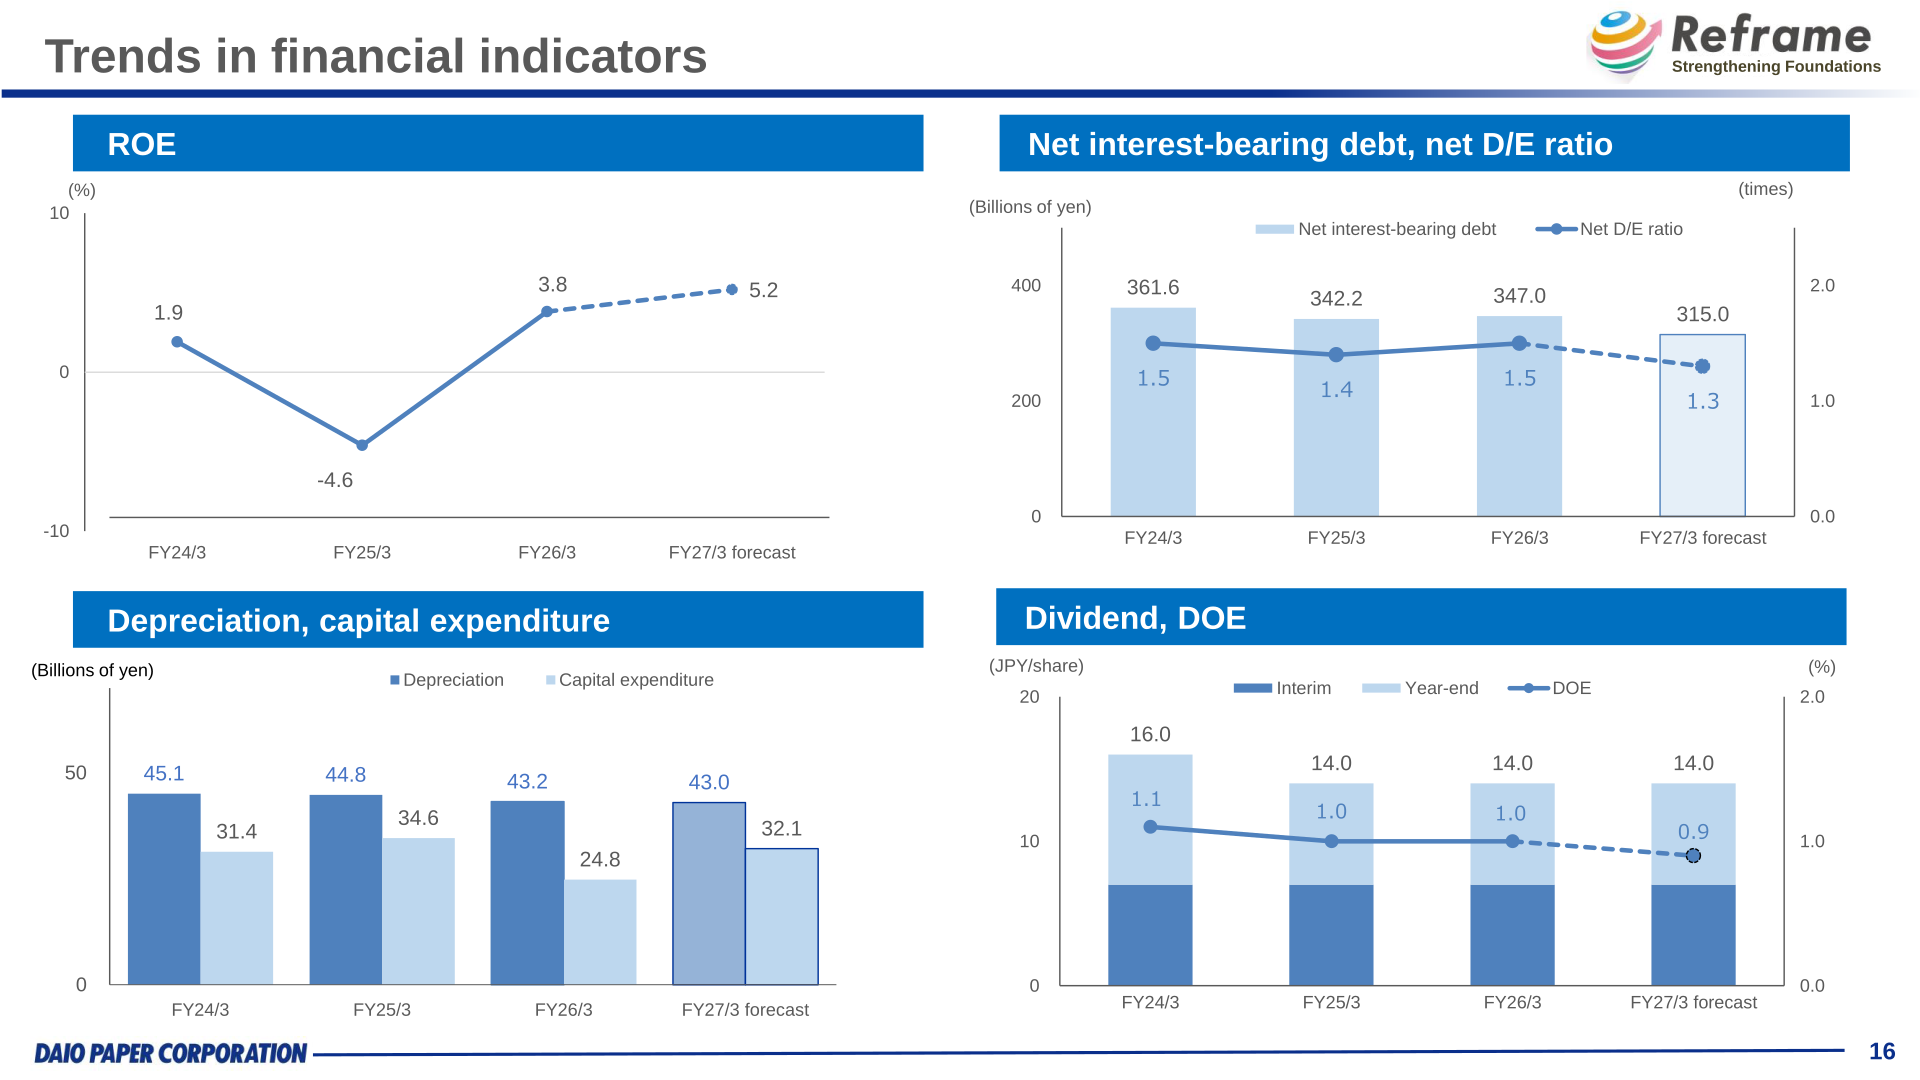
The financial indicators slide shows an annual dividend of 14.0 JPY per share for FY26/3 (FY25/3: 14.0 JPY; FY24/3: 16.0 JPY), with the same 14.0 JPY planned for FY27/3. DOE was 1.0% for FY26/3 and is forecast at 0.9% for FY27/3. ROE recovered to 3.8% in FY26/3 from -4.6% in FY25/3 and is forecast at 5.2% for FY27/3. Depreciation was 43.2 billion yen and capital expenditure 24.8 billion yen in FY26/3, with 43.0 billion yen and 32.1 billion yen planned, respectively, for FY27/3. The dividend policy itself cannot be confirmed from the materials.
| Item | FY24/3 | FY25/3 | FY26/3 | FY27/3 Forecast |
|---|---|---|---|---|
| Annual dividend (JPY/share) | 16.0 | 14.0 | 14.0 | 14.0 |
| DOE (%) | 1.1 | 1.0 | 1.0 | 0.9 |
| ROE (%) | 1.9 | -4.6 | 3.8 | 5.2 |
| Net interest-bearing debt (Billions of yen) | 361.6 | 342.2 | 347.0 | 315.0 |
| Depreciation (Billions of yen) | 45.1 | 44.8 | 43.2 | 43.0 |
| Capital expenditure (Billions of yen) | 31.4 | 34.6 | 24.8 | 32.1 |
This article is an analysis based on publicly available information and is not a recommendation to buy or sell any specific securities. Investment decisions are your own responsibility.
















