
This article is based on publicly available IR materials and is not a recommendation to buy or sell any specific securities.
Note: Hokuetsu Corporation’s fiscal year ends in March. Following this site’s convention, the fiscal year ended March 31, 2026 is classified as FY2025; the body text and tables below keep the company’s own labels (2026/3 = fiscal year ended March 2026; 2027/3 = fiscal year ending March 2027).
Hokuetsu Corporation reported 2026/3 net sales of 287,736 million yen (–5.9% year on year) and operating profit of 7,539 million yen (–61.8%). According to the company, net sales and operating profit declined due to the global softening of pulp market conditions, a decline in domestic demand for paper, and a weakening export market. Ordinary profit was 11,271 million yen (–39.9%) and net income attributable to owners of parent company was 7,299 million yen (–53.0%). For 2027/3, the company forecasts higher net sales of 305,000 million yen (+6.0%) but a further decline in operating profit to 3,000 million yen (–60.2%), and plans to keep the dividend at ¥26 per share.
Consolidated Results (2026/3 Actual)
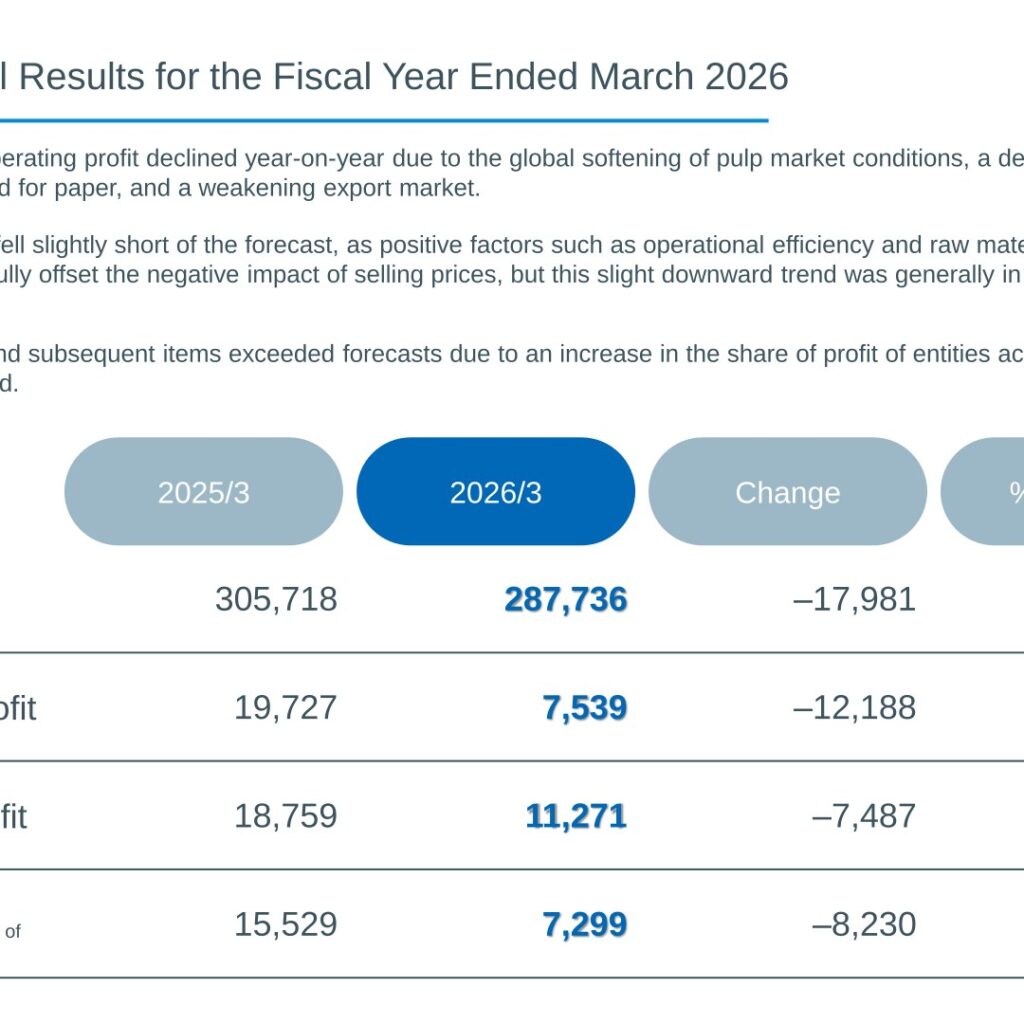
Net sales fell by 17,981 million yen to 287,736 million yen, and operating profit fell by 12,188 million yen to 7,539 million yen. The company stated that operating profit fell slightly short of the forecast, as positive factors such as operational efficiency and raw material and fuel costs could not fully offset the negative impact of selling prices, but that this slight downward trend was generally in line with expectations. Ordinary profit and subsequent items exceeded forecasts due to an increase in the share of profit of entities accounted for using the equity method.
| Item (Millions of yen) | 2025/3 | 2026/3 | Change | % Change |
|---|---|---|---|---|
| Net sales | 305,718 | 287,736 | –17,981 | –5.9% |
| Operating profit | 19,727 | 7,539 | –12,188 | –61.8% |
| Ordinary profit | 18,759 | 11,271 | –7,487 | –39.9% |
| Net income attributable to owners of parent company | 15,529 | 7,299 | –8,230 | –53.0% |
In the year-on-year operating profit bridge (from ¥19.7 billion to ¥7.5 billion, –¥12.2 billion), selling prices had an impact of –¥5.9 billion (paper –¥1.6 billion, paperboard +¥0.5 billion, pulp –¥4.8 billion), raw materials and fuel costs +¥1.8 billion (woodchips +¥1.3 billion, fuel +¥0.5 billion, pulp +¥0.3 billion, chemicals –¥0.1 billion, waste paper –¥0.1 billion), production and sales volume –¥3.2 billion, internal factors –¥3.4 billion, SG&A expenses –¥1.1 billion and other –¥0.4 billion. Assumptions moved from ¥153/$ to ¥151/$ for foreign exchange and from USD 79/bbl to USD 72/bbl for Dubai crude; depreciation was ¥13.8 billion (2025/3: ¥13.1 billion) and capital expenditure was ¥19.5 billion (2025/3: ¥19.4 billion).
On the balance sheet, total assets were ¥420.6 billion at the end of 2026/3 (+1.7 versus ¥418.9 billion). Investments and other assets decreased by 14.7 to ¥99.5 billion, including a decrease of 14.0 due to the sale of Daio Paper shares. Interest-bearing debt increased by 8.4 to ¥97.4 billion (bonds payable +15.0, short-term borrowings –7.2), and total net assets decreased by 13.1 to ¥252.7 billion, reflecting the acquisition of treasury shares (–11.0) (unit: billions of yen). ROE was 2.8% (2025/3: 6.0%) and the net D/E ratio was 0.27 times (2025/3: 0.23 times).
Segment Results
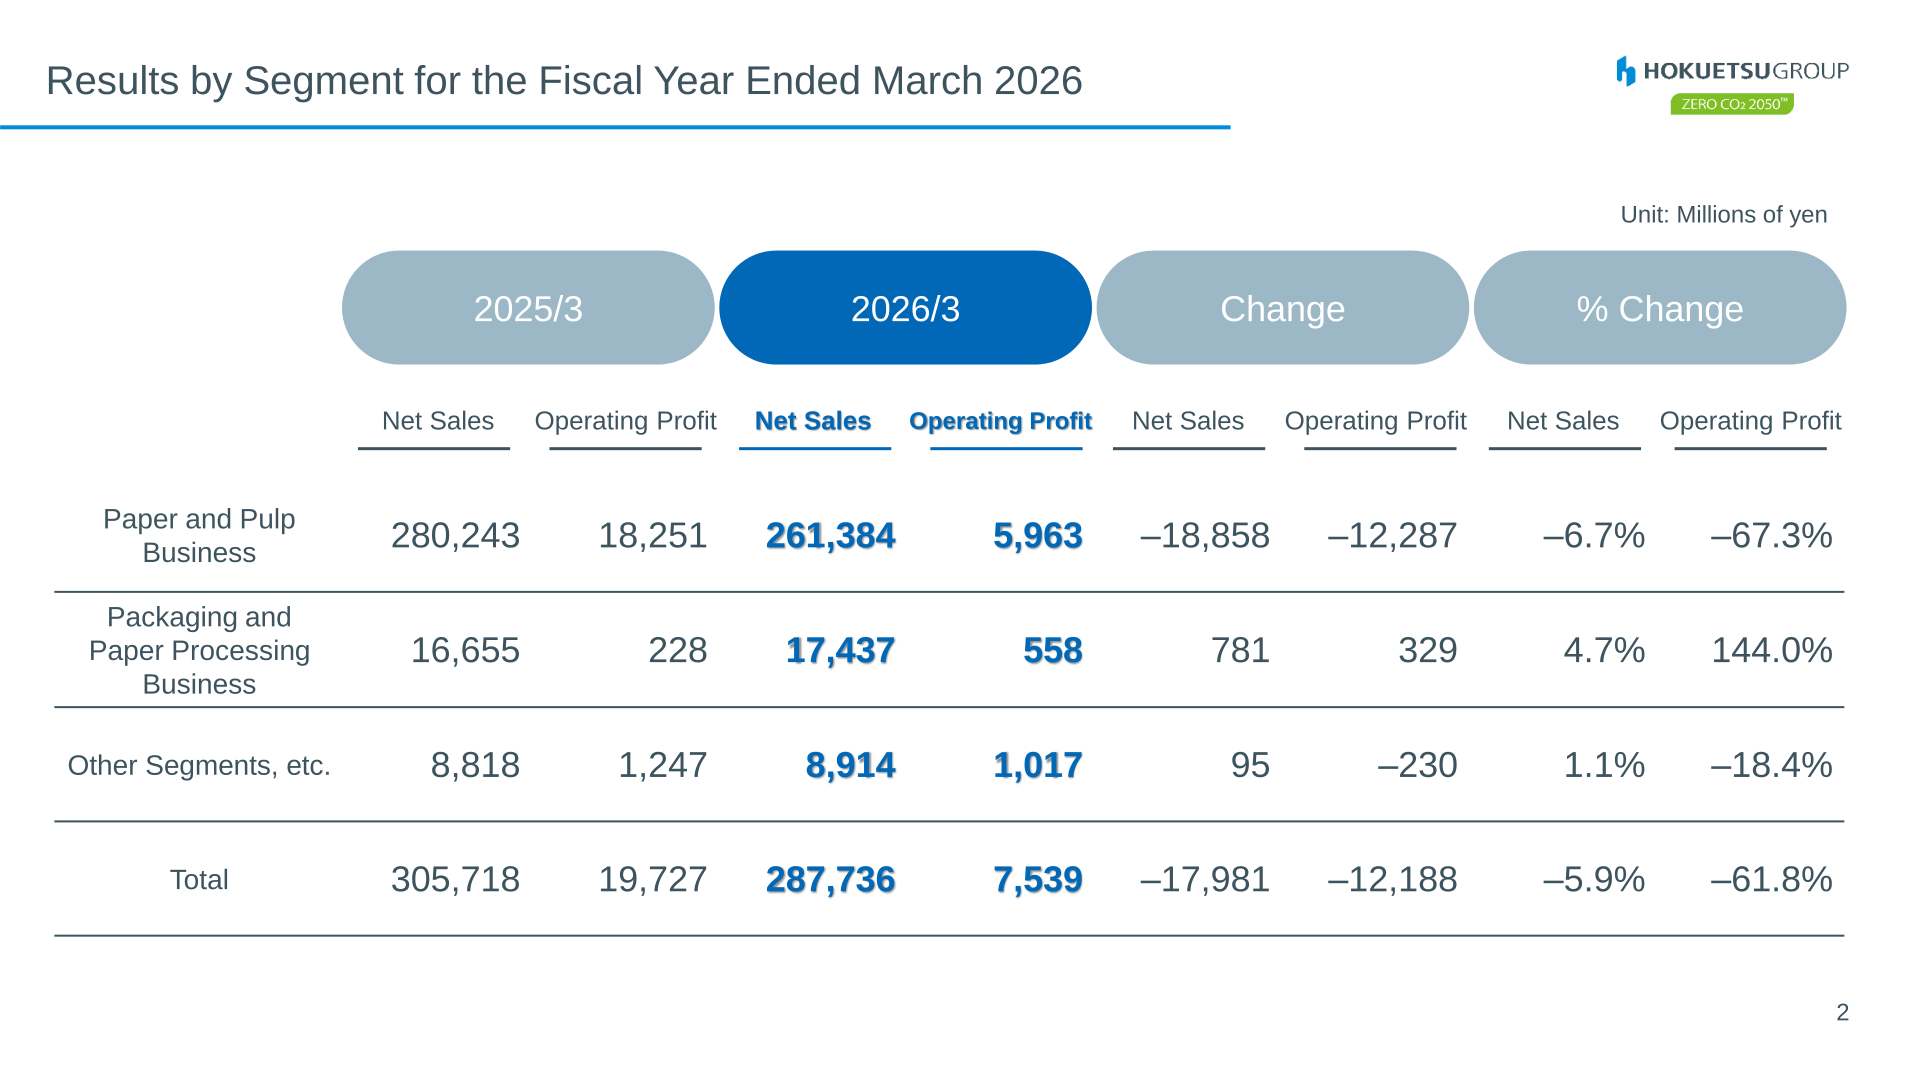
In the Paper and Pulp Business, net sales were 261,384 million yen (–6.7%) and operating profit was 5,963 million yen (–67.3%). The Packaging and Paper Processing Business increased net sales to 17,437 million yen (+4.7%) and operating profit to 558 million yen (+144.0%). Other Segments, etc. recorded net sales of 8,914 million yen (+1.1%) and operating profit of 1,017 million yen (–18.4%).
| Segment (Millions of yen) | Metric | 2025/3 | 2026/3 | Change | % Change |
|---|---|---|---|---|---|
| Paper and Pulp Business | Net sales | 280,243 | 261,384 | –18,858 | –6.7% |
| Paper and Pulp Business | Operating profit | 18,251 | 5,963 | –12,287 | –67.3% |
| Packaging and Paper Processing Business | Net sales | 16,655 | 17,437 | 781 | 4.7% |
| Packaging and Paper Processing Business | Operating profit | 228 | 558 | 329 | 144.0% |
| Other Segments, etc. | Net sales | 8,818 | 8,914 | 95 | 1.1% |
| Other Segments, etc. | Operating profit | 1,247 | 1,017 | –230 | –18.4% |
| Total | Net sales | 305,718 | 287,736 | –17,981 | –5.9% |
| Total | Operating profit | 19,727 | 7,539 | –12,188 | –61.8% |
By product, paper sales volume was 1,007 thousand tons (–3.3%) at an average unit price of ¥137.8/kg, for an amount of ¥138.8 billion (–4.1%). Paperboard volume was 368 thousand tons (–0.4%) at ¥114.8/kg, for ¥42.3 billion (+0.9%). Pulp volume was 623 thousand tons (–8.2%), with the average unit price falling from ¥102.2/kg to ¥92.3/kg and the amount declining to ¥57.5 billion (–17.1%). Performance Materials sales were ¥16.4 billion (+2.9%) and Packaging and Paper Processing Business sales were ¥17.4 billion (+4.7%).
2027/3 Forecast
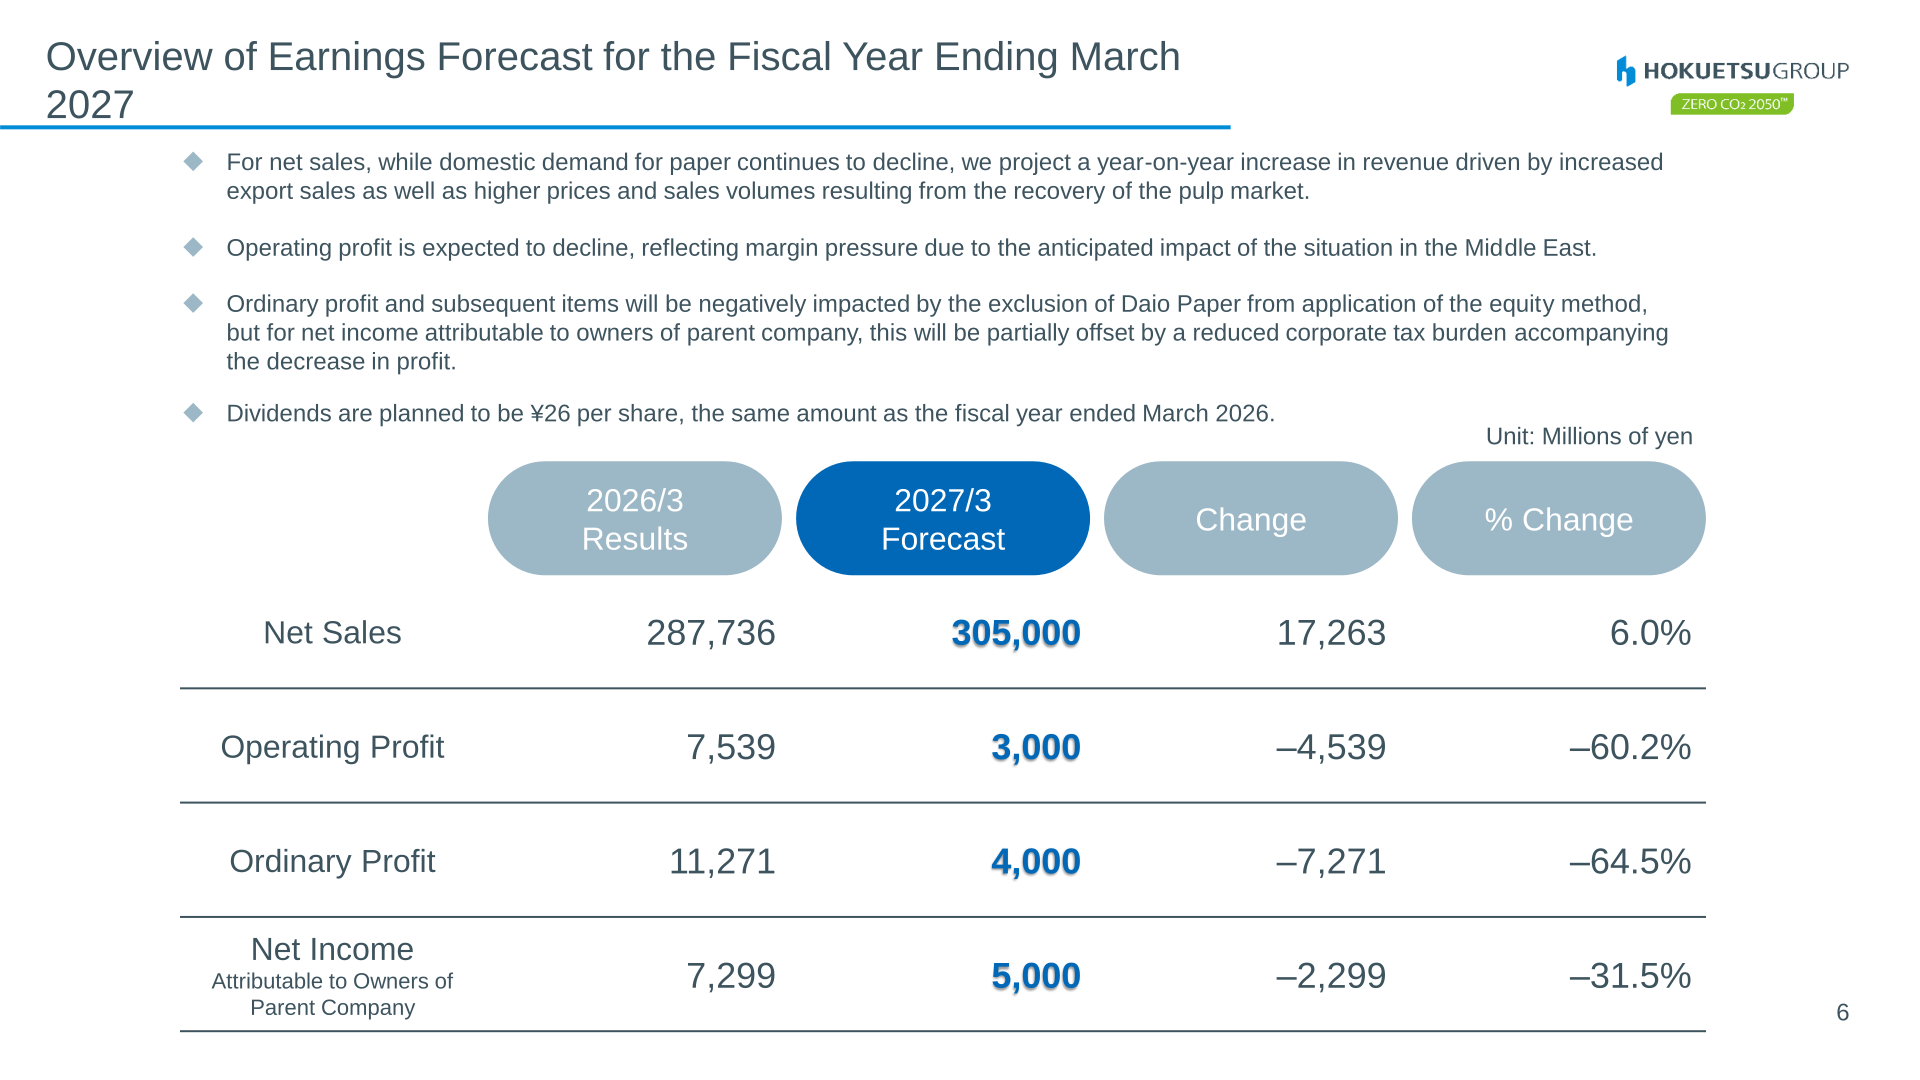
For net sales, while domestic demand for paper continues to decline, the company projects a year-on-year increase in revenue driven by increased export sales as well as higher prices and sales volumes resulting from the recovery of the pulp market. Operating profit is expected to decline, reflecting margin pressure due to the anticipated impact of the situation in the Middle East. Ordinary profit and subsequent items will be negatively impacted by the exclusion of Daio Paper from application of the equity method, but for net income attributable to owners of parent company this will be partially offset by a reduced corporate tax burden accompanying the decrease in profit.
| Item (Millions of yen) | 2026/3 Results | 2027/3 Forecast | Change | % Change |
|---|---|---|---|---|
| Net sales | 287,736 | 305,000 | 17,263 | 6.0% |
| Operating profit | 7,539 | 3,000 | –4,539 | –60.2% |
| Ordinary profit | 11,271 | 4,000 | –7,271 | –64.5% |
| Net income attributable to owners of parent company | 7,299 | 5,000 | –2,299 | –31.5% |
By segment, the Paper and Pulp Business is forecast at net sales of 278,000 million yen (+6.4%) and operating profit of 2,100 million yen (–64.8%), the Packaging and Paper Processing Business at 18,000 million yen (+3.2%) and 100 million yen (–82.1%), and Other Segments, etc. at 9,000 million yen (+1.0%) and 800 million yen (–21.4%). In the operating profit bridge (¥7.5 billion to ¥3.0 billion, –¥4.5 billion), selling prices are expected to contribute +¥6.8 billion, production and sales volume +¥2.1 billion, SG&A expenses +¥0.6 billion and other +¥1.6 billion, while raw materials and fuel costs weigh by –¥15.3 billion (woodchips –¥7.7 billion, fuel –¥4.5 billion, chemicals –¥2.7 billion) and internal factors by –¥0.3 billion. The plan assumes ¥160/$ and Dubai crude at USD 90/bbl, with depreciation of ¥15.0 billion and capital expenditure of ¥23.0 billion.
Shareholder Returns
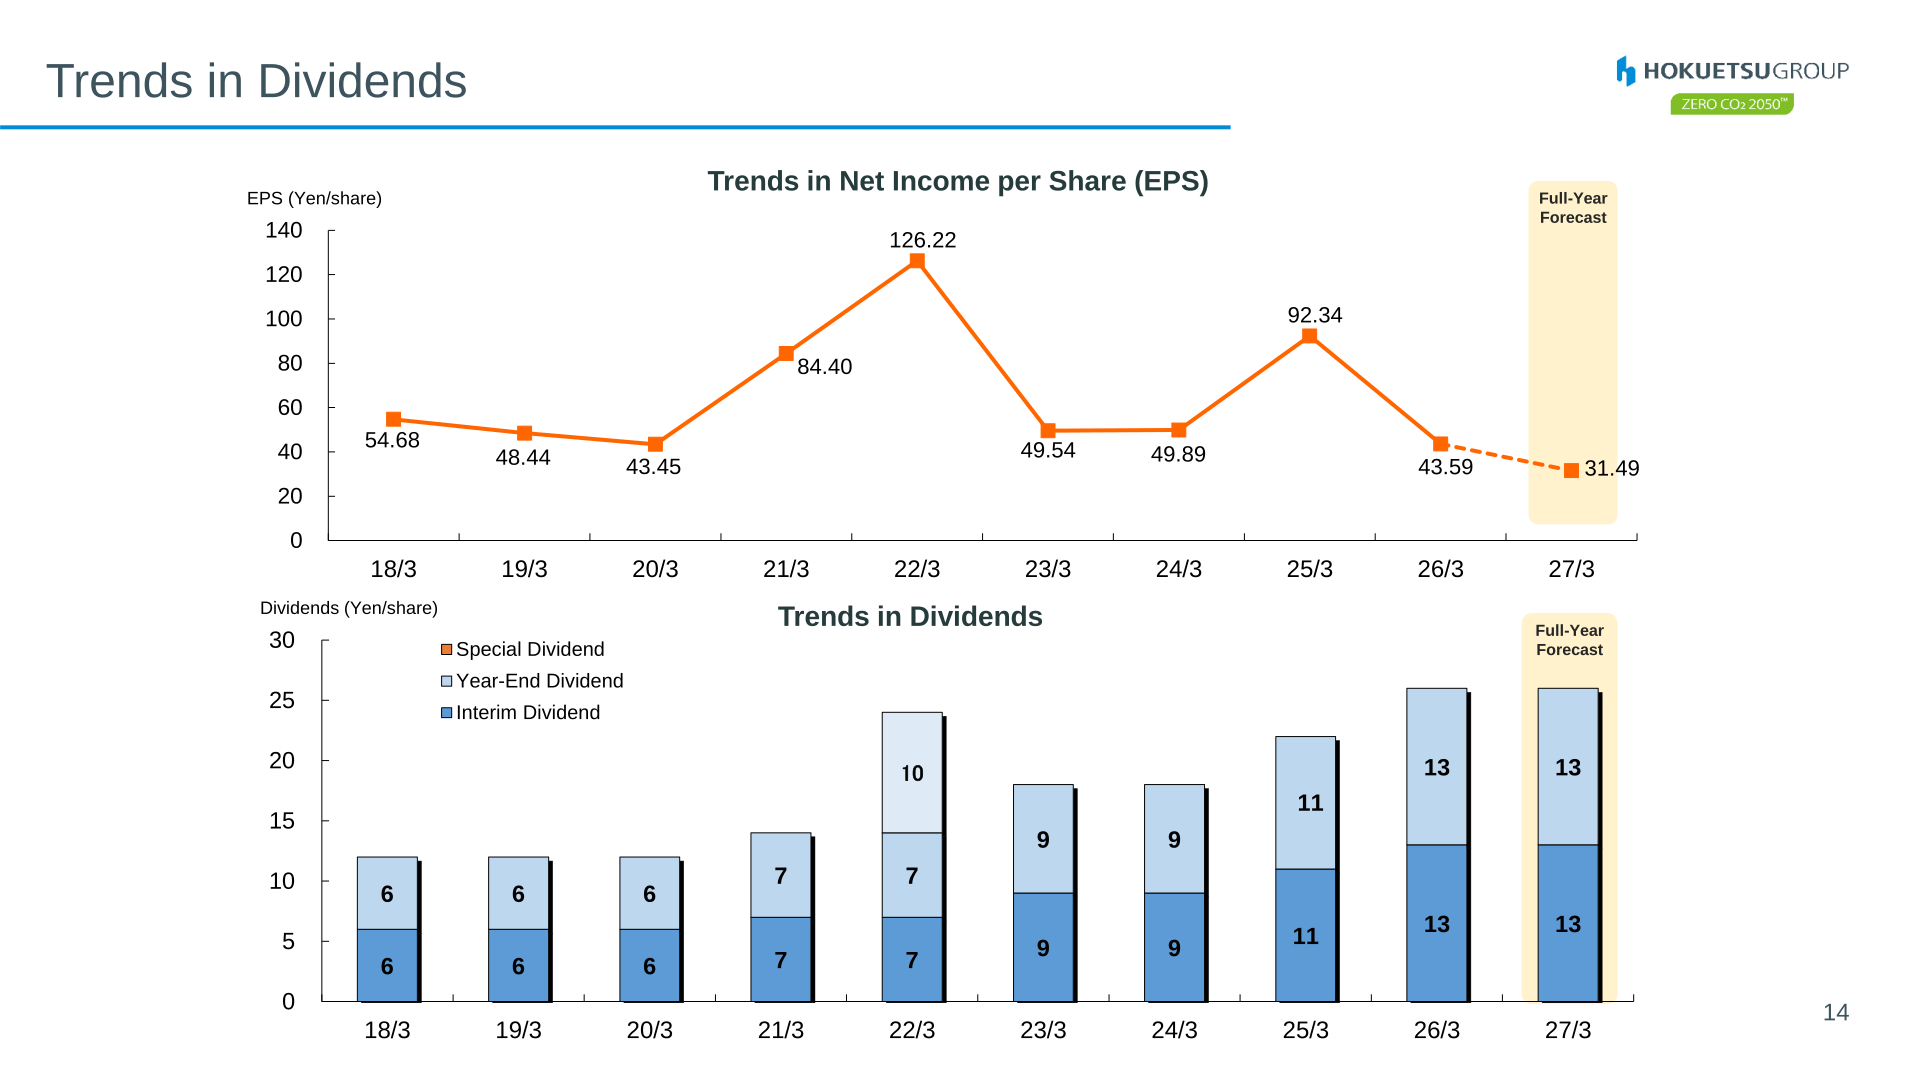
The dividend for 2026/3 was ¥26 per share (interim ¥13 and year-end ¥13), up from interim ¥11 and year-end ¥11 in 2025/3. For 2027/3, dividends are planned to be ¥26 per share, the same amount as the fiscal year ended March 2026. EPS was 43.59 yen in 2026/3 (2025/3: 92.34 yen) and is forecast at 31.49 yen for 2027/3. During 2026/3, total net assets were reduced by the acquisition of treasury shares (–¥11.0 billion).
| Item (Yen per share) | 2025/3 | 2026/3 | 2027/3 Forecast |
|---|---|---|---|
| Interim dividend | 11 | 13 | 13 |
| Year-end dividend | 11 | 13 | 13 |
| Annual dividend | — | 26 | 26 |
| EPS | 92.34 | 43.59 | 31.49 |
Topics: Strategic Business Alliance with Daio Paper
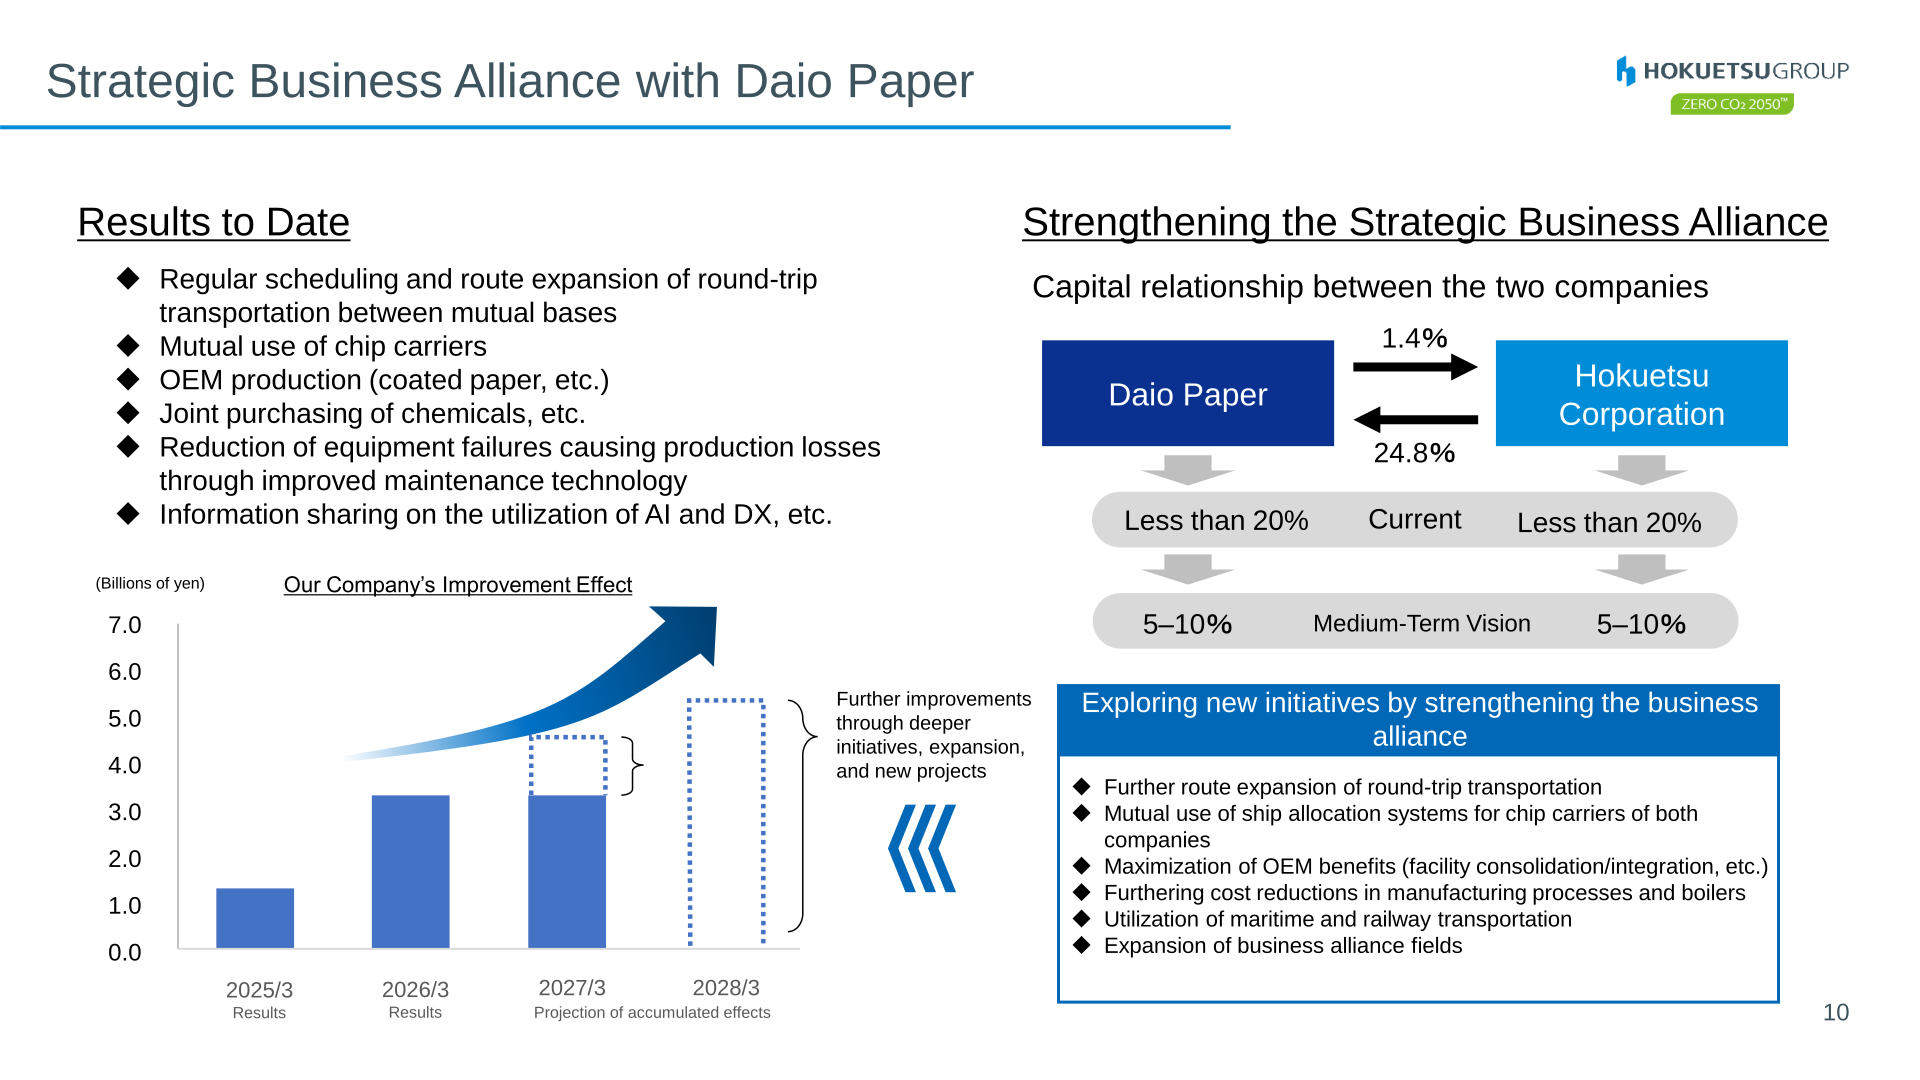
The company reported results to date of its strategic business alliance with Daio Paper, including regular scheduling and route expansion of round-trip transportation between mutual bases, mutual use of chip carriers, OEM production (coated paper, etc.), joint purchasing of chemicals, reduction of equipment failures through improved maintenance technology, and information sharing on the utilization of AI and DX. The slide on the capital relationship between the two companies shows figures of 1.4% and 24.8%, ‘Less than 20%’ for each company under ‘Current’, and 5–10% for each under the Medium-Term Vision. To strengthen the alliance, the company is exploring further route expansion of round-trip transportation, mutual use of ship allocation systems for chip carriers, maximization of OEM benefits (facility consolidation/integration, etc.), further cost reductions in manufacturing processes and boilers, utilization of maritime and railway transportation, and expansion of business alliance fields.
Capital expenditure in 2026/3 totaled ¥19.5 billion (maintenance and renewal investment ¥14.5 billion, growth and improvement investment ¥5.0 billion), and the 2027/3 plan totals ¥23.0 billion (maintenance and renewal investment ¥15.0 billion, growth and improvement investment ¥8.0 billion). The overseas sales ratio was 34% in 2026/3.
This article is an analysis based on publicly available information and is not a recommendation to buy or sell any specific securities. Investment decisions are your own responsibility.
















