
This article is based on publicly available IR materials and is not a recommendation to buy or sell any specific securities.
San-in Godo Bank (8381) reported record-high results for FY2025 (fiscal year ended March 31, 2026), marking the fifth consecutive year of record profit. Consolidated ordinary income increased 23.4% year on year to 167.0 billion yen, ordinary profit rose 21.0% to 32.3 billion yen, and profit attributable to owners of parent rose 21.1% to 22.6 billion yen. During the year the Bank raised its FY2025 net income forecast from 21.0 billion yen to 22.5 billion yen, and actual net income of 22.6 billion yen exceeded even the revised target. For FY2026, the final year of the current Medium-Term Management Plan, the Bank forecasts a sixth consecutive year of record profit, with profit attributable to owners of parent projected at 25.5 billion yen, an upward revision from a prior plan of 23.5 billion yen.
Consolidated Results (Full-Year Actual)
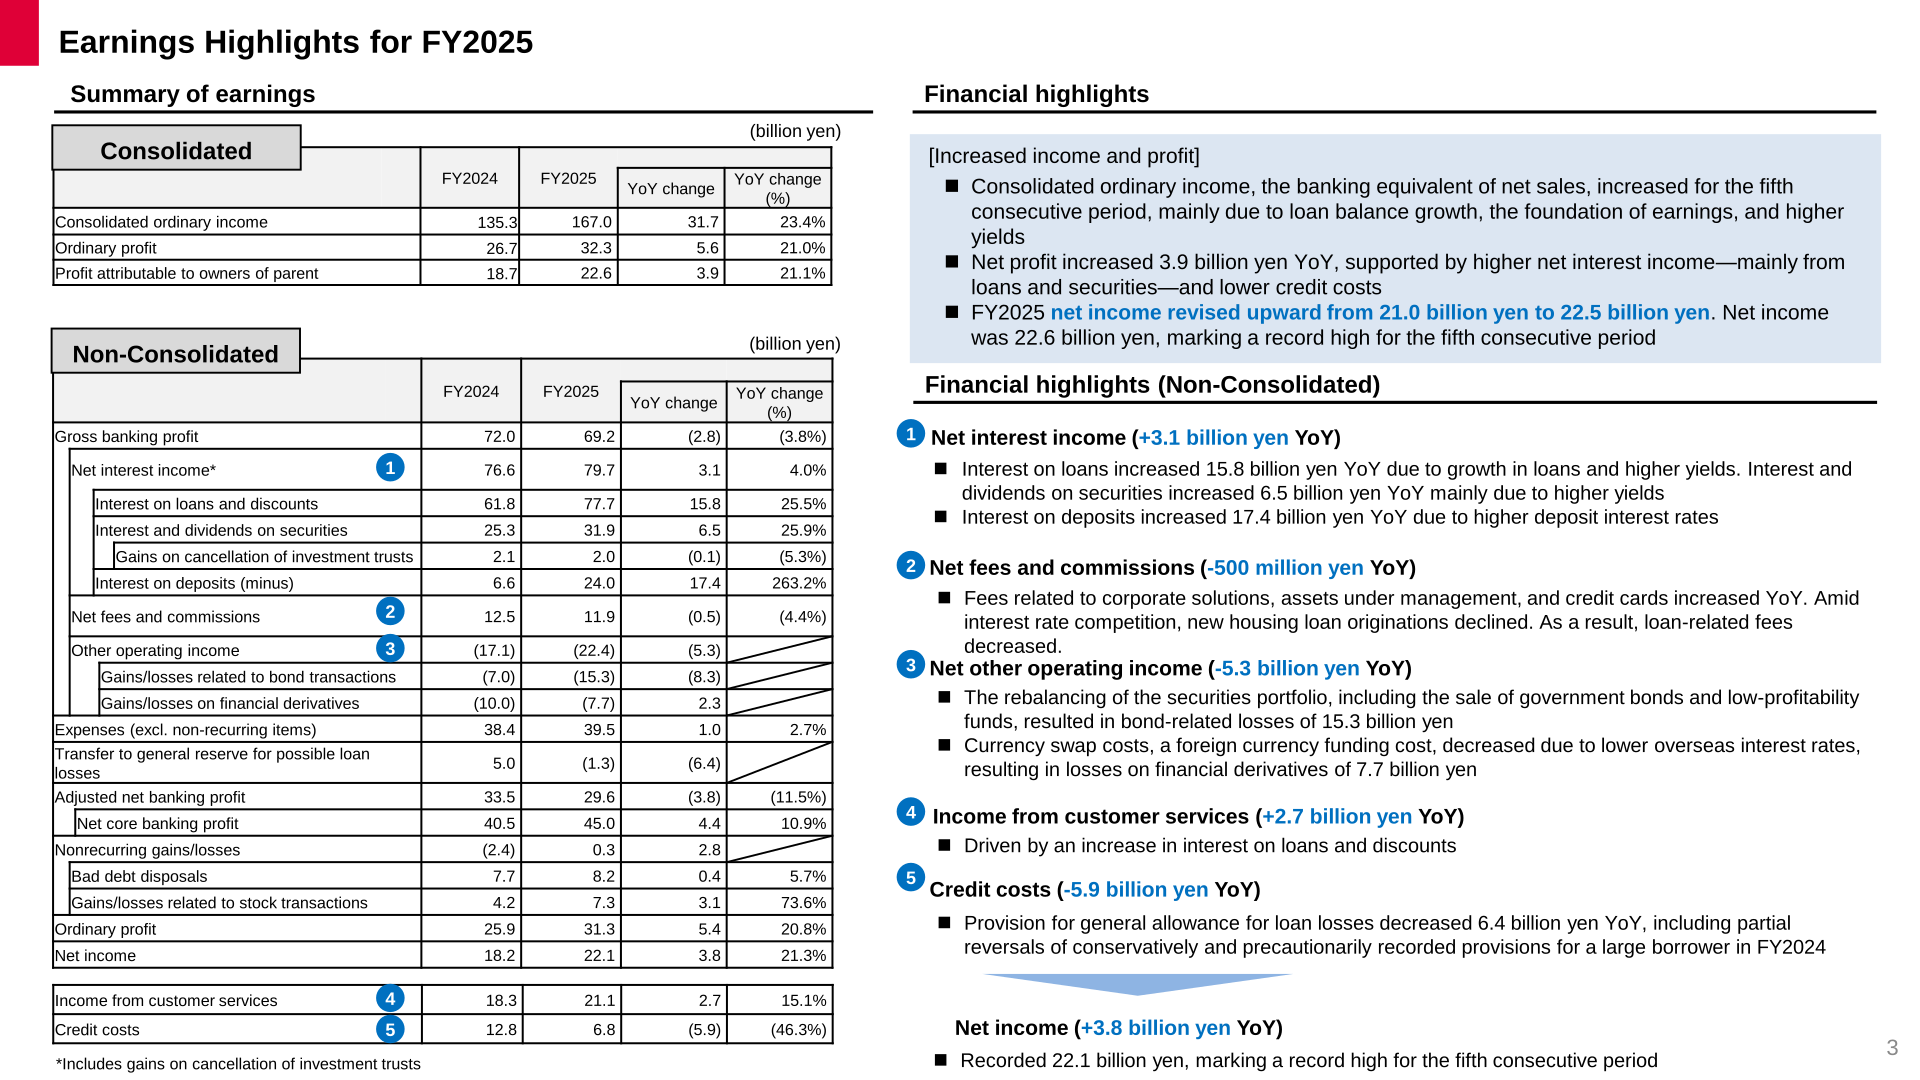
Consolidated ordinary income increased for the fifth consecutive period, mainly due to loan balance growth and higher yields. Net profit increased 3.9 billion yen year on year, supported by higher net interest income — mainly from loans and securities — and lower credit costs.
| Item | FY2025 | FY2024 | YoY Change | YoY Change (%) |
|---|---|---|---|---|
| Consolidated ordinary income | 167.0 | 135.3 | 31.7 | 23.4% |
| Ordinary profit | 32.3 | 26.7 | 5.6 | 21.0% |
| Profit attributable to owners of parent | 22.6 | 18.7 | 3.9 | 21.1% |
Non-Consolidated Financial Highlights
On a non-consolidated basis, net interest income increased 3.1 billion yen year on year to 79.7 billion yen: interest on loans and discounts rose 15.8 billion yen to 77.7 billion yen on loan balance growth and higher yields, and interest and dividends on securities rose 6.5 billion yen to 31.9 billion yen, mainly due to higher yields. Interest on deposits (a deduction) rose 17.4 billion yen to 24.0 billion yen due to higher deposit interest rates. Net fees and commissions decreased 500 million yen to 11.9 billion yen, as loan-related fees declined amid intensifying competition in housing loan interest rates, even as corporate solutions, assets-under-management, and credit-card-related fees increased. Net other operating income decreased 5.3 billion yen, reflecting bond-related losses of 15.3 billion yen from the rebalancing of the securities portfolio — including the sale of government bonds and low-profitability funds — and losses on financial derivatives of 7.7 billion yen as lower overseas interest rates reduced currency swap costs. Credit costs decreased 5.9 billion yen to 6.8 billion yen, including partial reversals of conservatively and precautionarily recorded provisions for a large borrower in FY2024. Non-consolidated net income of 22.1 billion yen marked a record high for the fifth consecutive period. OHR (on a gross core banking profit basis) improved to 46.76% in FY2025 from 48.67% in FY2024, remaining well below the average for regional banks (57.82% for FY2024, per the Regional Banks Association of Japan). The consolidated capital adequacy ratio was 11.85% at End-Mar. 2026, versus 11.54% at End-Mar. 2025, and the NPL ratio (Financial Reconstruction Act basis) was 1.47% at End-Mar. 2026, versus 1.25% at End-Mar. 2025.
| Item | FY2025 | FY2024 | YoY Change | YoY Change (%) |
|---|---|---|---|---|
| Gross banking profit | 69.2 | 72.0 | (2.8) | (3.8%) |
| Net interest income | 79.7 | 76.6 | 3.1 | 4.0% |
| Interest on loans and discounts | 77.7 | 61.8 | 15.8 | 25.5% |
| Interest and dividends on securities | 31.9 | 25.3 | 6.5 | 25.9% |
| Net fees and commissions | 11.9 | 12.5 | (0.5) | (4.4%) |
| Expenses (excl. non-recurring items) | 39.5 | 38.4 | 1.0 | 2.7% |
| Net core banking profit | 45.0 | 40.5 | 4.4 | 10.9% |
| Ordinary profit | 31.3 | 25.9 | 5.4 | 20.8% |
| Net income | 22.1 | 18.2 | 3.8 | 21.3% |
| Income from customer services | 21.1 | 18.3 | 2.7 | 15.1% |
| Credit costs | 6.8 | 12.8 | (5.9) | (46.3%) |
| OHR (gross core banking profit basis) | 46.76% | 48.67% | – | – |
| Capital adequacy ratio (Consolidated, End-Mar.) | 11.85% | 11.54% | – | – |
| NPL ratio (Financial Reconstruction Act basis, End-Mar.) | 1.47% | 1.25% | – | – |
Loan and Deposit Growth by Region (Non-Consolidated)
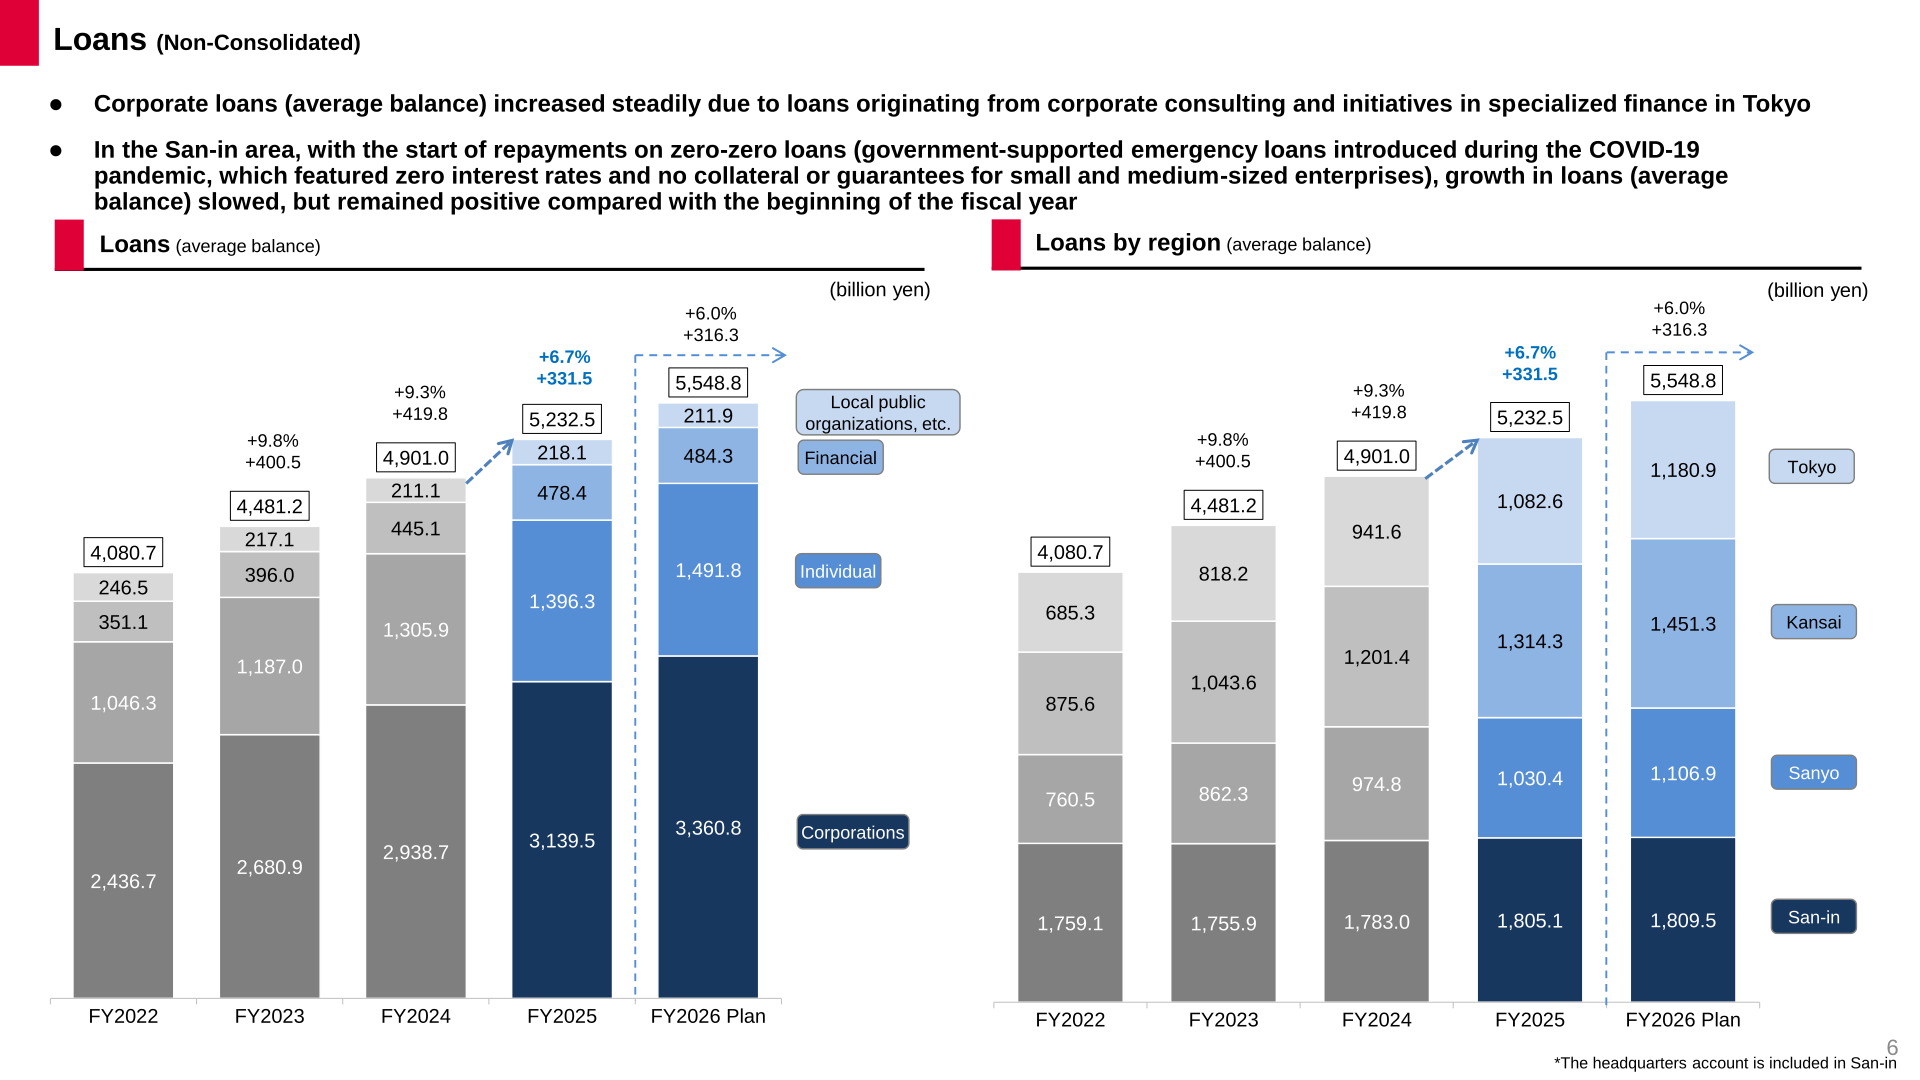
Loans (average balance) increased in all four regions in which the Bank operates. Total loans (average balance) rose 6.7%, or 331.5 billion yen, to 5,232.5 billion yen. In the San-in region, growth slowed as borrowers began repayments on zero-zero loans (government-supported, zero-interest, unsecured/unguaranteed loans introduced during the COVID-19 pandemic for small and medium-sized enterprises), though the loan balance remained above the level at the start of the fiscal year. Corporate loans continued to grow steadily, supported by loans originating from corporate consulting and initiatives in specialized finance in Tokyo. Total deposits, etc. (average balance, including NCDs) rose 4.1%, or 267.0 billion yen, to 6,740.3 billion yen, mainly on growth in corporate deposits, while growth in individual deposits remained modest.
| Region | FY2025 (Avg. Balance) | FY2024 (Avg. Balance) |
|---|---|---|
| San-in | 1,805.1 | 1,783.0 |
| Sanyo | 1,030.4 | 974.8 |
| Kansai | 1,314.3 | 1,201.4 |
| Tokyo | 1,082.6 | 941.6 |
| Total loans (non-consolidated) | 5,232.5 | 4,901.0 |
FY2026 Forecast
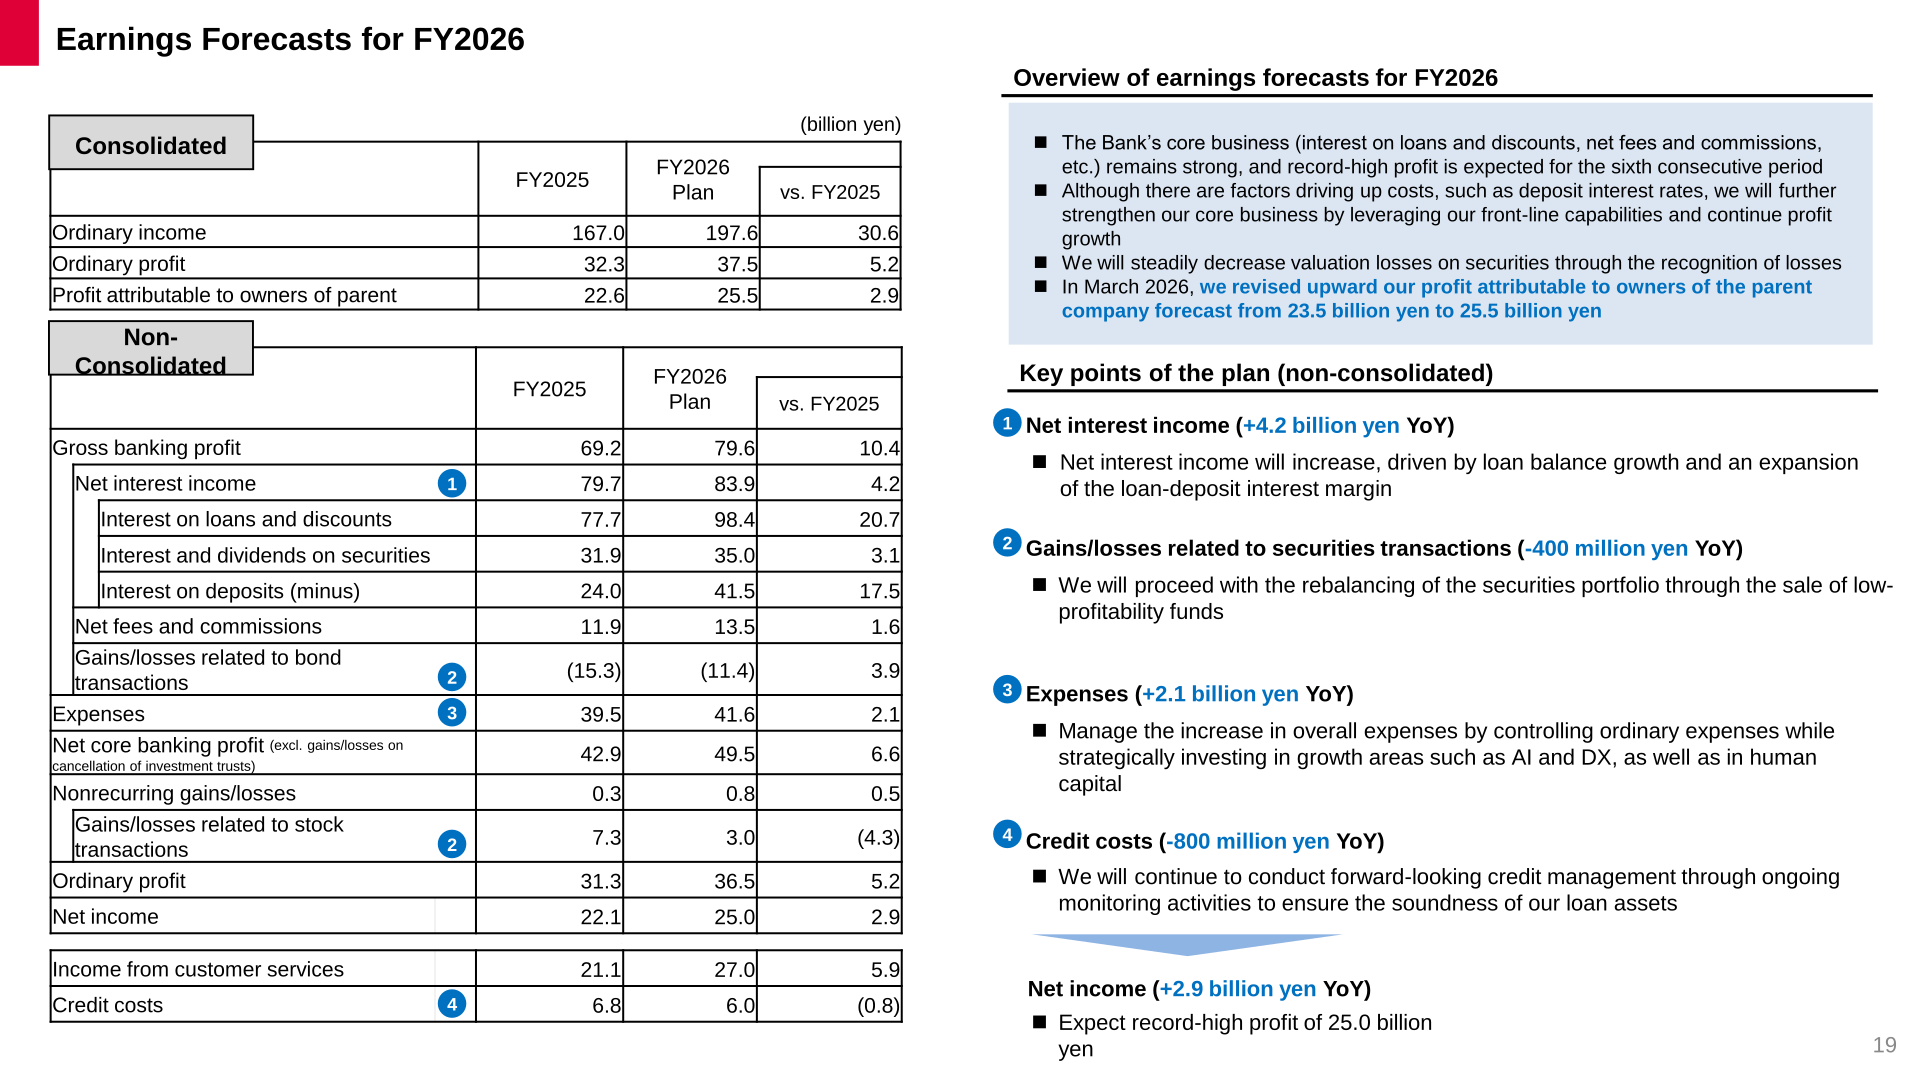
For FY2026, the Bank expects its core business — interest on loans and discounts and net fees and commissions — to remain strong, with record-high profit expected for a sixth consecutive period. On a non-consolidated basis, net interest income is expected to increase 4.2 billion yen year on year to 83.9 billion yen, driven by loan balance growth and an expanding loan-deposit interest margin; interest on loans and discounts is forecast at 98.4 billion yen (+20.7 billion yen). Credit costs are expected to decrease 800 million yen to 6.0 billion yen as the Bank continues forward-looking credit management. Expenses are expected to increase 2.1 billion yen to 41.6 billion yen, reflecting strategic investment in AI, DX, and human capital alongside cost control. Non-consolidated net income is forecast at 25.0 billion yen (+2.9 billion yen), a record high. The FY2026 forecast was prepared solely on the assumption that the Bank of Japan’s policy rate will be raised to 1.00% in June 2026.
| Item | FY2026 Plan | FY2025 (Actual) | Change |
|---|---|---|---|
| Ordinary income | 197.6 | 167.0 | 30.6 |
| Ordinary profit | 37.5 | 32.3 | 5.2 |
| Profit attributable to owners of parent | 25.5 | 22.6 | 2.9 |
Shareholder Returns
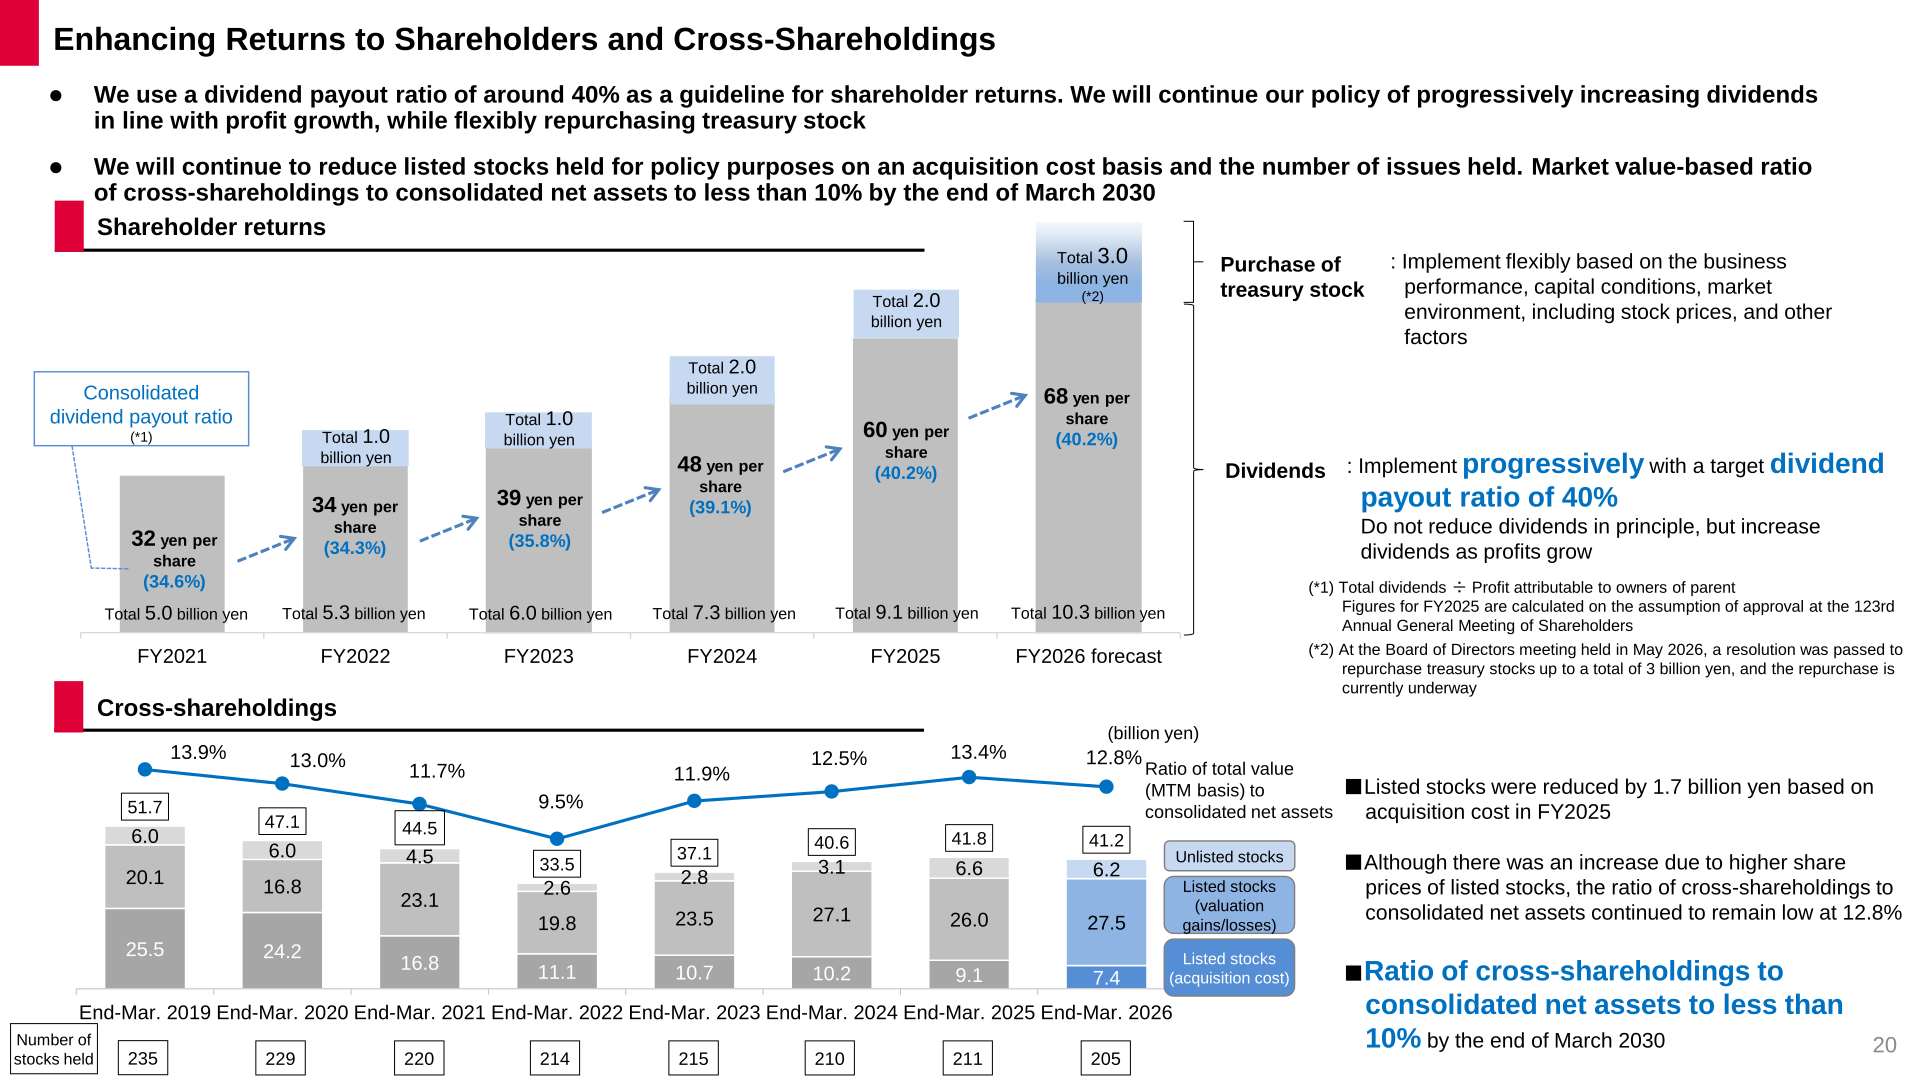
The Bank uses a target consolidated dividend payout ratio of around 40% as its guideline for shareholder returns and intends to continue progressively increasing dividends in line with profit growth, without reducing dividends in principle. The FY2025 dividend was 60 yen per share (payout ratio 40.2%; total dividends of 9.1 billion yen), and the Bank forecasts a FY2026 dividend of 68 yen per share (payout ratio 40.2%; total dividends of 10.3 billion yen). In May 2026, the Board of Directors resolved to repurchase treasury stock for up to a total of 3.0 billion yen, and the repurchase is currently underway. The Bank also aims to reduce the market-value-based ratio of cross-shareholdings to consolidated net assets to less than 10% by the end of March 2030; the ratio stood at 12.8% at End-Mar. 2026 (205 stocks held), versus 13.4% a year earlier.
| Fiscal Year | Dividend per Share | Payout Ratio | Total Dividends |
|---|---|---|---|
| FY2021 | 32 yen | 34.6% | 5.0 billion yen |
| FY2022 | 34 yen | 34.3% | 5.3 billion yen |
| FY2023 | 39 yen | 35.8% | 6.0 billion yen |
| FY2024 | 48 yen | 39.1% | 7.3 billion yen |
| FY2025 | 60 yen | 40.2% | 9.1 billion yen |
| FY2026 Plan | 68 yen | 40.2% | 10.3 billion yen |
Medium-Term Management Plan and ROE Target
Under its current Medium-Term Management Plan (April 2024 – March 2027), the Bank targets a capital adequacy ratio of approximately 11%, ROE (shareholders’ equity basis) of 6% or more, and net income of 23.5 billion yen in the plan’s final year, FY2026; the net income target was revised upward to 25.5 billion yen in March 2026. FY2025 results were 11.85% (capital adequacy ratio), 5.9% (ROE, shareholders’ equity basis) and 22.6 billion yen (net income), and the Bank’s self-assessment rated progress on all three financial indicators as ‘As planned.’ In October 2025, the Board of Directors set the Bank’s cost of capital at 7%. ROE (shareholders’ equity basis) rose from 4.70% in FY2023 to 5.10% in FY2024 and 5.99% in FY2025; ROE (equity capital basis, TSE standard) rose from 5.27% to 5.88% and 7.16% over the same period. The Bank states it will reliably achieve ROE exceeding the cost of capital and targets a PBR above 1.0, with a longer-term ROE goal of 8% or more.
| Metric | FY2023 | FY2024 | FY2025 |
|---|---|---|---|
| ROE (Shareholders’ equity basis) | 4.70% | 5.10% | 5.99% |
| ROE (Equity capital basis, TSE standard) | 5.27% | 5.88% | 7.16% |
This article is an analysis based on publicly available information and is not a recommendation to buy or sell any specific securities. Investment decisions are your own responsibility.
















