
This article is based on publicly available IR materials and is not a recommendation to buy or sell any specific securities.
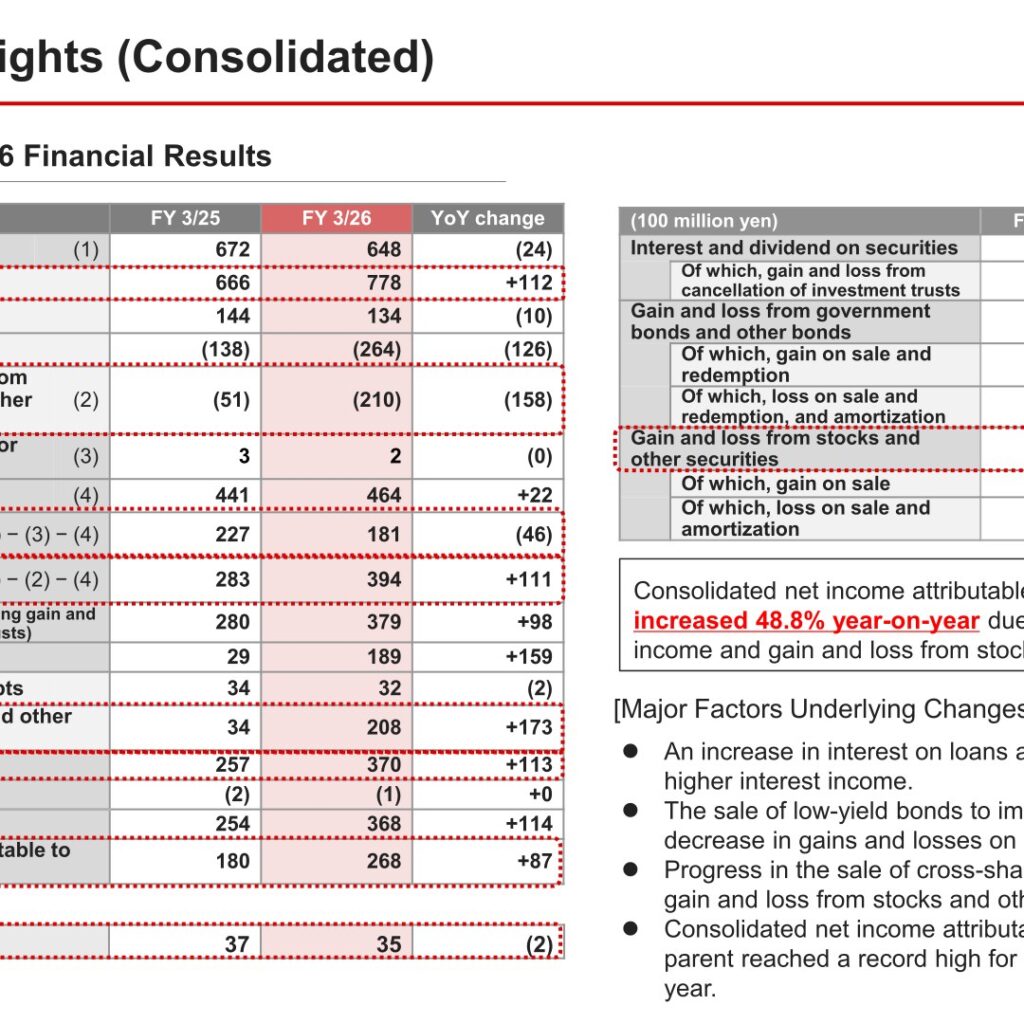
The Hyakugo Bank, Ltd. presented its “Presentation for FY2025 Financial Results” at an information meeting on June 2, 2026, covering the fiscal year ended March 31, 2026 (labeled FY 3/26 in the Bank’s tables). Consolidated net income attributable to shareholders of the parent increased 48.8% year-on-year due to an increase in interest income and gain and loss from stocks and other securities, reaching a record high for the second consecutive fiscal year. For FY 3/2027, the Bank expects record-high profit for the third consecutive fiscal year on both a consolidated and non-consolidated basis, and plans to raise the annual dividend by 8 yen per share, marking the seventh consecutive year of dividend increases.
Consolidated Results (Full-Year Actual)
Major factors underlying the change in results, as stated in the presentation: an increase in interest on loans and securities contributed to higher interest income; the sale of low-yield bonds to improve the portfolio led to a decrease in gains and losses on government and other bonds; and progress in the sale of cross-shareholdings contributed to higher gain and loss from stocks and other securities.
| Item (100 million yen) | FY 3/26 | FY 3/25 | YoY Change |
|---|---|---|---|
| Gross operating income | 648 | 672 | (24) |
| Interest income | 778 | 666 | +112 |
| Fees and commissions | 134 | 144 | (10) |
| Other operating income | (264) | (138) | (126) |
| Provision of general allowance for loan losses | 2 | 3 | (0) |
| Expenses | 464 | 441 | +22 |
| Net operating income | 181 | 227 | (46) |
| Core net operating income | 394 | 283 | +111 |
| Core net operating income (excluding gain and loss from cancellation of investment trusts) | 379 | 280 | +98 |
| Non-recurring gain and loss | 189 | 29 | +159 |
| Gain and loss from stocks and other securities | 208 | 34 | +173 |
| Ordinary income | 370 | 257 | +113 |
| Extraordinary gain and loss | (1) | (2) | +0 |
| Net income before income taxes | 368 | 254 | +114 |
| Consolidated net income attributable to shareholders of the parent | 268 | 180 | +87 |
| Credit costs | 35 | 37 | (2) |
Loans and Deposits (Non-Consolidated)
Deposits, etc. (including NCDs, average balance) increased 1.7% year-on-year due to an increase in corporate deposits, while total loans (average balance) increased 2.5% year-on-year due to growth in housing loans in Aichi Prefecture.
| Item (100 million yen, average balance) | FY 3/26 | FY 3/25 | YoY Change |
|---|---|---|---|
| Individual deposits | 43,980 | 43,939 | +41 |
| Individual deposits – Mie | 40,259 | 40,230 | +29 |
| Individual deposits – Aichi | 3,685 | 3,674 | +10 |
| Individual deposits – Tokyo, Osaka | 35 | 34 | +1 |
| Corporate deposits | 14,733 | 13,733 | +999 |
| Corporate deposits – Mie | 11,060 | 10,719 | +341 |
| Corporate deposits – Aichi | 2,974 | 2,511 | +462 |
| Corporate deposits – Tokyo, Osaka | 699 | 503 | +195 |
| Corporate loans | 24,562 | 24,550 | +11 |
| Loans for large companies | 7,878 | 8,039 | (160) |
| Loans to medium-sized companies and SMEs | 16,683 | 16,510 | +172 |
| Loans to individuals | 25,209 | 23,831 | +1,377 |
| Public sector loans | 1,392 | 1,521 | (129) |
FY 3/2027 Forecast
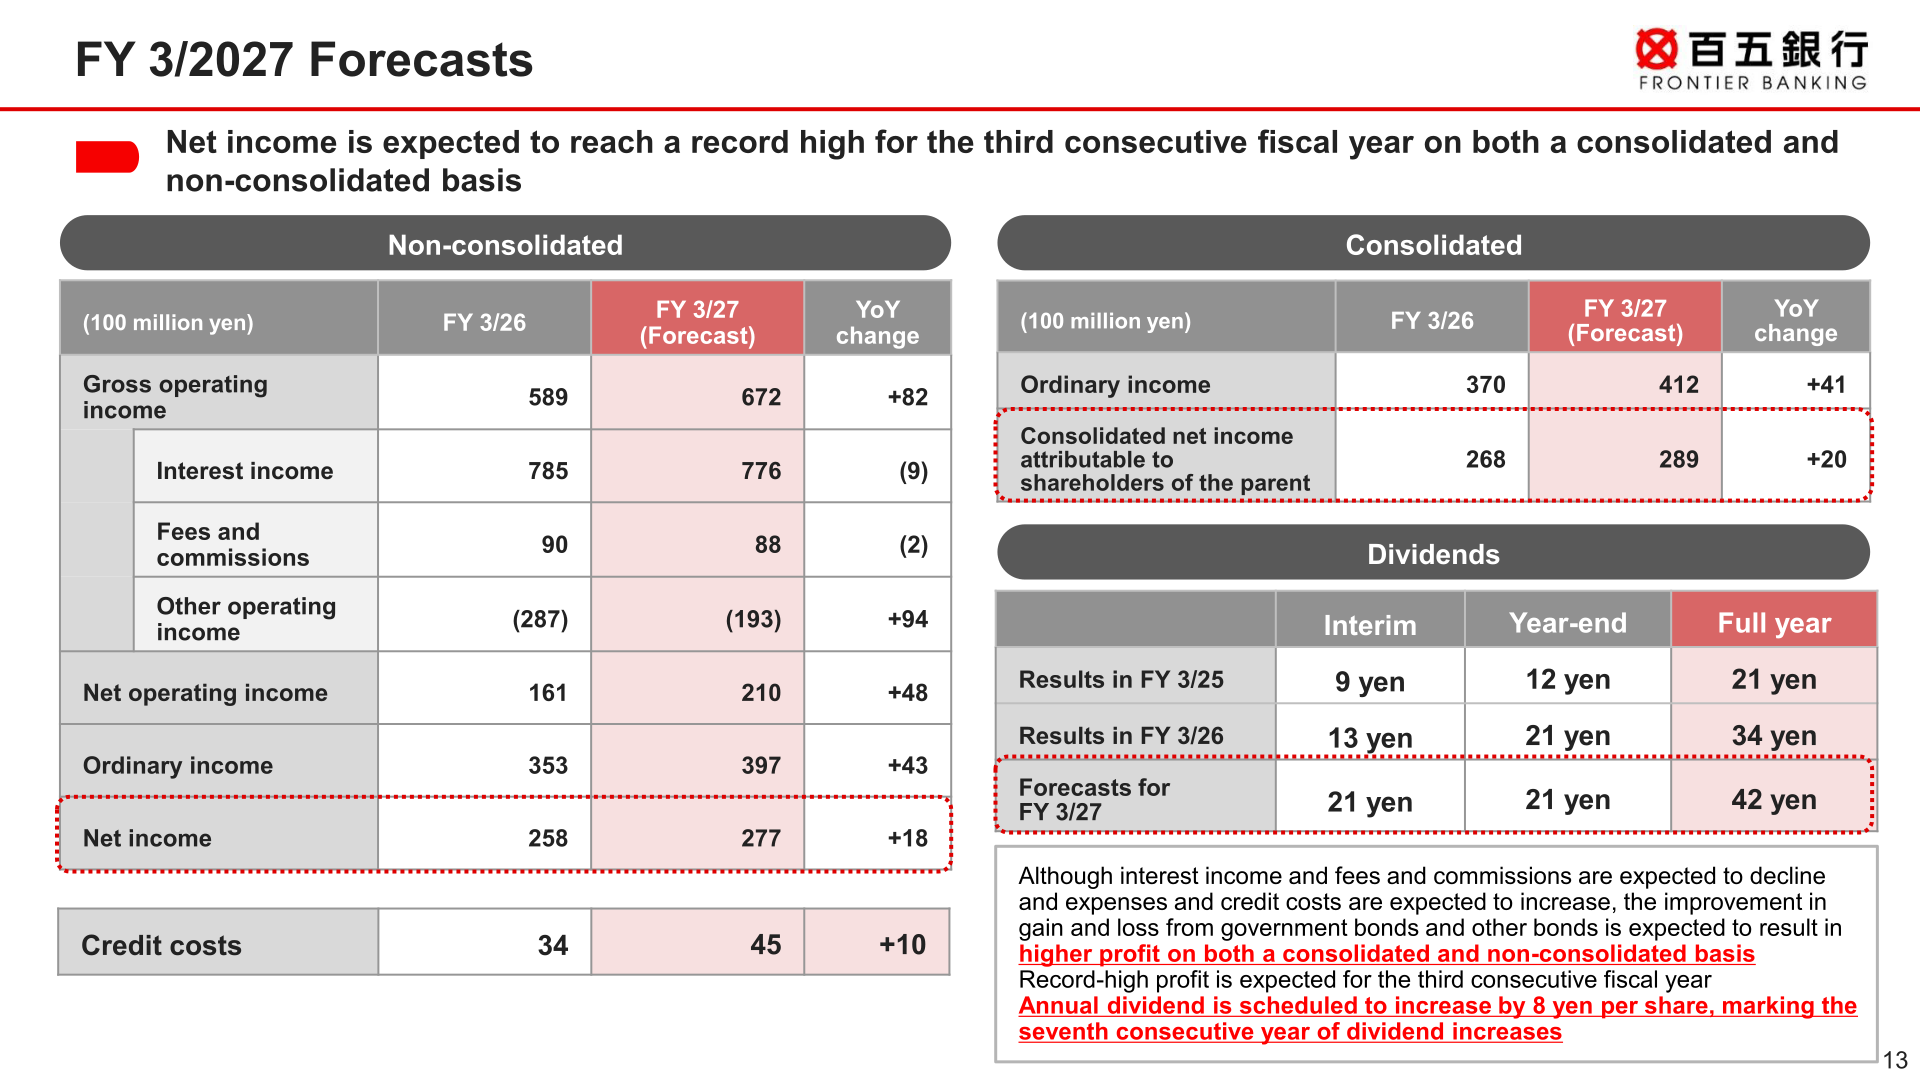
Although interest income and fees and commissions are expected to decline and expenses and credit costs are expected to increase, the improvement in gain and loss from government bonds and other bonds is expected to result in higher profit on both a consolidated and non-consolidated basis. Record-high profit is expected for the third consecutive fiscal year, and the annual dividend is scheduled to increase by 8 yen per share, marking the seventh consecutive year of dividend increases.
| Basis | Item (100 million yen) | FY 3/26 | FY 3/27 (Forecast) | YoY Change |
|---|---|---|---|---|
| Consolidated | Ordinary income | 370 | 412 | +41 |
| Consolidated | Net income attributable to shareholders of the parent | 268 | 289 | +20 |
| Non-Consolidated | Gross operating income | 589 | 672 | +82 |
| Non-Consolidated | Interest income | 785 | 776 | (9) |
| Non-Consolidated | Fees and commissions | 90 | 88 | (2) |
| Non-Consolidated | Other operating income | (287) | (193) | +94 |
| Non-Consolidated | Net operating income | 161 | 210 | +48 |
| Non-Consolidated | Ordinary income | 353 | 397 | +43 |
| Non-Consolidated | Net income | 258 | 277 | +18 |
| Non-Consolidated | Credit costs | 34 | 45 | +10 |
Shareholder Returns
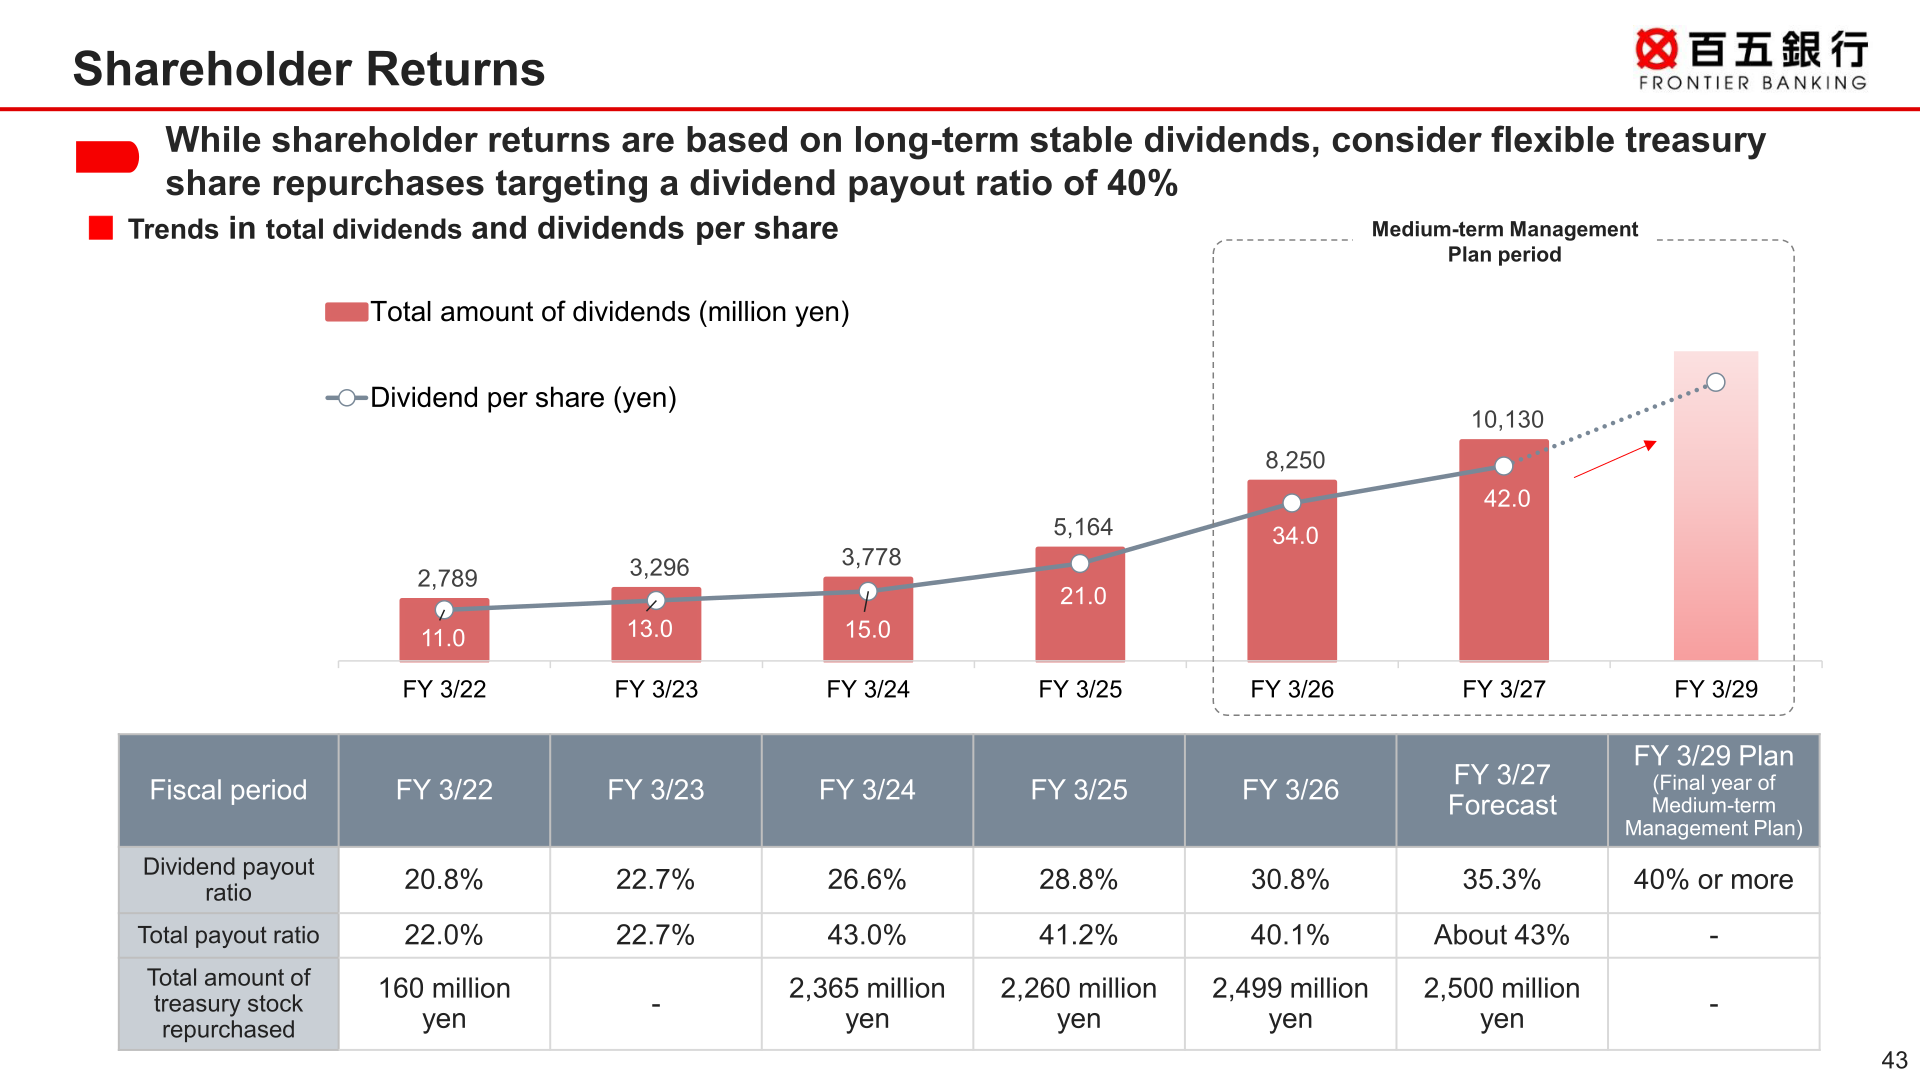
The annual dividend for FY 3/26 was 34 yen per share (interim 13 yen, year-end 21 yen), up from 21 yen in FY 3/25 (interim 9 yen, year-end 12 yen). For FY 3/27, the Bank forecasts an annual dividend of 42 yen per share (interim 21 yen, year-end 21 yen). The dividend payout ratio rose to 30.8% in FY 3/26 from 28.8% in FY 3/25, and is forecast at 35.3% for FY 3/27, moving toward the Bank’s target of a dividend payout ratio of 40% or more in FY 3/29, the final year of the Medium-term Management Plan. While shareholder returns are based on long-term stable dividends, the Bank stated it will consider flexible treasury share repurchases; the Bank repurchased 2,499 million yen of treasury stock in FY 3/26 and plans to repurchase 2,500 million yen in FY 3/27.
| Fiscal Year | Interim (yen) | Year-end (yen) | Full Year (yen) | Dividend Payout Ratio |
|---|---|---|---|---|
| FY 3/25 | 9 | 12 | 21 | 28.8% |
| FY 3/26 | 13 | 21 | 34 | 30.8% |
| FY 3/27 (Forecast) | 21 | 21 | 42 | 35.3% |
Capital Adequacy and Asset Quality
Consolidated equity capital (for equity ratio calculation purposes) was 3,000 (100 million yen) at the end of FY 3/26, up from 2,878 (100 million yen) a year earlier, while risk assets increased to 26,111 (100 million yen) from 23,344 (100 million yen). As a result, the consolidated equity ratio was 11.49% at the end of FY 3/26, down from 12.33% a year earlier. Under the Financial Reconstruction Act disclosure standard, total non-performing loans were 682 (100 million yen) at the end of FY 3/26 versus 680 (100 million yen) a year earlier, and the non-performing loans ratio was 1.30%, down from 1.32%.
| Item | End of FY 3/26 | End of FY 3/25 |
|---|---|---|
| Equity capital (100 million yen) | 3,000 | 2,878 |
| Risk assets (100 million yen) | 26,111 | 23,344 |
| Equity ratio (%) | 11.49 | 12.33 |
| Shareholders’ equity (100 million yen) | 3,427 | 3,244 |
| Non-performing loans, Financial Reconstruction Act basis (100 million yen) | 682 | 680 |
| Non-performing loans ratio (%) | 1.30 | 1.32 |
Group Companies
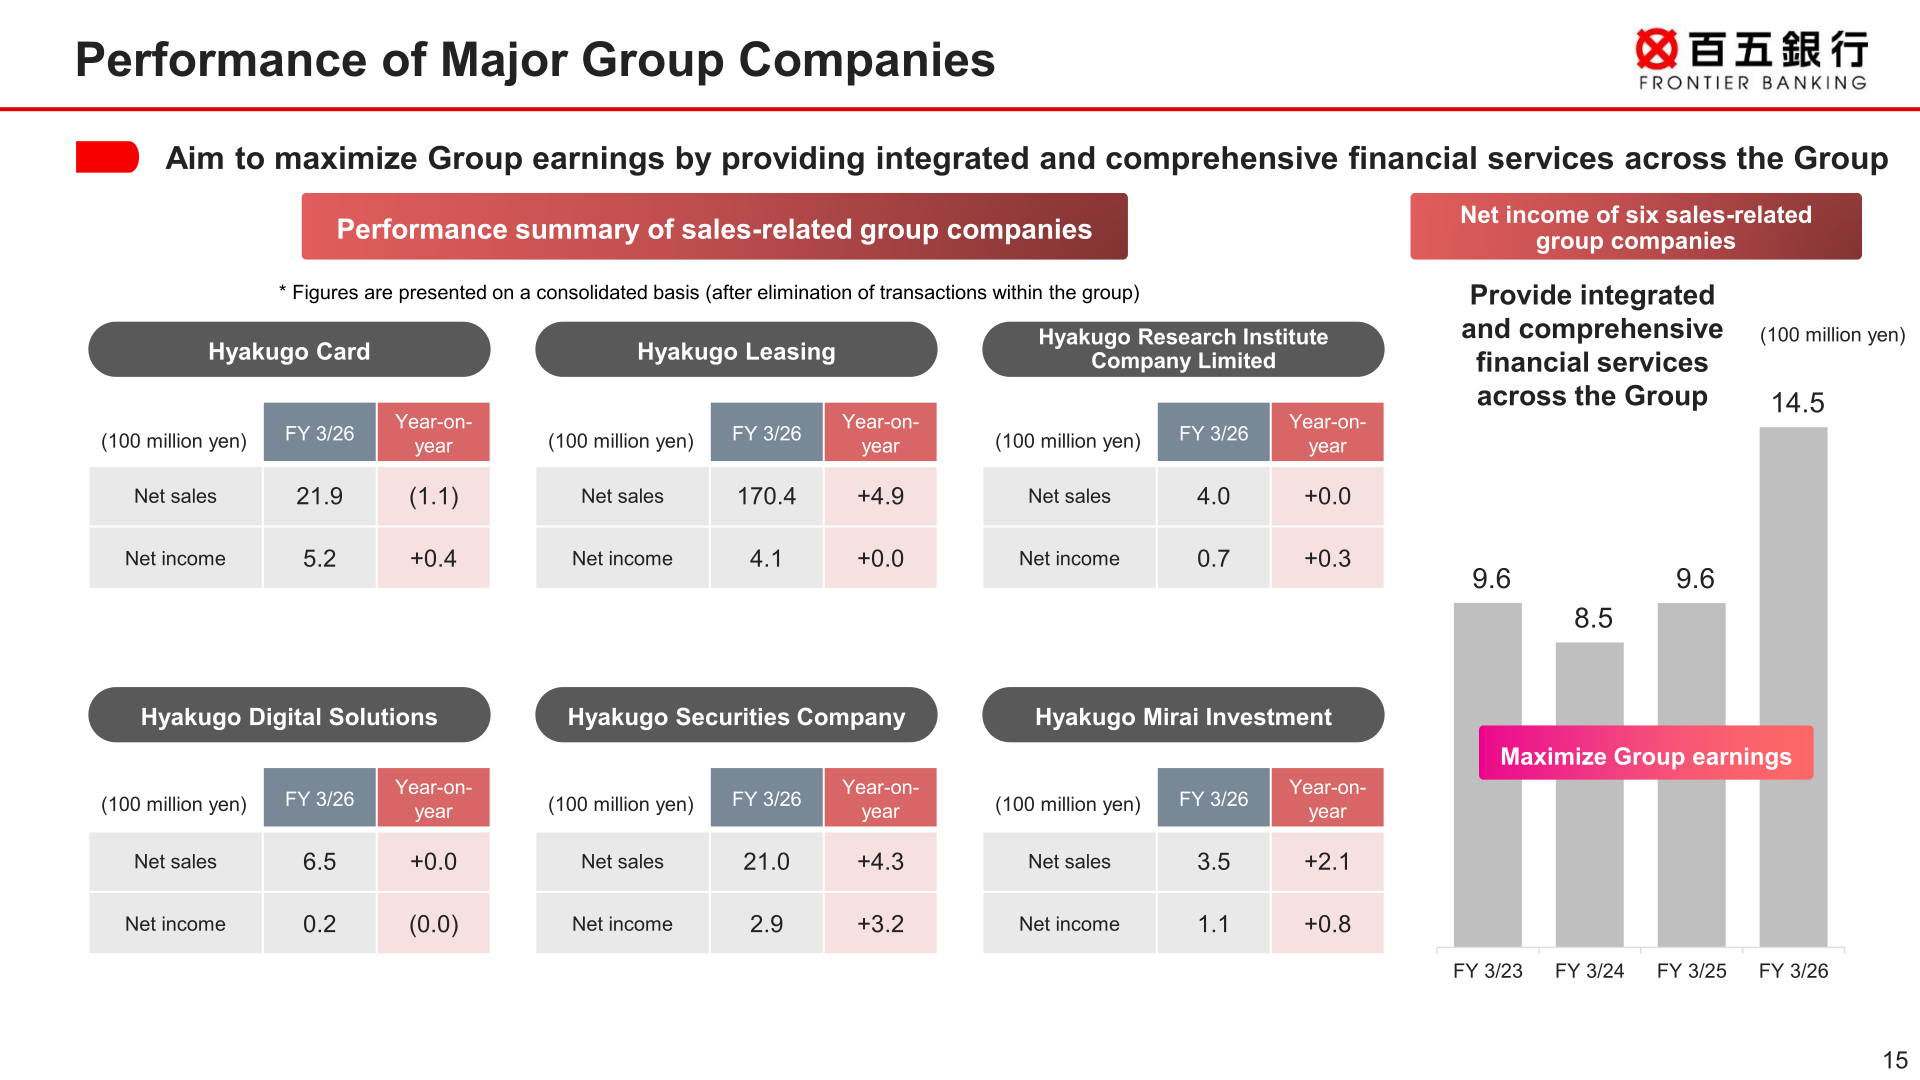
Net income of the Bank’s six sales-related group companies combined was 14.5 (100 million yen) in FY 3/26, versus 9.6 (100 million yen) in FY 3/25. By company for FY 3/26 (year-on-year change in parentheses): Hyakugo Card net sales 21.9 (1.1) and net income 5.2 (+0.4); Hyakugo Leasing net sales 170.4 (+4.9) and net income 4.1 (+0.0); Hyakugo Research Institute Company Limited net sales 4.0 (+0.0) and net income 0.7 (+0.3); Hyakugo Digital Solutions net sales 6.5 (+0.0) and net income 0.2 ((0.0)); Hyakugo Securities Company net sales 21.0 (+4.3) and net income 2.9 (+3.2); Hyakugo Mirai Investment net sales 3.5 (+2.1) and net income 1.1 (+0.8). All figures are presented on a consolidated basis, after elimination of transactions within the group.
| Company | Metric | FY 3/26 (100 million yen) | YoY Change |
|---|---|---|---|
| Hyakugo Card | Net sales | 21.9 | (1.1) |
| Hyakugo Card | Net income | 5.2 | +0.4 |
| Hyakugo Leasing | Net sales | 170.4 | +4.9 |
| Hyakugo Leasing | Net income | 4.1 | +0.0 |
| Hyakugo Research Institute Company Limited | Net sales | 4.0 | +0.0 |
| Hyakugo Research Institute Company Limited | Net income | 0.7 | +0.3 |
| Hyakugo Digital Solutions | Net sales | 6.5 | +0.0 |
| Hyakugo Digital Solutions | Net income | 0.2 | (0.0) |
| Hyakugo Securities Company | Net sales | 21.0 | +4.3 |
| Hyakugo Securities Company | Net income | 2.9 | +3.2 |
| Hyakugo Mirai Investment | Net sales | 3.5 | +2.1 |
| Hyakugo Mirai Investment | Net income | 1.1 | +0.8 |
Medium-Term Management Plan
The Bank revised the financial targets of its Medium-term Management Plan (April 2025 – March 2029, “KAI-KAKU 150 FINAL STAGE”) in response to changes in the external environment. The FY 3/29 target for ROE in consolidated net assets was raised from “5% or more” to “6% or more” (aiming for 8% in the long term), based on a revised assumed policy interest rate of 0.75% versus 0.50% previously, and the target for consolidated net income was raised from “24.0 billion yen or more” to “34.0 billion yen or more.” The target for sustainable finance by FY2030 was raised from 1.0 trillion yen to 2.0 trillion yen (in both cases, of which more than 500 billion yen is environment-related loans). Results in FY 3/26 were: ROE in consolidated net assets of 5.63%, up from 3.87% in FY 3/25; consolidated net income of 26.8 billion yen; and sustainable finance of 1.2263 trillion yen, of which 314.9 billion yen was environment-related loans.
As part of its plan to reduce cross-shareholdings by more than 20.0 billion yen on a market value basis over the four years through FY 3/2029, the Bank sold 18.9 billion yen of cross-shareholdings in FY2025 and completed the sale of all shares held in the retirement benefit trust (deemed holdings), totaling 41.8 billion yen.
This article is an analysis based on publicly available information and is not a recommendation to buy or sell any specific securities. Investment decisions are your own responsibility.
















