
This article is based on publicly available IR materials and is not a recommendation to buy or sell any specific securities.
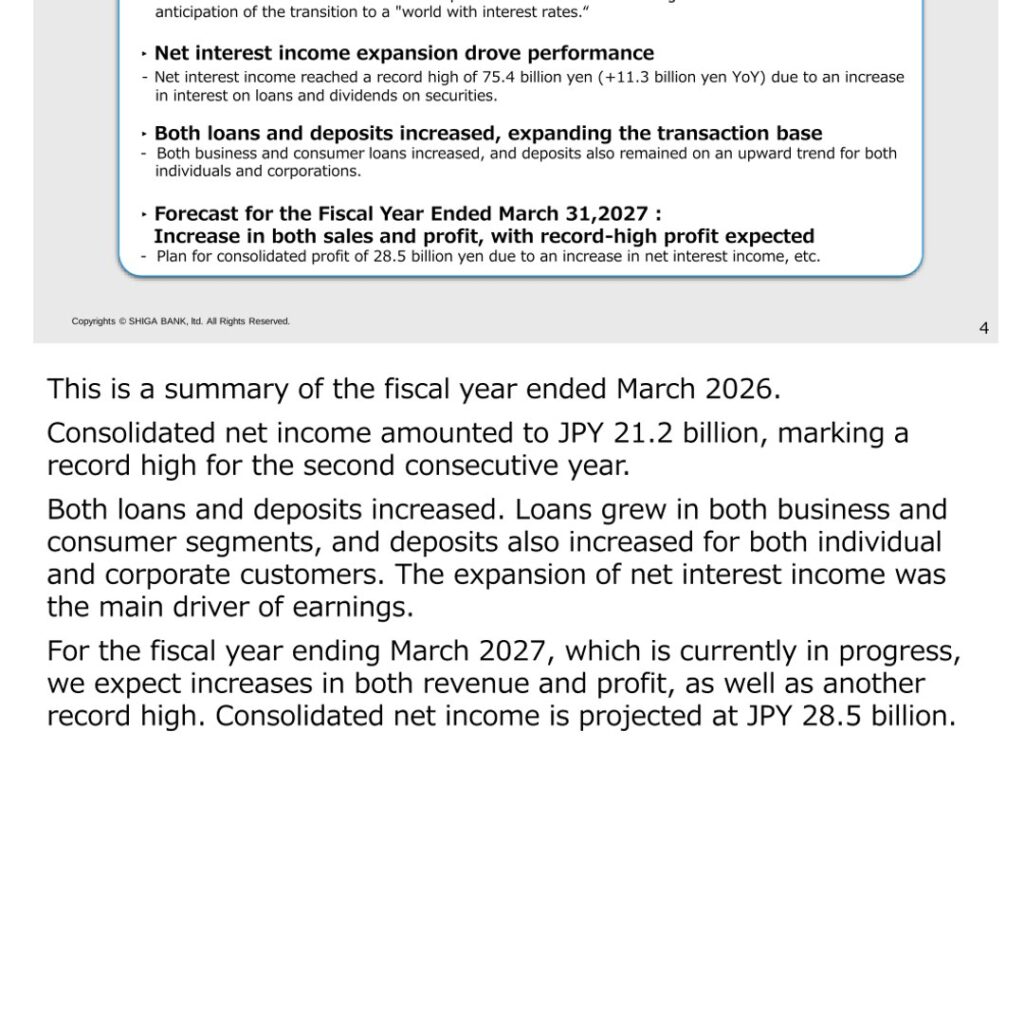
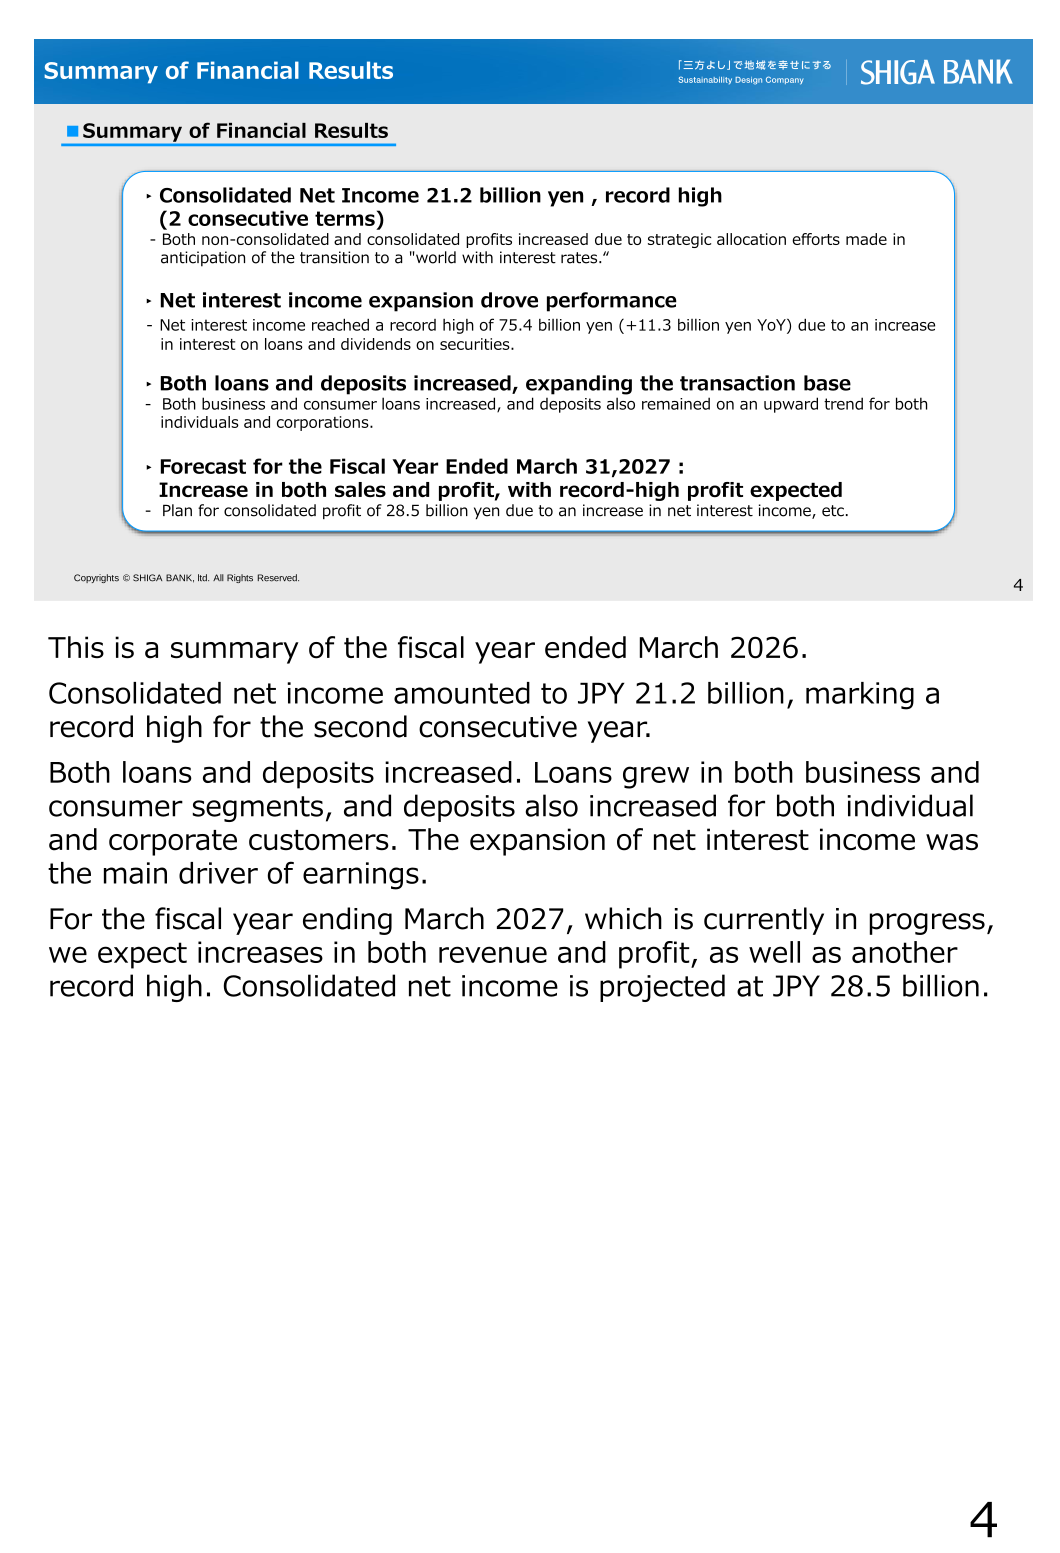
Note: The Shiga Bank’s investor presentation refers to the fiscal year ended March 31, 2026 using the company’s own period notation (“2026.3”); in line with this site’s naming convention, that most recently completed full fiscal year is referred to as FY2025 in the title and slug of this article, while the tables below retain the company’s own period labels (e.g. “2026.3”, “2025.3”). The Shiga Bank, Ltd. (8366) reported consolidated net income of 21.2 billion yen for the fiscal year ended March 31, 2026, a record high for the second consecutive year and an increase of 2.5 billion yen year-on-year. Net interest income on a non-consolidated basis reached a record 75.4 billion yen (+11.3 billion yen year-on-year), driven by higher interest on loans and dividends on securities, while both loans and deposits increased across business and consumer segments. For the fiscal year ending March 31, 2027, the bank forecasts consolidated net income of 28.5 billion yen, which would mark another record high.
Consolidated Results (Full-Year Actual)
Consolidated gross business profit (topline) was 66.5 billion yen, up 5.7 billion yen year-on-year, with net interest income increasing 10.8 billion yen to 74.1 billion yen. Consolidated ordinary profit rose 10.0 billion yen to 29.0 billion yen, and profit attributable to owners of parent increased 2.5 billion yen to 21.2 billion yen.
| Item | 2026.3 (Actual) | 2025.3 (Actual) | YoY Change |
|---|---|---|---|
| Gross business profit (Topline) | 66.5 | 60.8 | 5.7 |
| Net interest income | 74.1 | 63.2 | 10.8 |
| Net fees and commissions | 12.5 | 13.2 | ▲0.7 |
| Net other ordinary income | ▲20.0 | ▲15.6 | ▲4.4 |
| Expenses (▲) | 50.4 | 46.4 | 3.9 |
| Ordinary profit | 29.0 | 18.9 | 10.0 |
| Extraordinary income (losses) | ▲0.0 | 6.6 | ▲6.7 |
| Profit before income taxes | 28.9 | 25.6 | 3.3 |
| Profit | 21.2 | 18.7 | 2.5 |
| Consolidated Profit attributable to owners of parent | 21.2 | 18.7 | 2.5 |
Balance Sheet Highlights
On a non-consolidated, end-of-period basis, total assets stood at 7.6 trillion yen and net assets at 0.5 trillion yen. Loans totaled 4,624.9 billion yen (of which 2,678.3 billion yen in Shiga Prefecture), up 61.6 billion yen year-on-year (Shiga Prefecture +47.7 billion yen). Deposits totaled 5,988.1 billion yen (of which 5,264.0 billion yen in Shiga Prefecture), up 140.8 billion yen year-on-year (Shiga Prefecture +81.0 billion yen). Securities totaled 1,728.6 billion yen, down 77.0 billion yen year-on-year. The loan yield was 1.30%, the deposit yield was 0.24%, and the spread widened to 1.06% year-on-year.
Asset Quality and Capital
Credit costs fell sharply to negative 0.1 billion yen (a net reversal) in the fiscal year ended March 2026, reflecting few downgrades among large borrowers and reversals of the general allowance for loan losses; credit costs are forecast at 3.2 billion yen for the fiscal year ending March 2027. The FRA (Financial Reconstruction Act) disclosed-claims NPL ratio improved to 1.53% from 1.77% a year earlier. Consolidated ROE improved to 4.46% from 4.00%, while the Total Capital Ratio stood at 13.25%, versus 13.62% a year earlier, with Total Capital of 453.3 billion yen against risk-weighted assets of 3,420.7 billion yen.
| Item | 2026.3 (Actual) | 2025.3 (Actual) |
|---|---|---|
| Credit Costs (billion yen) | ▲0.1 | 4.2 |
| NPL Ratio (FRA Disclosed Claims) | 1.53% | 1.77% |
| Consolidated ROE | 4.46% | 4.00% |
| Total Capital Ratio | 13.25% | 13.62% |
| Total Capital (billion yen) | 453.3 | 409.6 |
| Risk-Weighted Assets (billion yen) | 3,420.7 | 3,006.3 |
Segment Results
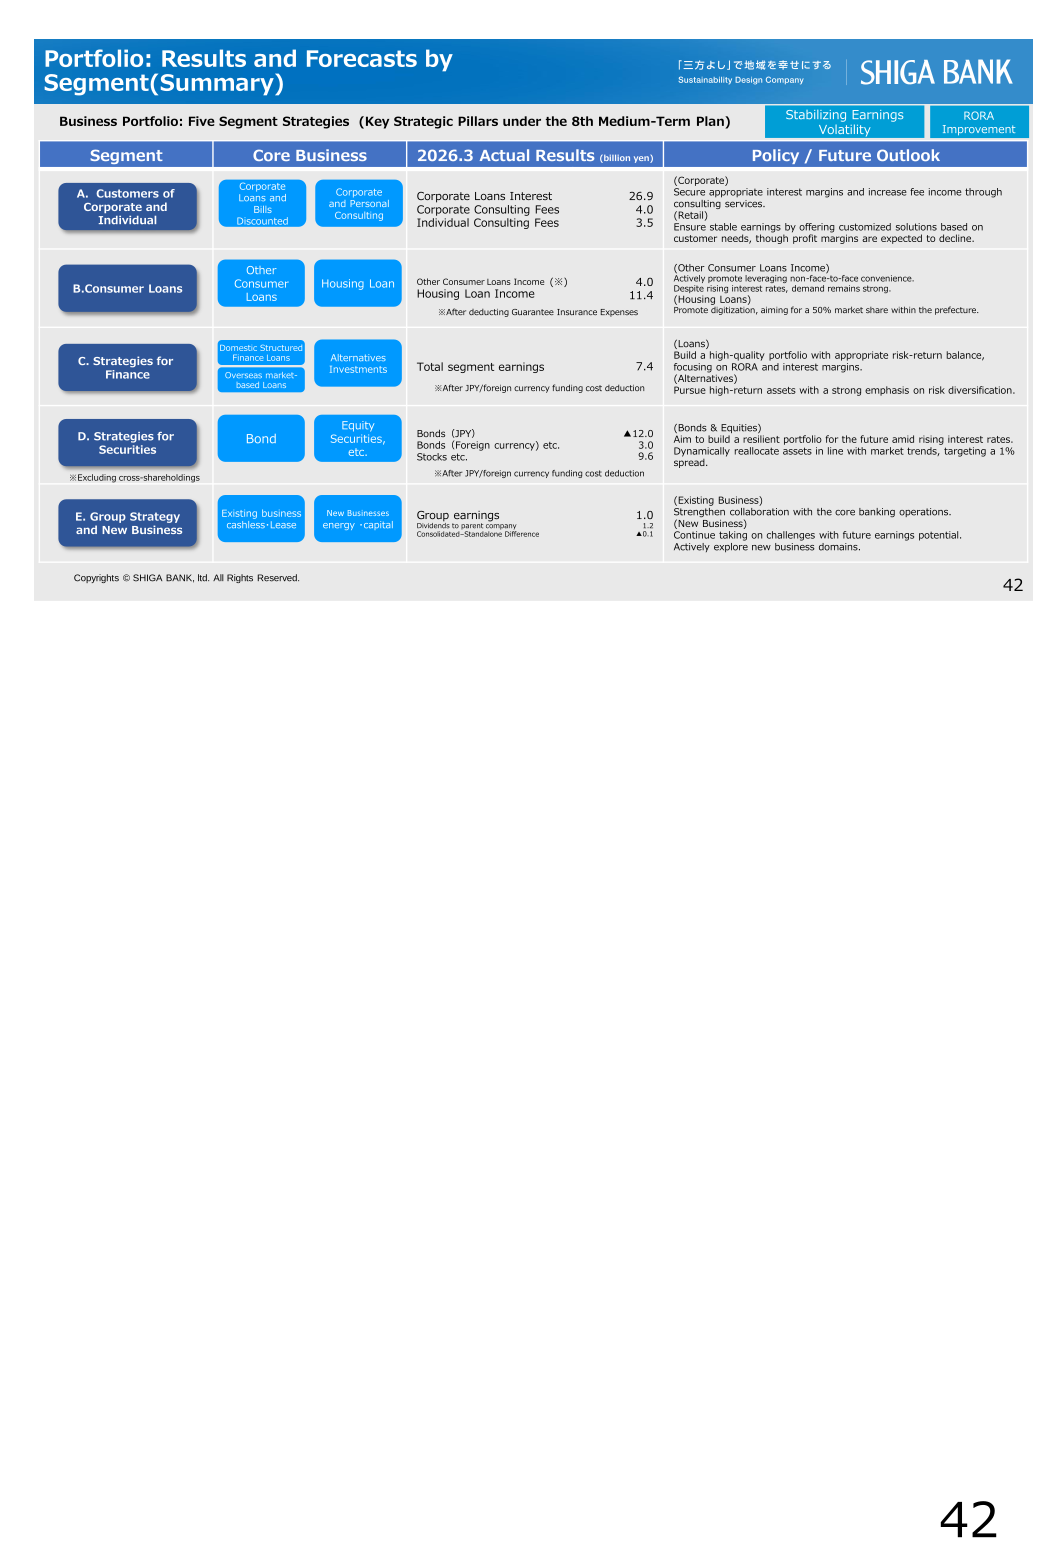
Under the bank’s Five Segment Strategy business portfolio for the fiscal year ended March 2026, Segment A (Customers of Corporate and Individual) generated corporate loan interest of 26.9 billion yen, corporate consulting fees of 4.0 billion yen (a record high) and individual consulting fees of 3.5 billion yen. Segment B (Consumer Loans) generated other consumer loans income of 4.0 billion yen and housing loan income of 11.4 billion yen. Segment C (Strategies for Finance) generated total segment earnings of 7.4 billion yen, reaching the initial final-year plan of the Medium-Term Management Plan. Segment D (Strategies for Securities) posted a loss of 12.0 billion yen on JPY bonds, offset by gains of 3.0 billion yen on foreign-currency bonds and 9.6 billion yen on stocks. Segment E (Group Strategy and New Business) generated group earnings of 1.0 billion yen, including dividends to the parent company of 1.2 billion yen.
| Segment | Metric | 2026.3 (Actual, billion yen) |
|---|---|---|
| A. Customers of Corporate and Individual | Corporate Loans Interest | 26.9 |
| A. Customers of Corporate and Individual | Corporate Consulting Fees | 4.0 |
| A. Customers of Corporate and Individual | Individual Consulting Fees | 3.5 |
| B. Consumer Loans | Other Consumer Loans Income | 4.0 |
| B. Consumer Loans | Housing Loan Income | 11.4 |
| C. Strategies for Finance | Total segment earnings | 7.4 |
| D. Strategies for Securities | Bonds (JPY) | ▲12.0 |
| D. Strategies for Securities | Bonds (Foreign currency) etc. | 3.0 |
| D. Strategies for Securities | Stocks etc. | 9.6 |
| E. Group Strategy and New Business | Group earnings | 1.0 |
| E. Group Strategy and New Business | Dividends to Parent Company | 1.2 |
FY2026 Forecast
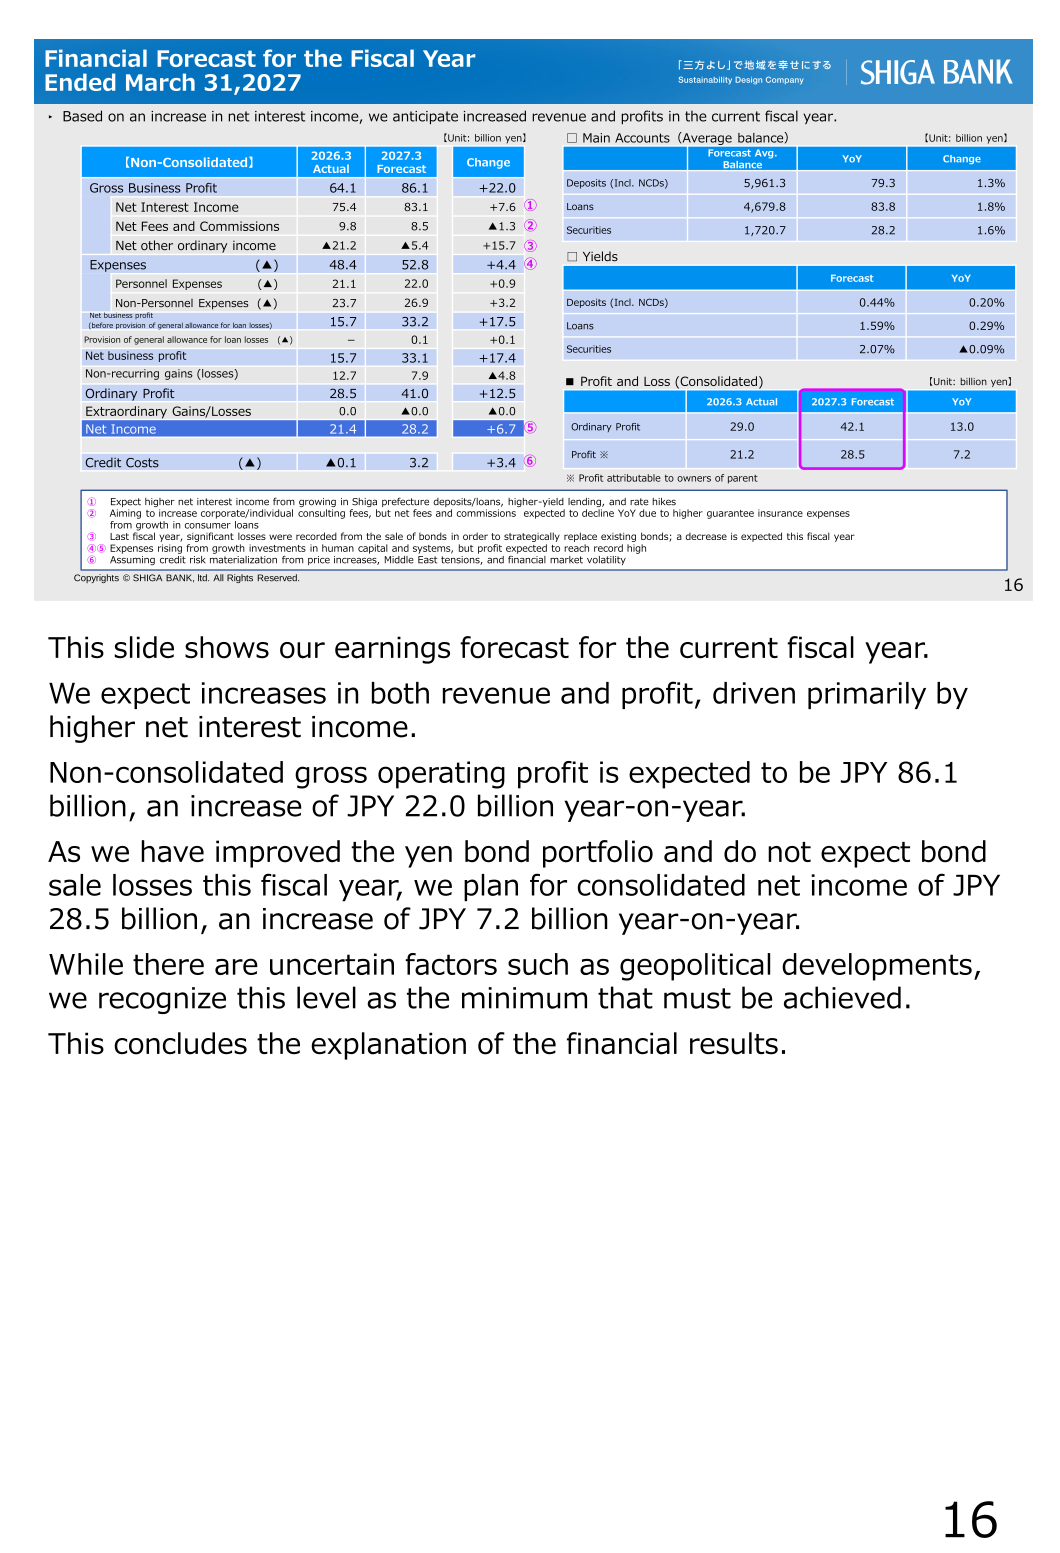
For the fiscal year ending March 31, 2027, the bank forecasts increases in both revenue and profit. On a non-consolidated basis, gross business profit is expected to rise 22.0 billion yen to 86.1 billion yen, mainly on higher net interest income, while non-consolidated net income is forecast at 28.2 billion yen (+6.7 billion yen year-on-year). On a consolidated basis, ordinary profit is forecast at 42.1 billion yen and profit attributable to owners of parent at 28.5 billion yen, up 7.2 billion yen year-on-year, which would represent another record high. The bank cites uncertain factors including geopolitical developments and forecasts credit costs of 3.2 billion yen.
| Item | 2026.3 (Actual) | 2027.3 (Forecast) | YoY Change |
|---|---|---|---|
| Gross Business Profit (Non-Consolidated) | 64.1 | 86.1 | 22.0 |
| Net Interest Income (Non-Consolidated) | 75.4 | 83.1 | 7.6 |
| Net Fees and Commissions (Non-Consolidated) | 9.8 | 8.5 | ▲1.3 |
| Expenses (▲) (Non-Consolidated) | 48.4 | 52.8 | 4.4 |
| Net Business Profit before provision of general allowance for loan losses (Non-Consolidated) | 15.7 | 33.2 | 17.5 |
| Ordinary Profit (Non-Consolidated) | 28.5 | 41.0 | 12.5 |
| Net Income (Non-Consolidated) | 21.4 | 28.2 | 6.7 |
| Credit Costs (▲) (Non-Consolidated) | ▲0.1 | 3.2 | 3.4 |
| Ordinary Profit (Consolidated) | 29.0 | 42.1 | 13.0 |
| Profit Attributable to Owners of Parent (Consolidated) | 21.2 | 28.5 | 7.2 |
Shareholder Returns
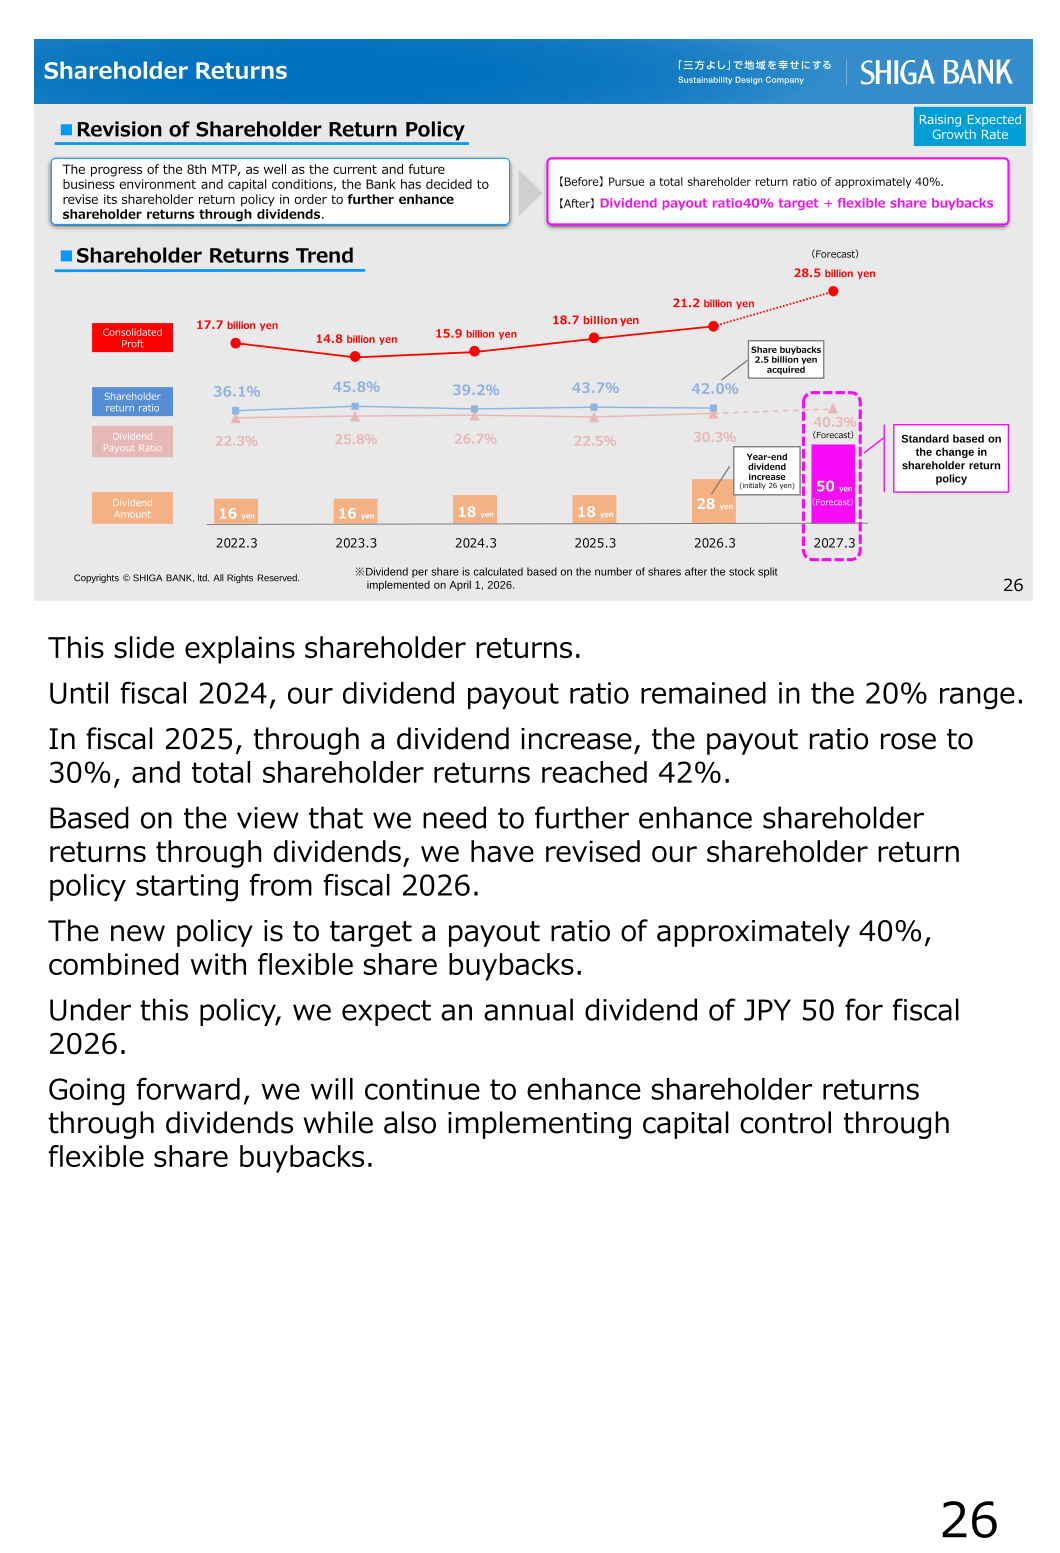
Reflecting progress under the 8th Medium-Term Management Plan and the bank’s capital position, Shiga Bank revised its shareholder return policy from a total shareholder return ratio target of approximately 40% to a dividend payout ratio target of approximately 40% combined with flexible share buybacks. Under the previous policy, the dividend payout ratio rose to 30.3% and the total shareholder return ratio reached 42.0% for the fiscal year ended March 2026. Under the new policy, the bank expects an annual dividend of 50 yen for the fiscal year ending March 2027 (dividend payout ratio 40.3%). The bank also implemented a 5-for-1 stock split effective April 1, 2026 (record date March 31, 2026), and expanded its shareholder benefit program.
| Item | 2026.3 (Actual) | 2027.3 (Forecast) |
|---|---|---|
| Dividend per Share | 28 yen | 50 yen |
| Consolidated Profit | 21.2 billion yen | 28.5 billion yen |
| Dividend Payout Ratio | 30.3% | 40.3% |
| Total Shareholder Return Ratio | 42.0% | – |
Medium-Term Plan / Topics
On April 17, 2026, Shiga Bank entered into a capital and business alliance agreement with Senshu Ikeda Holdings, targeting approximately 10.0 billion yen in synergy effects over five years. The bank raised the consolidated ROE target under its 8th Medium-Term Management Plan to 8% or more (from a previous target of 6% or more) for the fiscal year ending March 31, 2029, and set a target of controlling the consolidated Common Equity Tier 1 capital ratio (excluding other comprehensive income) in the 11% range. The bank also achieved carbon neutrality (Scope 1 and 2) for the Shiga Bank Group in the fiscal year ended March 2026, three years ahead of the original schedule under its sustainability KPIs.
This article is an analysis based on publicly available information and is not a recommendation to buy or sell any specific securities. Investment decisions are your own responsibility.
















