
This article is based on publicly available IR materials and is not a recommendation to buy or sell any specific securities.
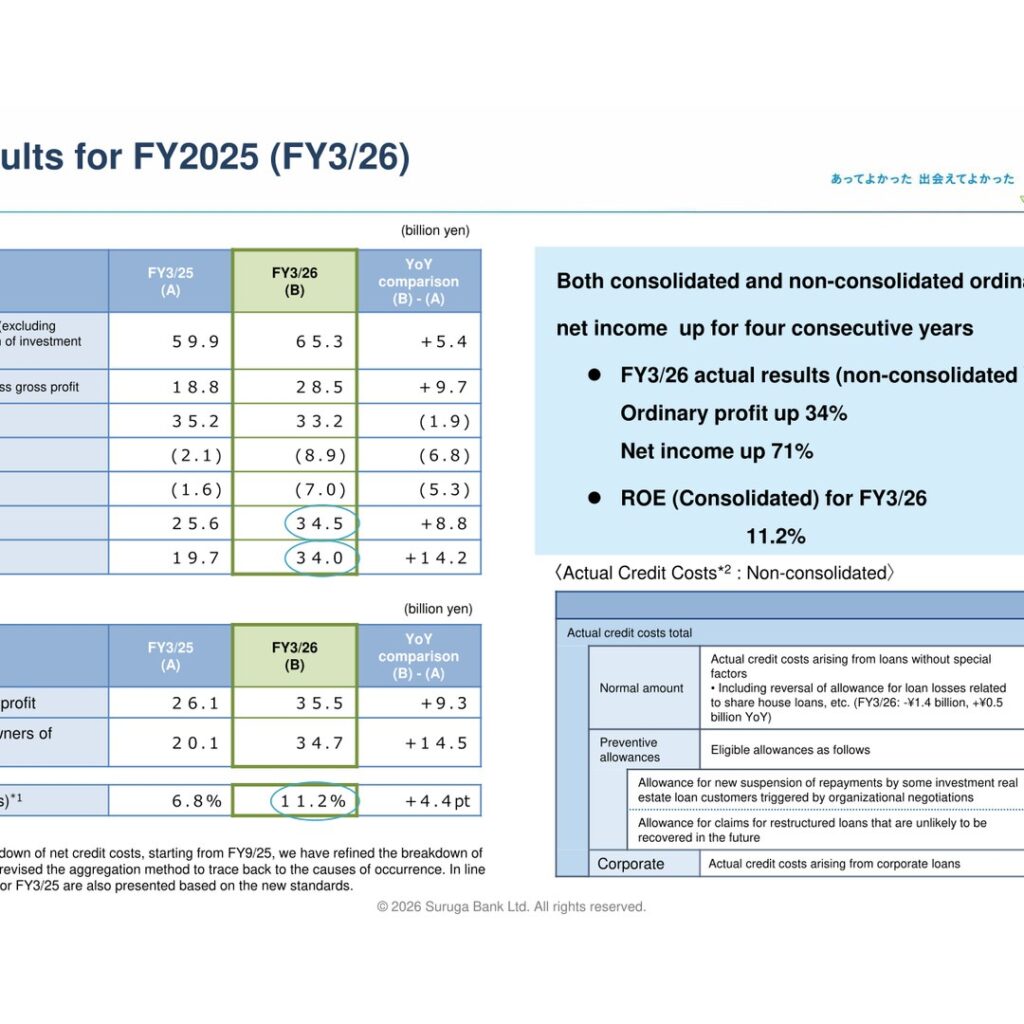
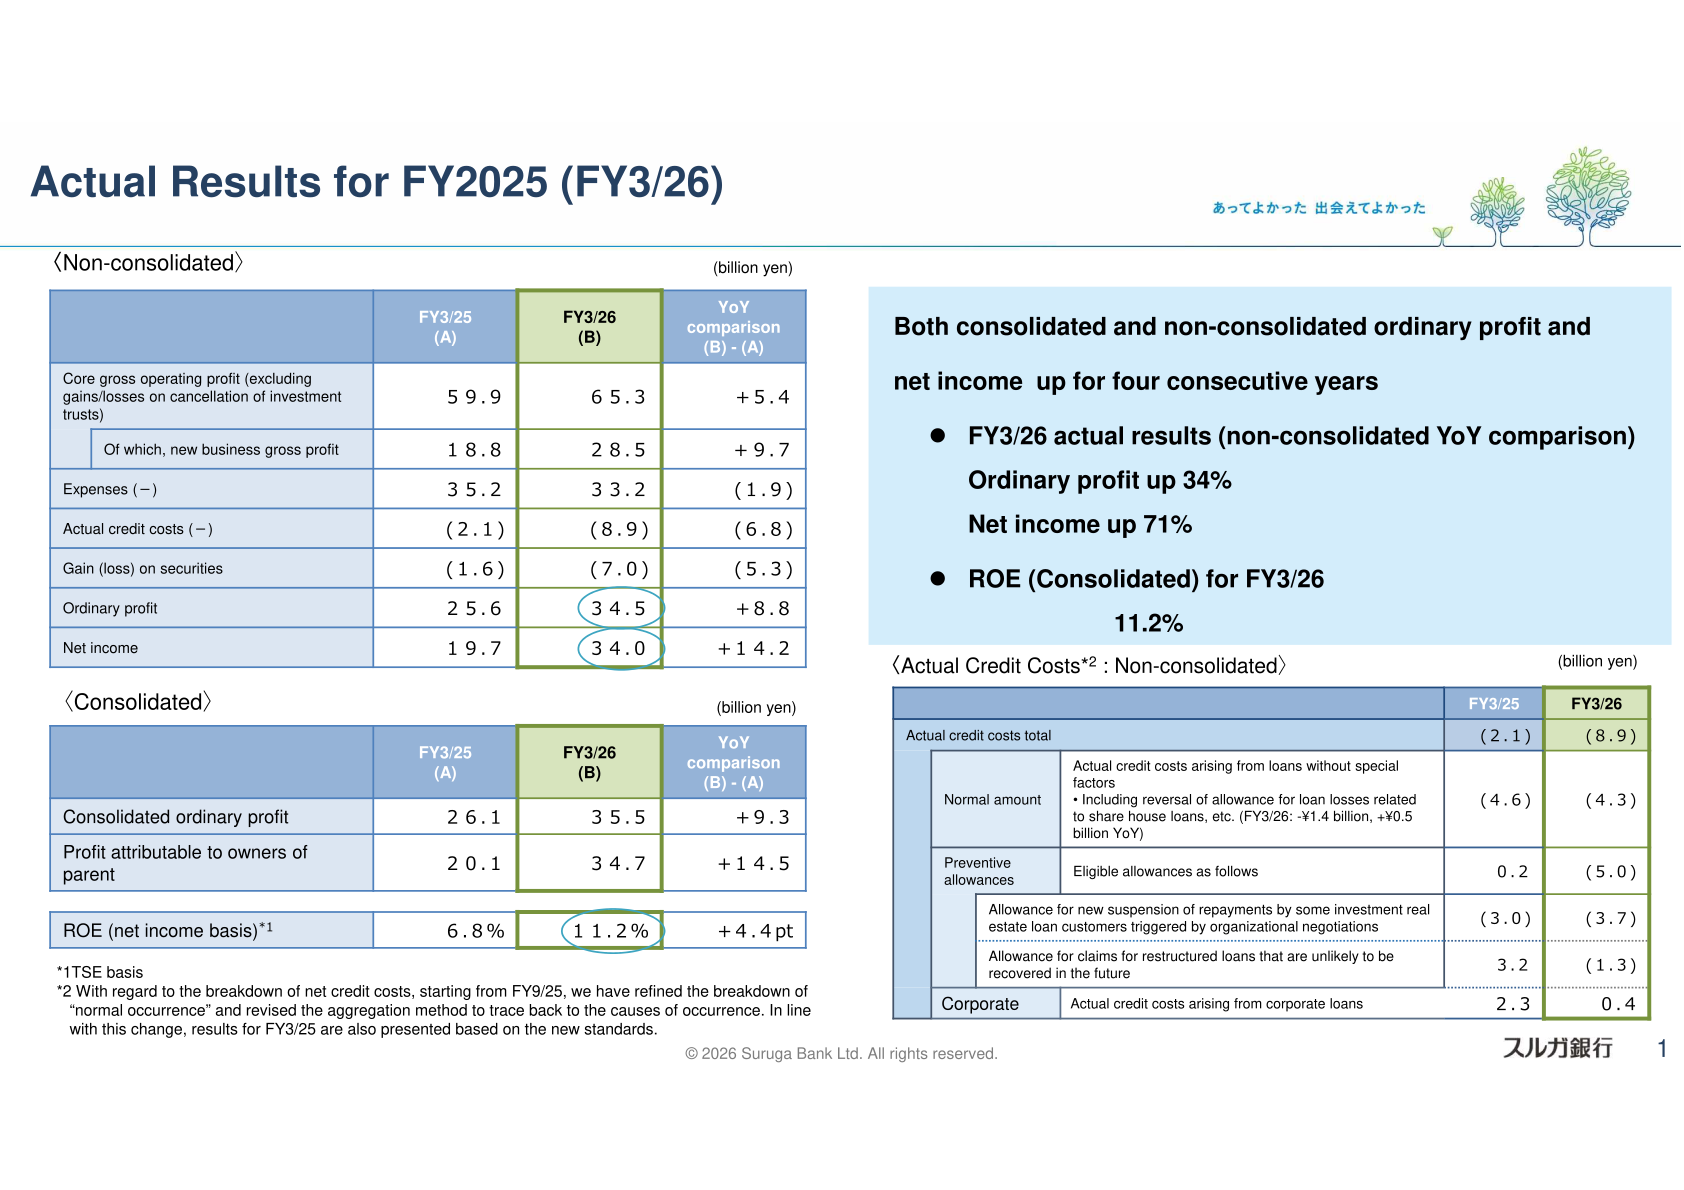
Suruga Bank reported growth in both non-consolidated and consolidated ordinary profit and net income for a fourth consecutive year in FY2025 (the fiscal year ended March 31, 2026). Non-consolidated ordinary profit rose 34% year on year to 34.5 billion yen and non-consolidated net income rose 71% to 34.0 billion yen, while consolidated profit attributable to owners of parent increased to 34.7 billion yen from 20.1 billion yen a year earlier. Consolidated ROE (net income basis, TSE basis) rose to 11.2% from 6.8%. The Bank also increased its full-year dividend per share to 60 yen, up 31 yen year on year.
Consolidated Results (Full-Year Actual)
Core gross operating profit (non-consolidated, excluding gains/losses on cancellation of investment trusts) increased to 65.3 billion yen from 59.9 billion yen, while non-consolidated expenses decreased to 33.2 billion yen from 35.2 billion yen. Non-consolidated actual credit costs increased to (8.9) billion yen from (2.1) billion yen, reflecting preventive allowances for organizational negotiation partners and for claims for restructured loans that are unlikely to be recovered in the future, partly offset by a reversal of the allowance for loan losses related to share house loans. Gain (loss) on securities was (7.0) billion yen, compared with (1.6) billion yen a year earlier, reflecting losses on sales of government and other bonds partly offset by gains on sales of strategic shareholdings.
| Item | FY3/25 (A) | FY3/26 (B) | YoY comparison (B) – (A) |
|---|---|---|---|
| Core gross operating profit (non-consolidated, excl. gains/losses on cancellation of investment trusts) | 59.9 | 65.3 | +5.4 |
| Expenses (non-consolidated) (−) | 35.2 | 33.2 | (1.9) |
| Actual credit costs (non-consolidated) (−) | (2.1) | (8.9) | (6.8) |
| Gain (loss) on securities (non-consolidated) | (1.6) | (7.0) | (5.3) |
| Ordinary profit (non-consolidated) | 25.6 | 34.5 | +8.8 |
| Net income (non-consolidated) | 19.7 | 34.0 | +14.2 |
| Consolidated ordinary profit | 26.1 | 35.5 | +9.3 |
| Profit attributable to owners of parent (consolidated) | 20.1 | 34.7 | +14.5 |
| ROE (net income basis, consolidated, TSE basis) | 6.8% | 11.2% | +4.4pt |
Balance Sheet and Capital Adequacy (as of March 31, 2026)
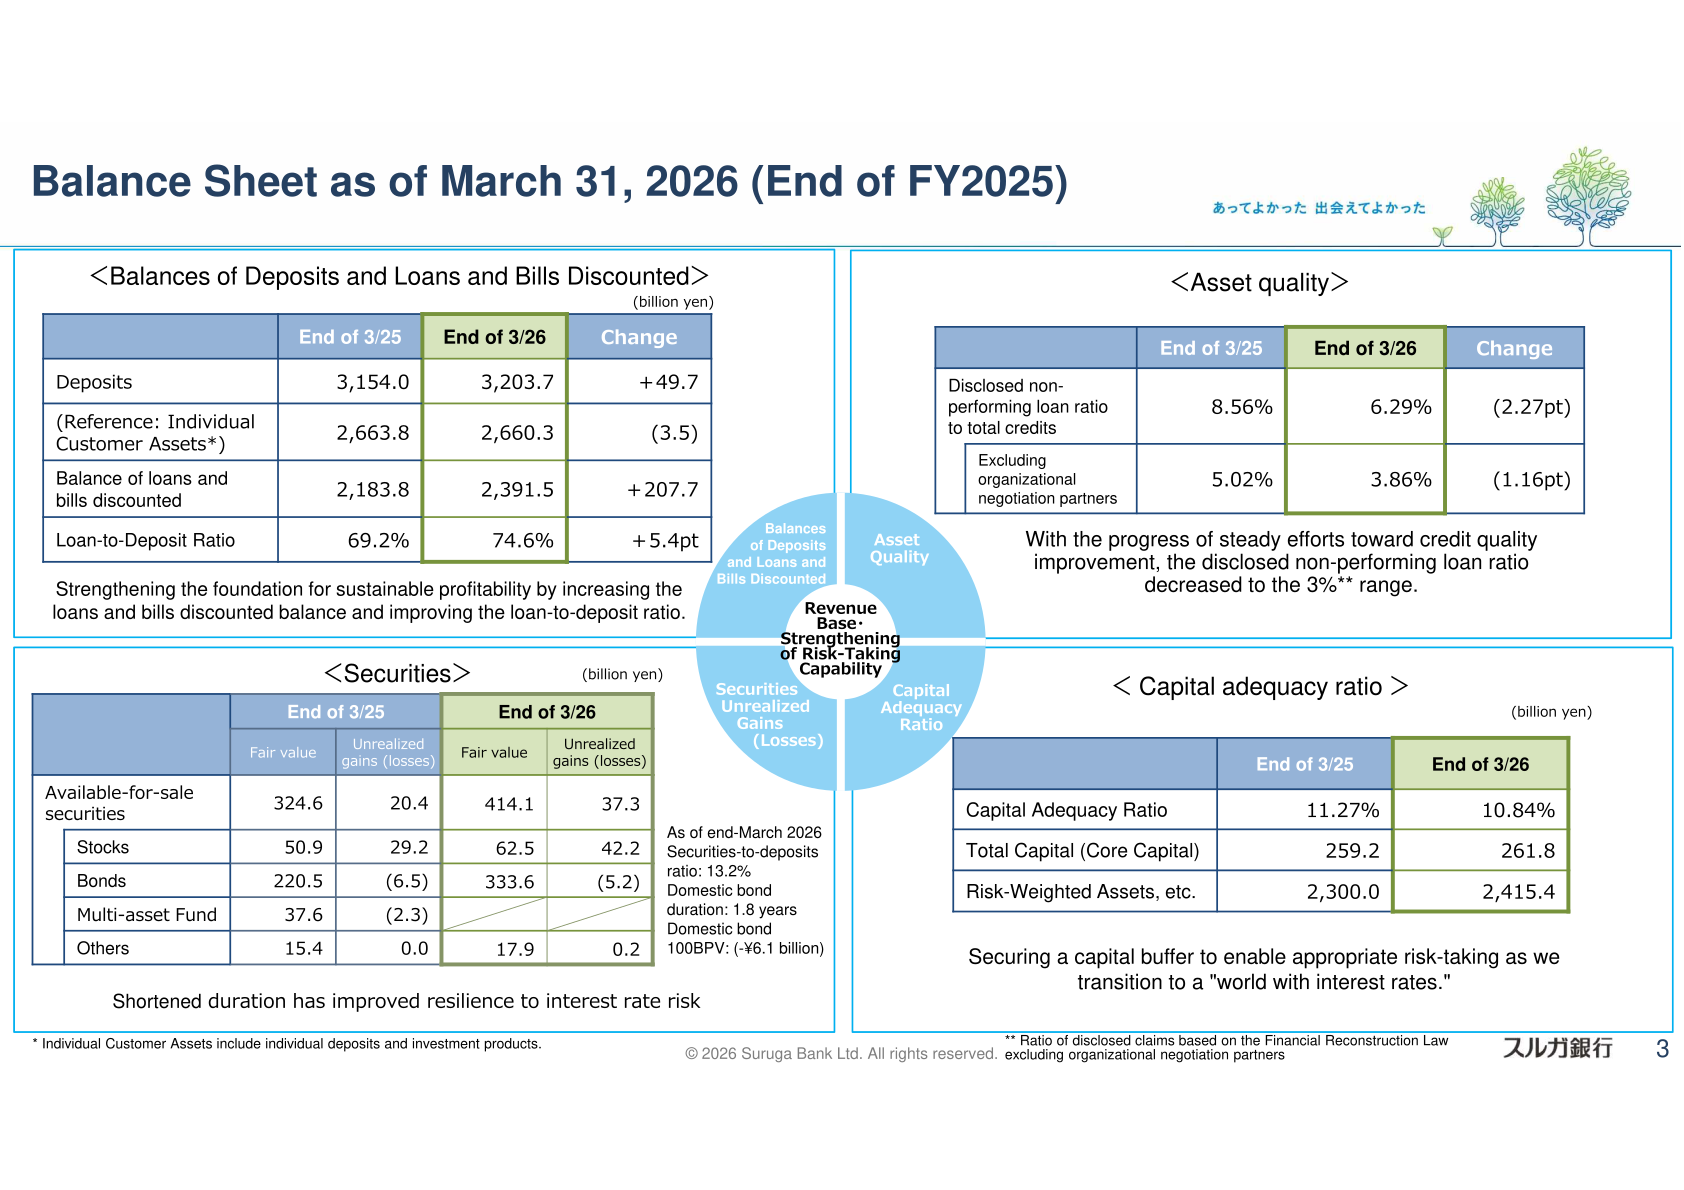
As of March 31, 2026 (end of FY2025), deposits increased to 3,203.7 billion yen from 3,154.0 billion yen a year earlier, and the balance of loans and bills discounted increased to 2,391.5 billion yen from 2,183.8 billion yen, lifting the loan-to-deposit ratio to 74.6% from 69.2%. The disclosed non-performing loan ratio to total credits improved to 6.29% from 8.56% (3.86% from 5.02% excluding organizational negotiation partners). The capital adequacy ratio was 10.84%, down from 11.27% a year earlier, as risk-weighted assets increased to 2,415.4 billion yen from 2,300.0 billion yen while total capital (core capital) increased to 261.8 billion yen from 259.2 billion yen.
| Item | End of 3/25 | End of 3/26 | Change |
|---|---|---|---|
| Deposits (billion yen) | 3,154.0 | 3,203.7 | +49.7 |
| Balance of loans and bills discounted (billion yen) | 2,183.8 | 2,391.5 | +207.7 |
| Loan-to-Deposit Ratio | 69.2% | 74.6% | +5.4pt |
| Disclosed non-performing loan ratio to total credits | 8.56% | 6.29% | (2.27pt) |
| Disclosed non-performing loan ratio, excluding organizational negotiation partners | 5.02% | 3.86% | (1.16pt) |
| Item | End of 3/25 | End of 3/26 |
|---|---|---|
| Capital Adequacy Ratio | 11.27% | 10.84% |
| Total Capital (Core Capital) (billion yen) | 259.2 | 261.8 |
| Risk-Weighted Assets, etc. (billion yen) | 2,300.0 | 2,415.4 |
FY2026 (FY3/27) Forecast
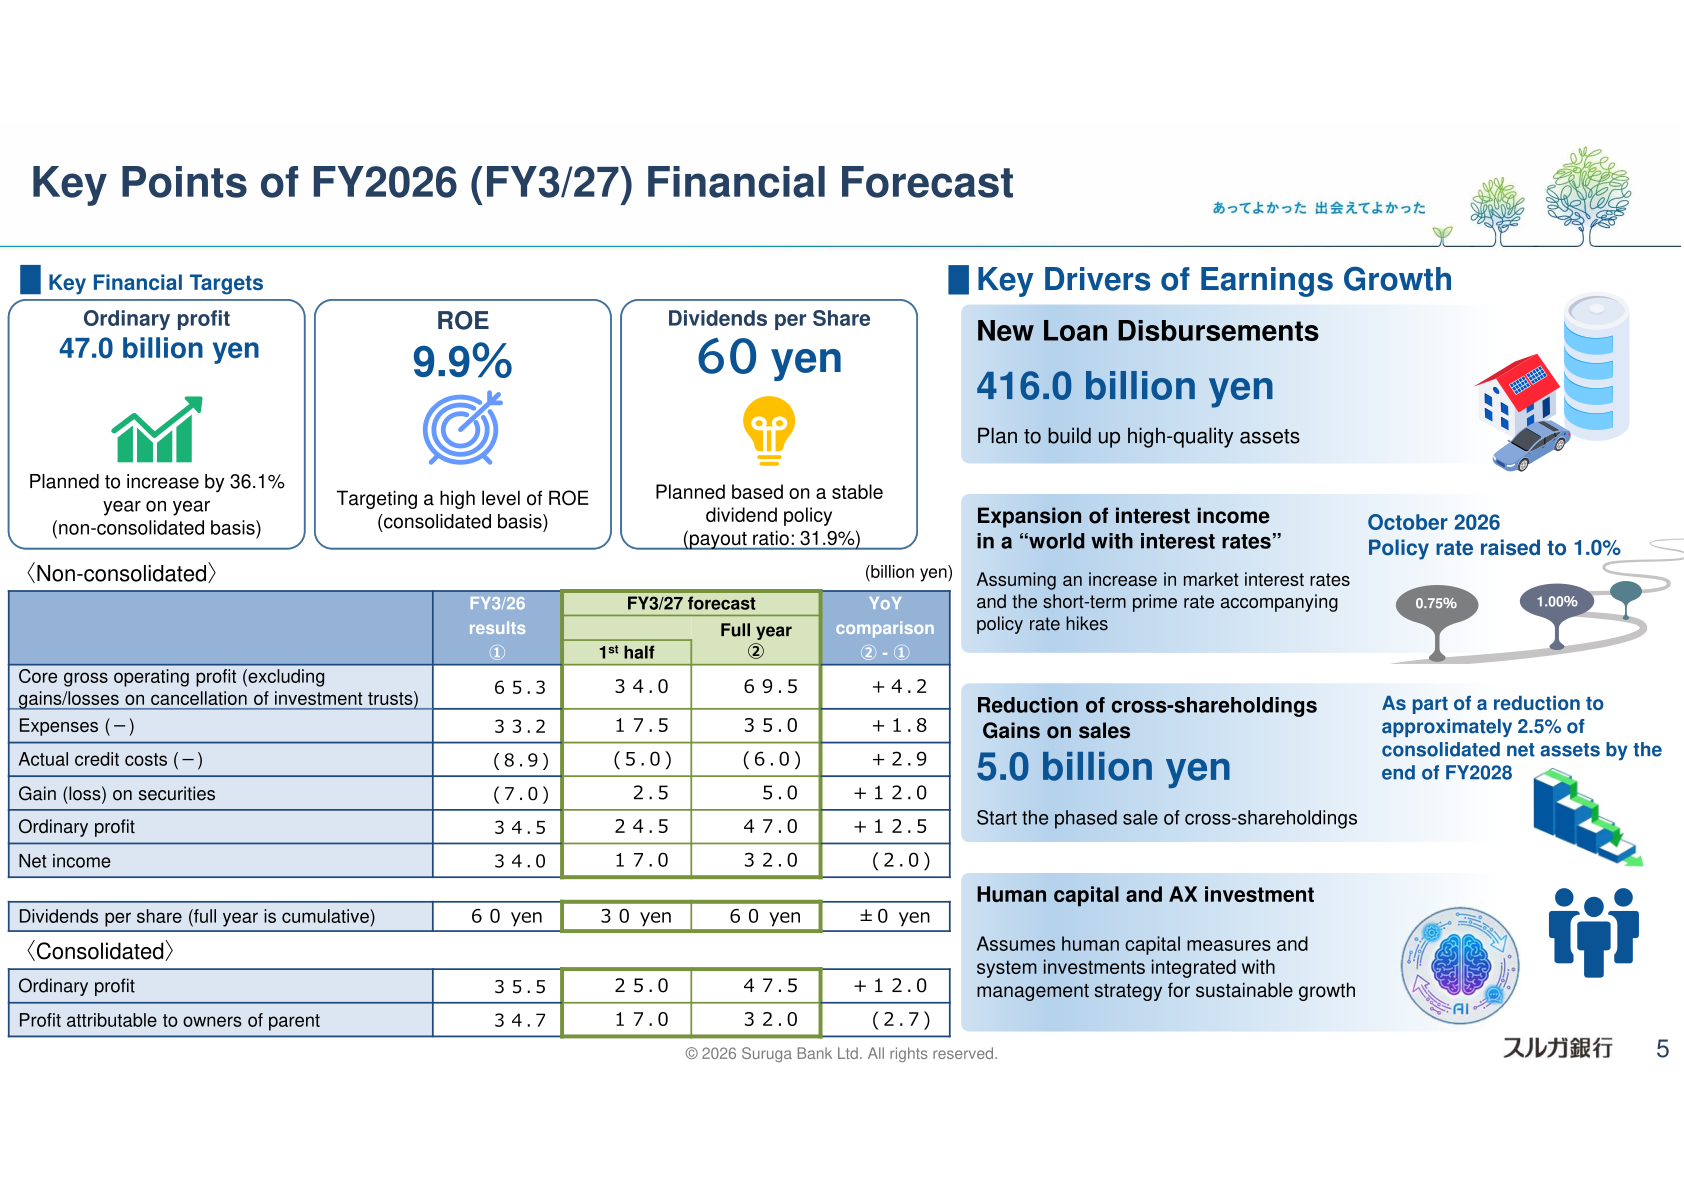
For FY2026 (FY3/27), Suruga Bank forecasts non-consolidated ordinary profit of 47.0 billion yen, up 36.1% year on year, and consolidated ROE of 9.9%. New loan disbursements are planned at 416.0 billion yen, and the Bank plans to record 5.0 billion yen in gains from the phased sale of cross-shareholdings, as part of a reduction to approximately 2.5% of consolidated net assets by the end of FY2028. The forecast assumes an increase in the short-term prime rate from October 2026, following an assumed Bank of Japan policy rate hike to 1.0%.
| Item | FY3/26 Results (①) | FY3/27 Forecast, Full year (②) | YoY comparison (② – ①) |
|---|---|---|---|
| Core gross operating profit (non-consolidated) | 65.3 | 69.5 | +4.2 |
| Expenses (non-consolidated) (−) | 33.2 | 35.0 | +1.8 |
| Actual credit costs (non-consolidated) (−) | (8.9) | (6.0) | +2.9 |
| Gain (loss) on securities (non-consolidated) | (7.0) | 5.0 | +12.0 |
| Ordinary profit (non-consolidated) | 34.5 | 47.0 | +12.5 |
| Net income (non-consolidated) | 34.0 | 32.0 | (2.0) |
| Ordinary profit (consolidated) | 35.5 | 47.5 | +12.0 |
| Profit attributable to owners of parent (consolidated) | 34.7 | 32.0 | (2.7) |
| Dividends per share (full year is cumulative) | 60 yen | 60 yen | ±0 yen |
Shareholder Returns
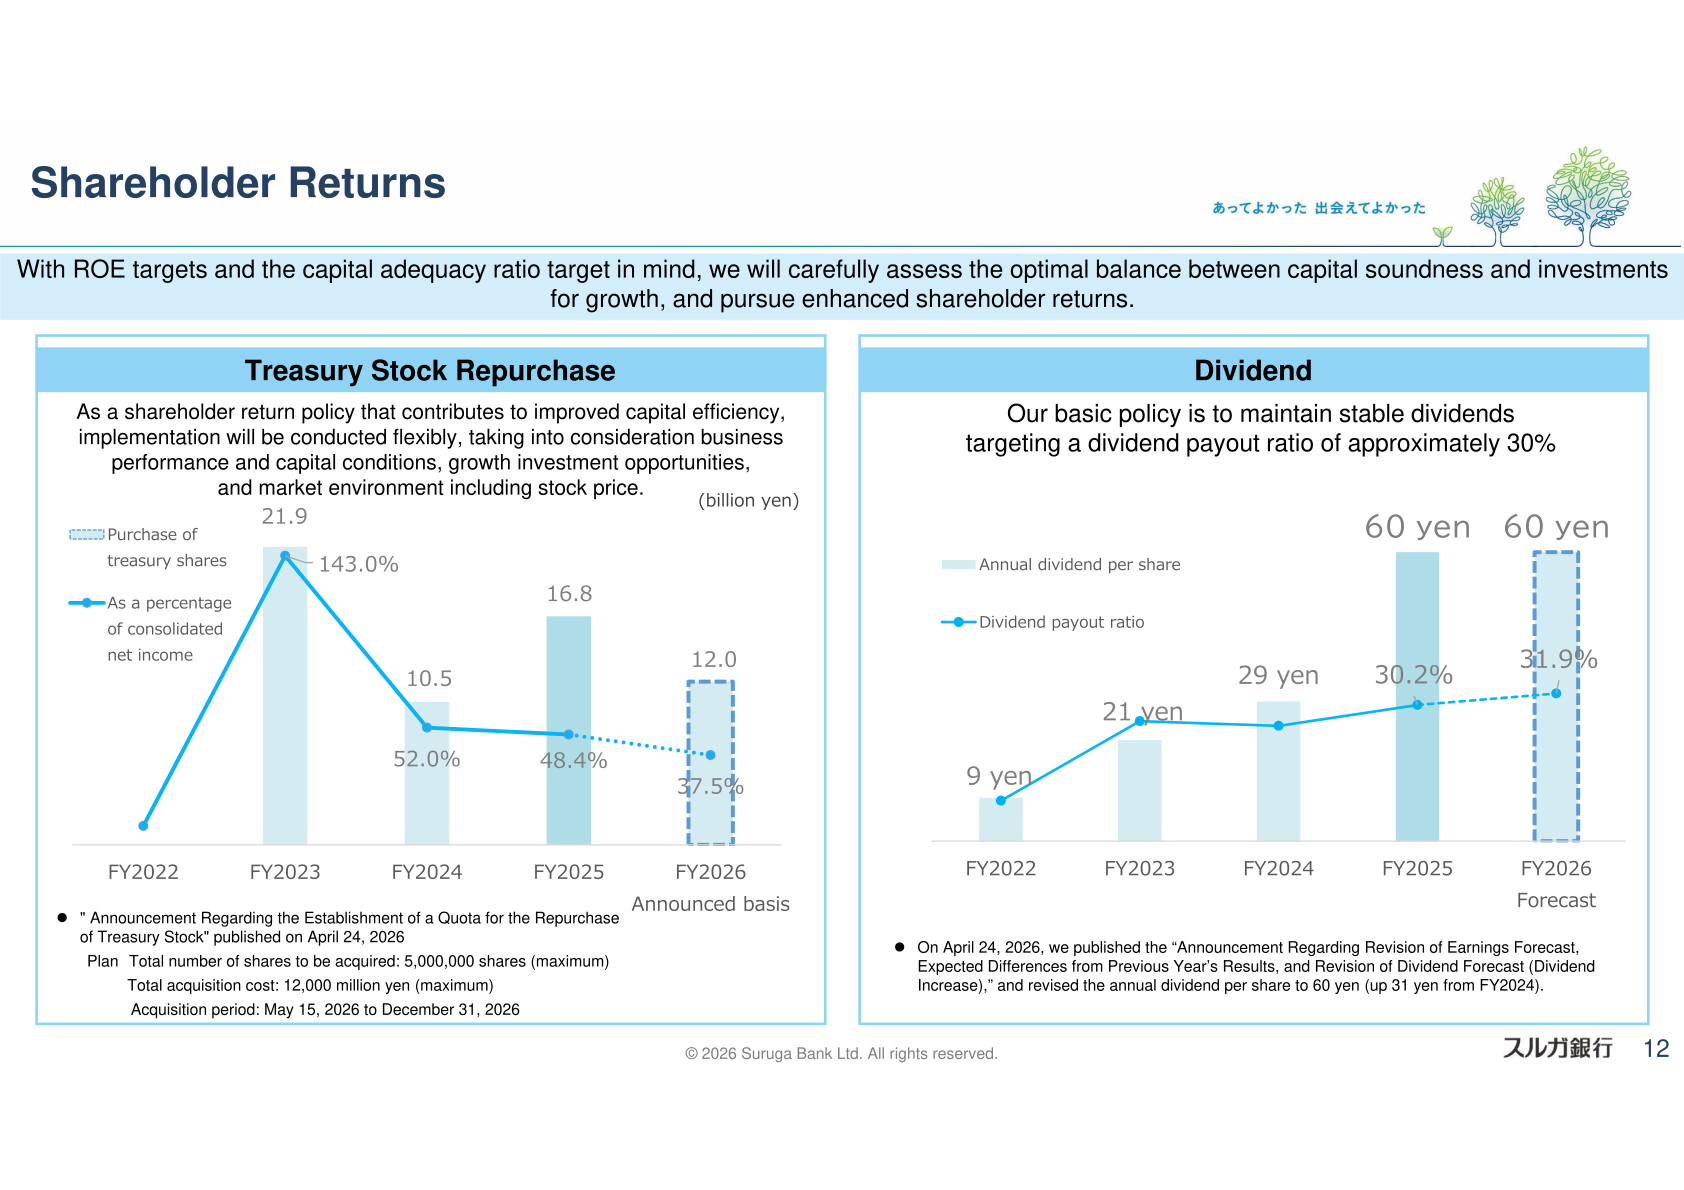
The annual dividend per share rose to 60 yen for FY2025 from 29 yen for FY2024, following an April 24, 2026 announcement revising the earnings and dividend forecast (dividend increase); the dividend payout ratio was 31.9% for FY2025. The dividend forecast for FY2026 is unchanged at 60 yen per share, with a payout ratio of 31.9%, based on the Bank’s basic policy of maintaining stable dividends targeting a payout ratio of approximately 30%. Annual dividends per share had progressed from 9 yen in FY2022 to 21 yen in FY2023 to 29 yen in FY2024. Separately, on April 24, 2026 the Bank published an announcement regarding the establishment of a quota for the repurchase of treasury stock, planning to acquire up to 5,000,000 shares for a total acquisition cost of up to 12,000 million yen, during the period from May 15, 2026 to December 31, 2026.
Medium-Term Plan / Topics
Suruga Bank stated that it achieved the KPI targets for all main KPIs and secondary KPIs under its previous mid-term business plan (FY2023–FY2025). Under the new mid-term business plan, the Bank has set an ROE target of 11% or higher and a target effective capital adequacy ratio of approximately 10% (within a target range of 9.5%–10.5%), both by the end of FY2028. The plan’s three management strategies are described as deepening the Yatsugatake Model, sustainable growth through an alliance strategy (including the alliance with Credit Saison Co., Ltd.), and co-creation with AI across the organization.
This article is an analysis based on publicly available information and is not a recommendation to buy or sell any specific securities. Investment decisions are your own responsibility.
















