
This article is based on publicly available IR materials and is not a recommendation to buy or sell any specific securities.
Note: Tsukuba Bank does not publish an English results presentation; this article is an English translation of the Japanese-language article on our sister site Investalk, which is based on the company’s Japanese-language IR materials, with figures transcribed as reported. The company refers to the fiscal year ended March 31, 2026 as “the fiscal year ended March 2026” (2026年3月期); this site classifies it as FY2025.
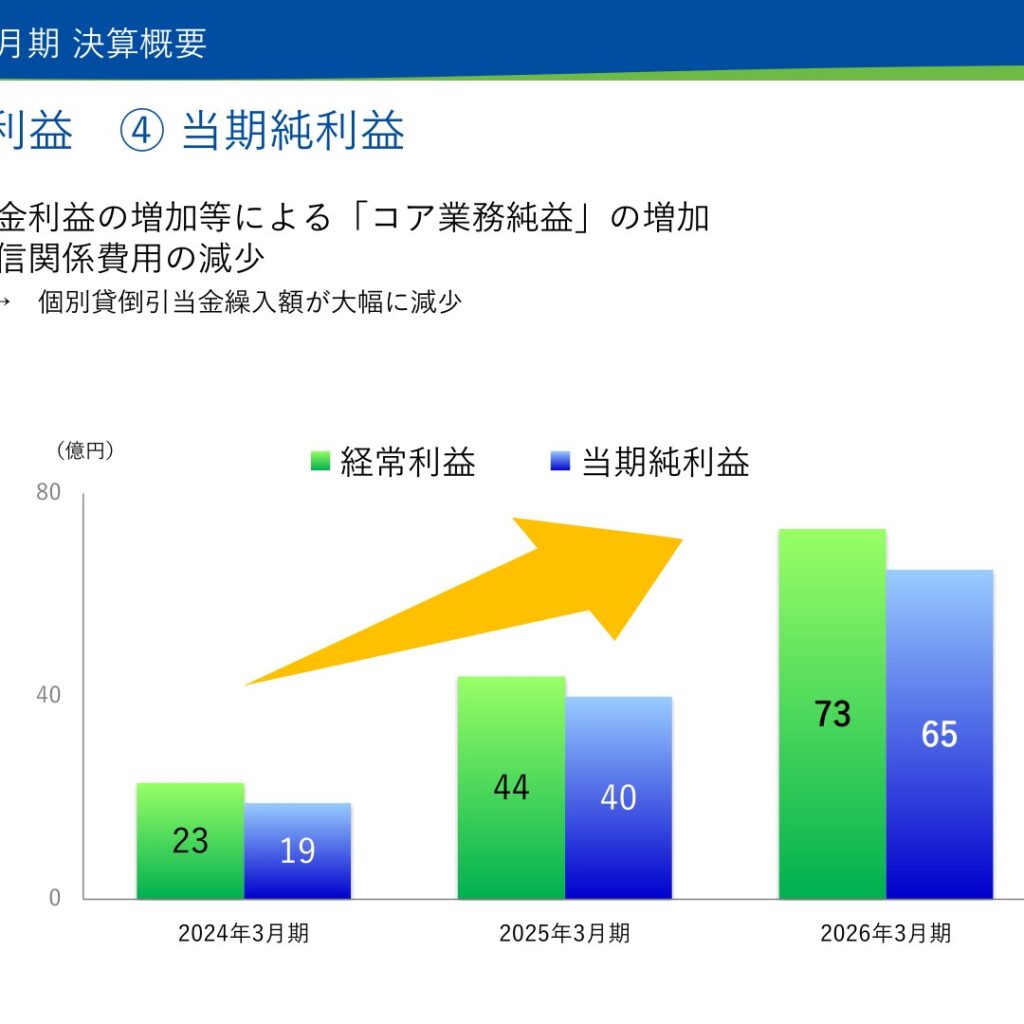
Tsukuba Bank, Ltd. announced its results for the fiscal year ended March 31, 2026 (non-consolidated). Gross business profit was ¥27.8 billion (down ¥0.2 billion year on year), while core business net profit was ¥9.9 billion (up ¥3.0 billion) and net income was ¥6.5 billion (up ¥2.5 billion), both marking record highs since the bank’s founding in 2010. Ordinary profit also increased, to ¥7.3 billion (up ¥2.9 billion).
Results (FY ended March 31, 2026, Non-Consolidated)
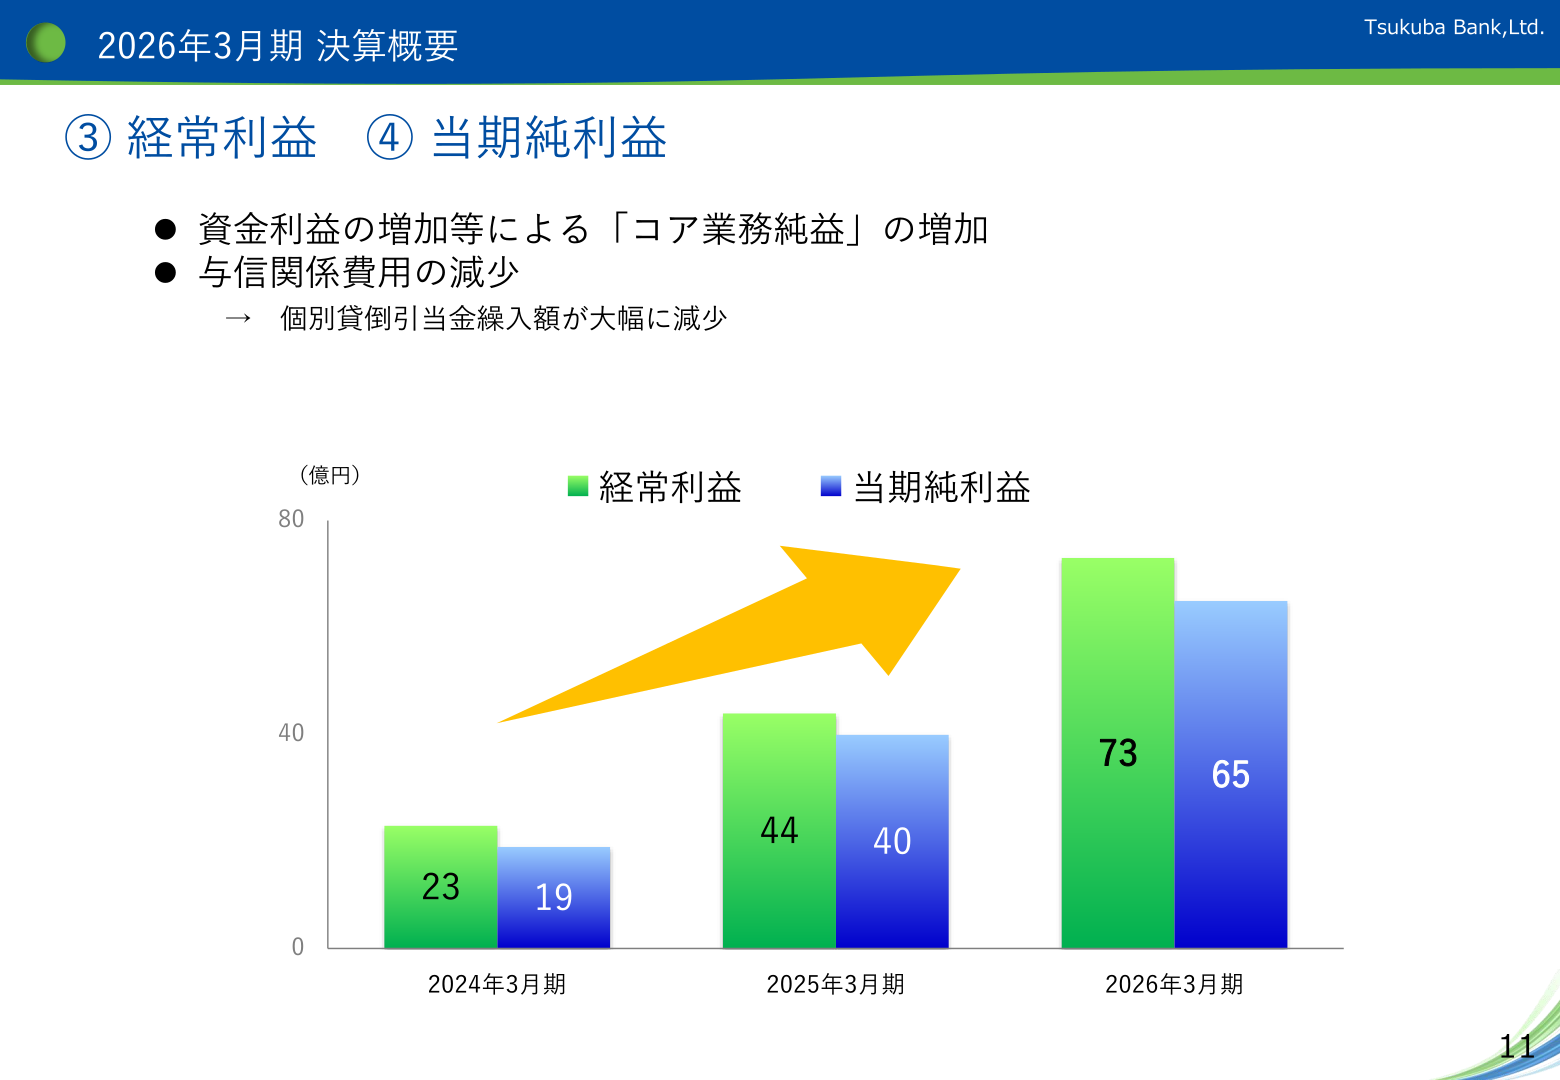
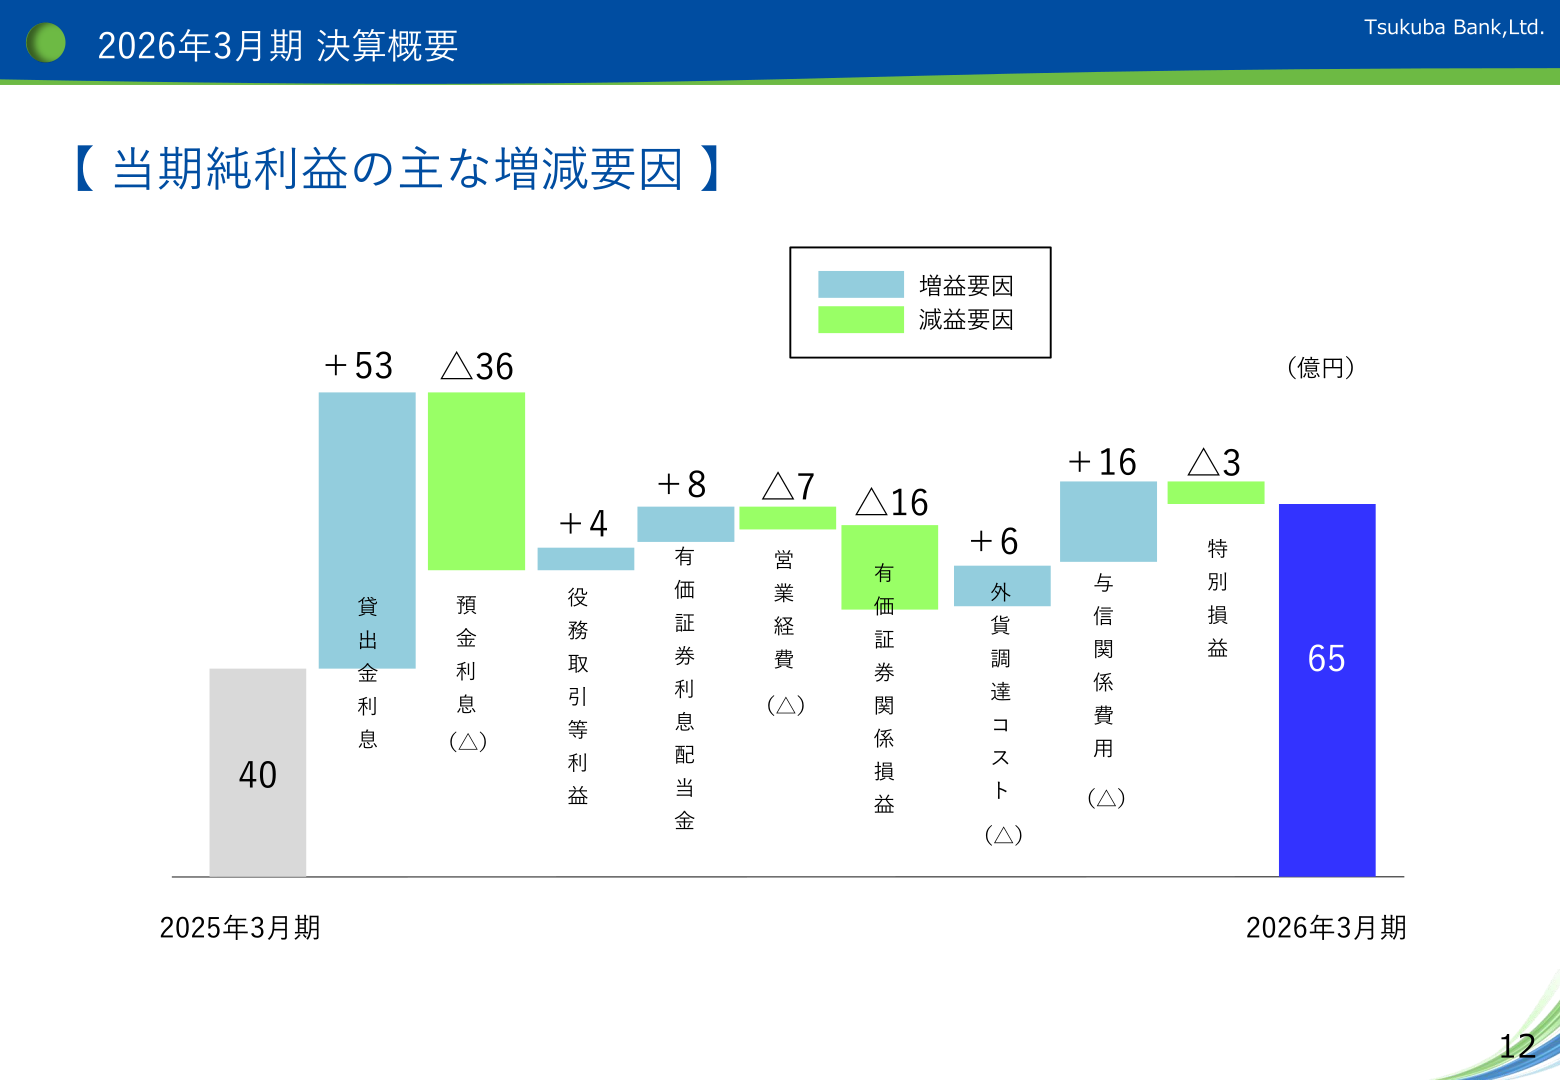
Net interest income increased to ¥28.8 billion (up ¥2.4 billion year on year) and fee and commission income increased to ¥4.5 billion (up ¥0.4 billion), both rising steadily, while other business income decreased, reflecting measures such as the sale of low-yield domestic bonds to reduce unrealized losses on securities. The increase in core business net profit reflects higher net interest income driven mainly by interest on loans, steady growth in fee and commission income, and lower foreign-currency funding costs. The increase in ordinary profit and net income reflects the increase in core business net profit together with a large decrease in individual provisions for loan losses, which brought credit-related costs down to ¥0.9 billion (down ¥1.6 billion year on year).
| Item | FY ended March 31, 2026 | Change | FY ended March 31, 2025 |
|---|---|---|---|
| Gross business profit | ¥27.8 billion | –¥0.2 billion | ¥28.0 billion |
| Net interest income | ¥28.8 billion | +¥2.4 billion | ¥26.4 billion |
| Fee and commission income | ¥4.5 billion | +¥0.4 billion | ¥4.0 billion |
| Other business income | –¥5.6 billion | –¥3.2 billion | –¥2.4 billion |
| Expenses | ¥23.8 billion | +¥0.6 billion | ¥23.2 billion |
| Core business net profit | ¥9.9 billion | +¥3.0 billion | ¥6.9 billion |
| Ordinary profit | ¥7.3 billion | +¥2.9 billion | ¥4.4 billion |
| Net income | ¥6.5 billion | +¥2.5 billion | ¥4.0 billion |
| Credit-related costs | ¥0.9 billion | –¥1.6 billion | ¥2.6 billion |
| Gains/losses related to securities | –¥2.6 billion | –¥1.6 billion | –¥0.9 billion |
Non-Consolidated and Consolidated Results
For the fiscal year ended March 31, 2026, both ordinary profit and net income exceeded the prior year on both a non-consolidated and a consolidated basis. Consolidated ordinary profit was ¥7.4 billion, and profit attributable to owners of parent was ¥6.6 billion.
| Category | Ordinary profit (FY ended March 31, 2026, Actual) | Net income (FY ended March 31, 2026, Actual) |
|---|---|---|
| Non-Consolidated | ¥7.3 billion | ¥6.5 billion |
| Consolidated | ¥7.4 billion | ¥6.6 billion (Profit attributable to owners of parent) |
Full-Year Forecast
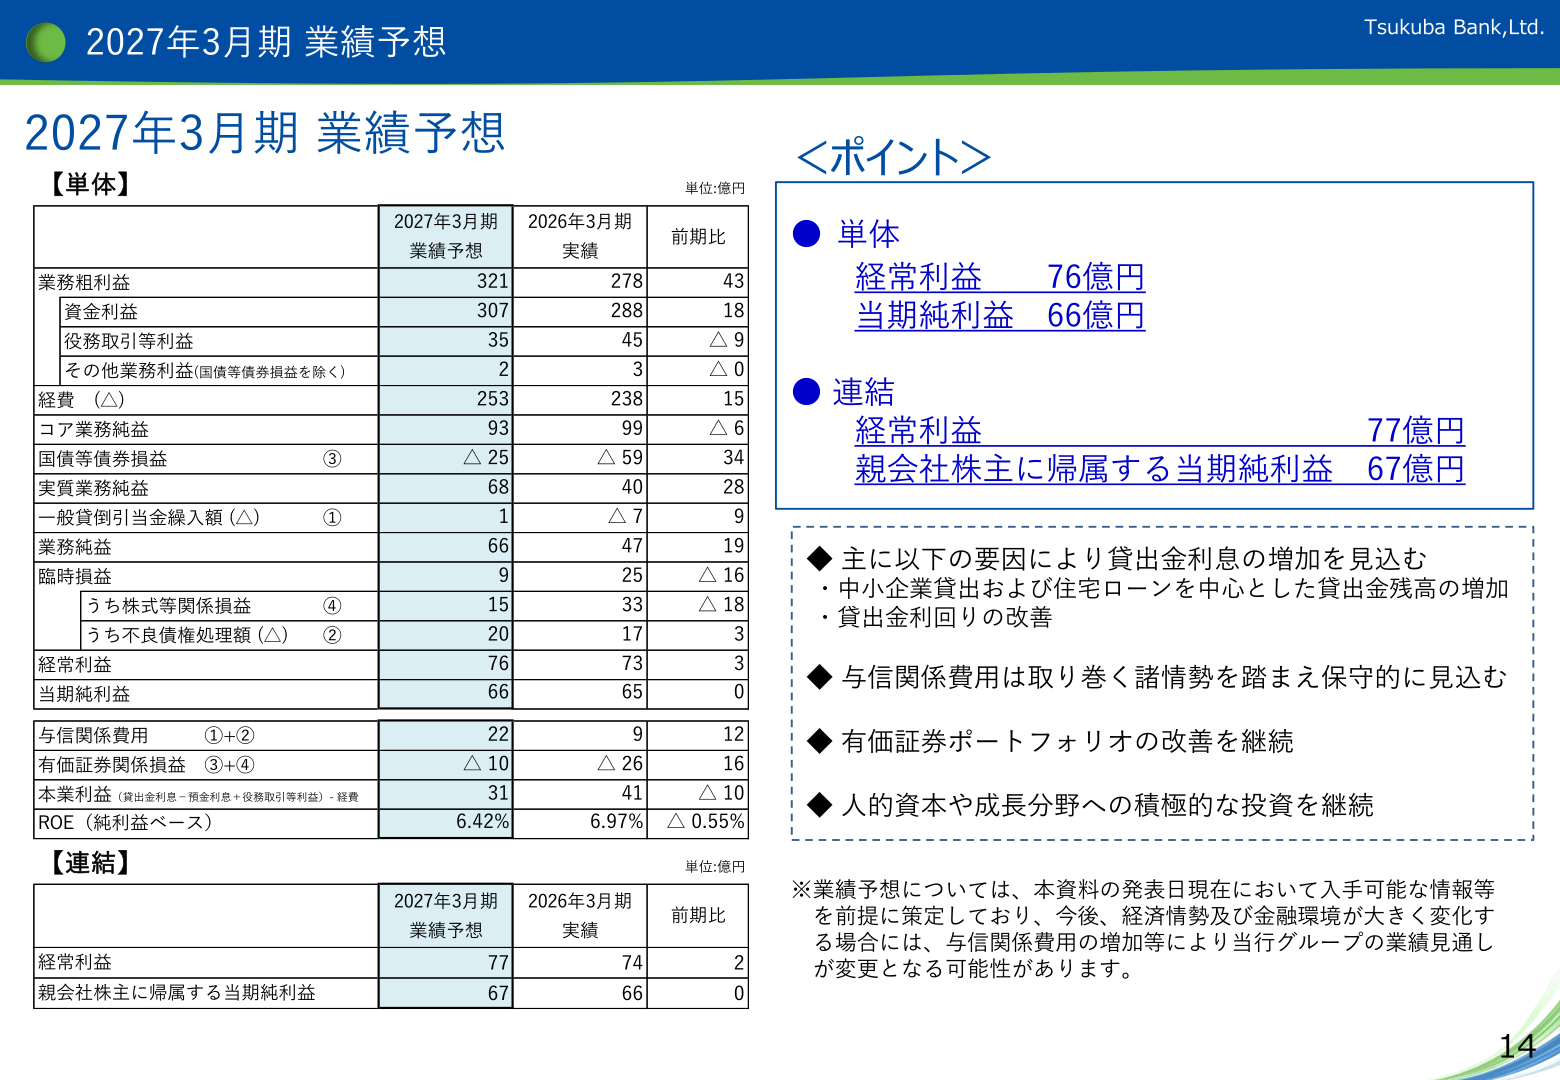
The forecast (non-consolidated) for the fiscal year ending March 31, 2027 is ordinary profit of ¥7.6 billion and net income of ¥6.6 billion. On a consolidated basis, the bank expects ordinary profit of ¥7.7 billion and profit attributable to owners of parent of ¥6.7 billion. The bank expects interest on loans to increase on higher loan balances, centered on lending to small and medium-sized enterprises and housing loans, together with an improvement in the loan yield, while credit-related costs are forecast conservatively in light of the surrounding environment.
| Item | FY ending March 31, 2027 (Forecast) | FY ended March 31, 2026 (Actual) | Change |
|---|---|---|---|
| Gross business profit | ¥32.1 billion | ¥27.8 billion | +¥4.3 billion |
| Net interest income | ¥30.7 billion | ¥28.8 billion | +¥1.8 billion |
| Fee and commission income | ¥3.5 billion | ¥4.5 billion | –¥0.9 billion |
| Expenses | ¥25.3 billion | ¥23.8 billion | +¥1.5 billion |
| Core business net profit | ¥9.3 billion | ¥9.9 billion | –¥0.6 billion |
| Ordinary profit | ¥7.6 billion | ¥7.3 billion | +¥0.3 billion |
| Net income | ¥6.6 billion | ¥6.5 billion | +¥0.0 billion |
| Credit-related costs | ¥2.2 billion | ¥0.9 billion | +¥1.2 billion |
Shareholder Returns
As its shareholder return policy, the bank states that, following repayment of public funds, it aims for a total payout ratio of around 40%, taking into account market conditions and earnings prospects while also giving consideration to building up retained earnings. The (non-consolidated) capital adequacy ratio rose 0.14 percentage points year on year to 9.51%, reflecting an increase in the amount of capital driven by the upside in net income.
Sixth Medium-Term Management Plan
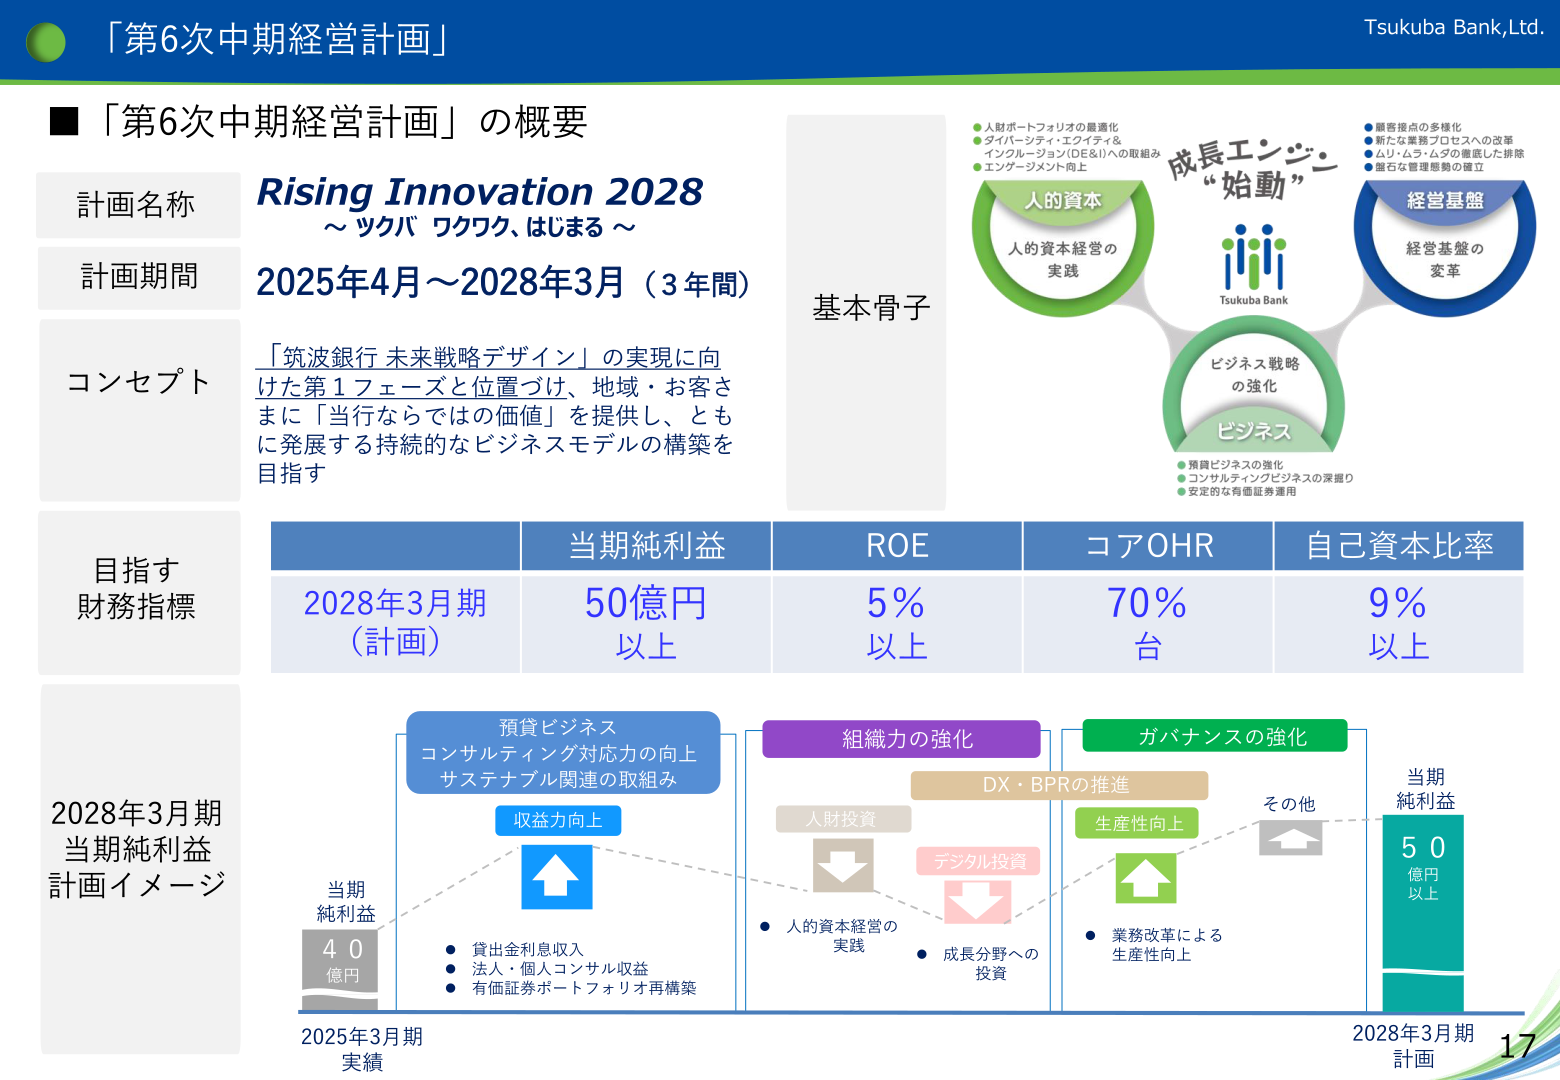
Positioned as the first phase of “Tsukuba Bank Future Strategy Design,” the Sixth Medium-Term Management Plan (“Rising Innovation 2028”) covers the three-year period from April 2025 to March 2028. The bank is targeting net income of ¥5.0 billion or more, ROE of 5% or higher, core OHR (overhead ratio) in the 70% range, and a capital adequacy ratio of 9% or higher for the fiscal year ending March 31, 2028. In the plan’s first year, the fiscal year ended March 31, 2026, core OHR improved significantly, down 6.47 percentage points year on year, on lower-than-planned expenses and improved earning power, and major KPIs progressed broadly as planned, although corporate and individual deposits fell short of plan, which remains a challenge to address from the second year onward.
| Indicator | FY ending March 31, 2028 (Plan) |
|---|---|
| Net income | ¥5.0 billion or more |
| ROE | 5% or higher |
| Core OHR | 70% range |
| Capital adequacy ratio | 9% or higher |
This article is an analysis based on publicly available information and is not a recommendation to buy or sell any specific securities. Investment decisions are your own responsibility.
















