
This article is based on publicly available IR materials and is not a recommendation to buy or sell any specific securities.
Note: The Musashino Bank does not publish an English results presentation; this article is an English translation of the Japanese-language article on our sister site Investalk, which is based on the company’s Japanese-language IR materials, with figures transcribed as reported. The company refers to the fiscal year ended March 31, 2026 simply as “the fiscal year ended March 31, 2026”; this site classifies it as FY2025.
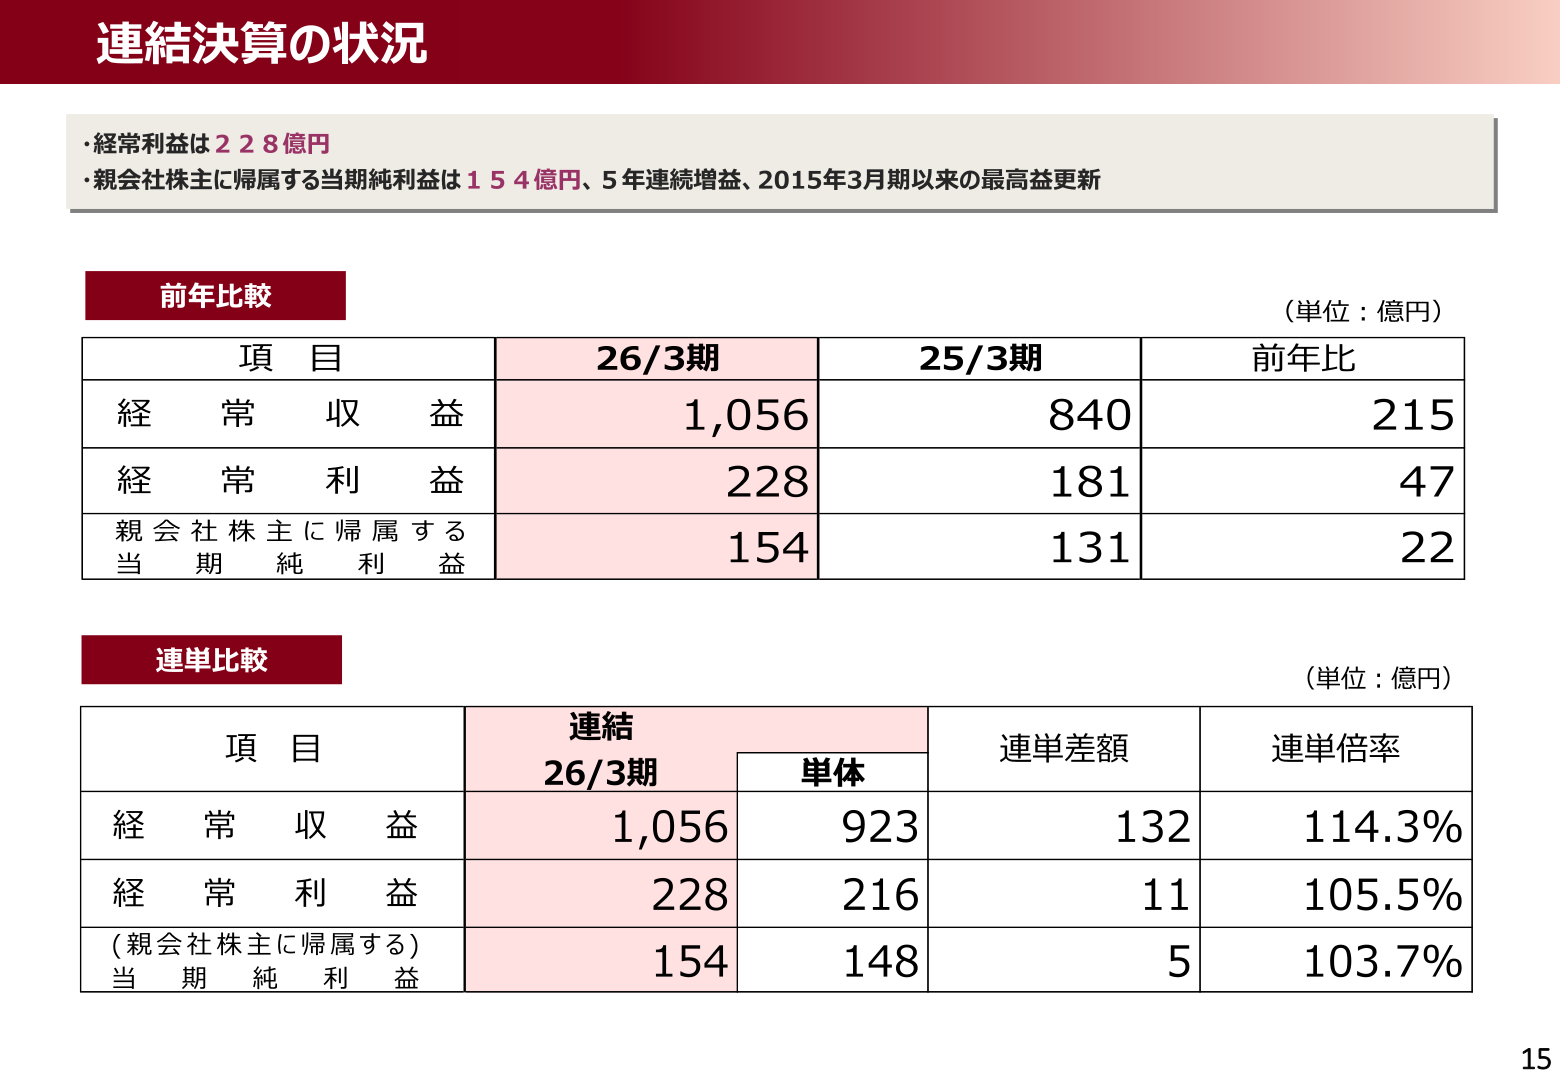
The Musashino Bank, Ltd. (stock code 8336) reported consolidated ordinary income of ¥105.6 billion (up ¥21.5 billion year on year), consolidated ordinary profit of ¥22.8 billion (up ¥4.7 billion) and profit attributable to owners of parent of ¥15.4 billion (up ¥2.2 billion) for the fiscal year ended March 31, 2026. The materials state that “net interest income grew on steady expansion of the loan and deposit volume and rising interest rates from interest-rate repricing” and that “fee and commission income also remained at a high level thanks to increased focus on consulting for corporate and individual customers.” Profit attributable to owners of parent increased for a fifth consecutive year, renewing the record last set in the fiscal year ended March 2015. The bank also launched its new medium-term management plan “MCP 2/3,” covering the four-year period from April 2026 to March 2030.
Results (FY2025 Actual)
On a non-consolidated basis, ordinary income was ¥92.3 billion, ordinary profit was ¥21.6 billion (up ¥4.5 billion year on year) and net income was ¥14.8 billion (up ¥2.0 billion), with non-consolidated net income increasing for a seventh consecutive year and renewing its record high for a second consecutive year. Comparing consolidated and non-consolidated results, ordinary income showed a consolidated-minus-non-consolidated difference of ¥13.2 billion (consolidated-to-non-consolidated ratio of 114.3%), ordinary profit showed a difference of ¥1.1 billion (105.5%), and profit attributable to owners of parent showed a difference of ¥0.5 billion (103.7%).
| Item | FY2025 (Actual) | FY2024 (Actual) | YoY Change |
|---|---|---|---|
| Ordinary income (Consolidated) | ¥105.6 billion | ¥84.0 billion | +¥21.5 billion |
| Ordinary profit (Consolidated) | ¥22.8 billion | ¥18.1 billion | +¥4.7 billion |
| Profit attributable to owners of parent (Consolidated) | ¥15.4 billion | ¥13.1 billion | +¥2.2 billion |
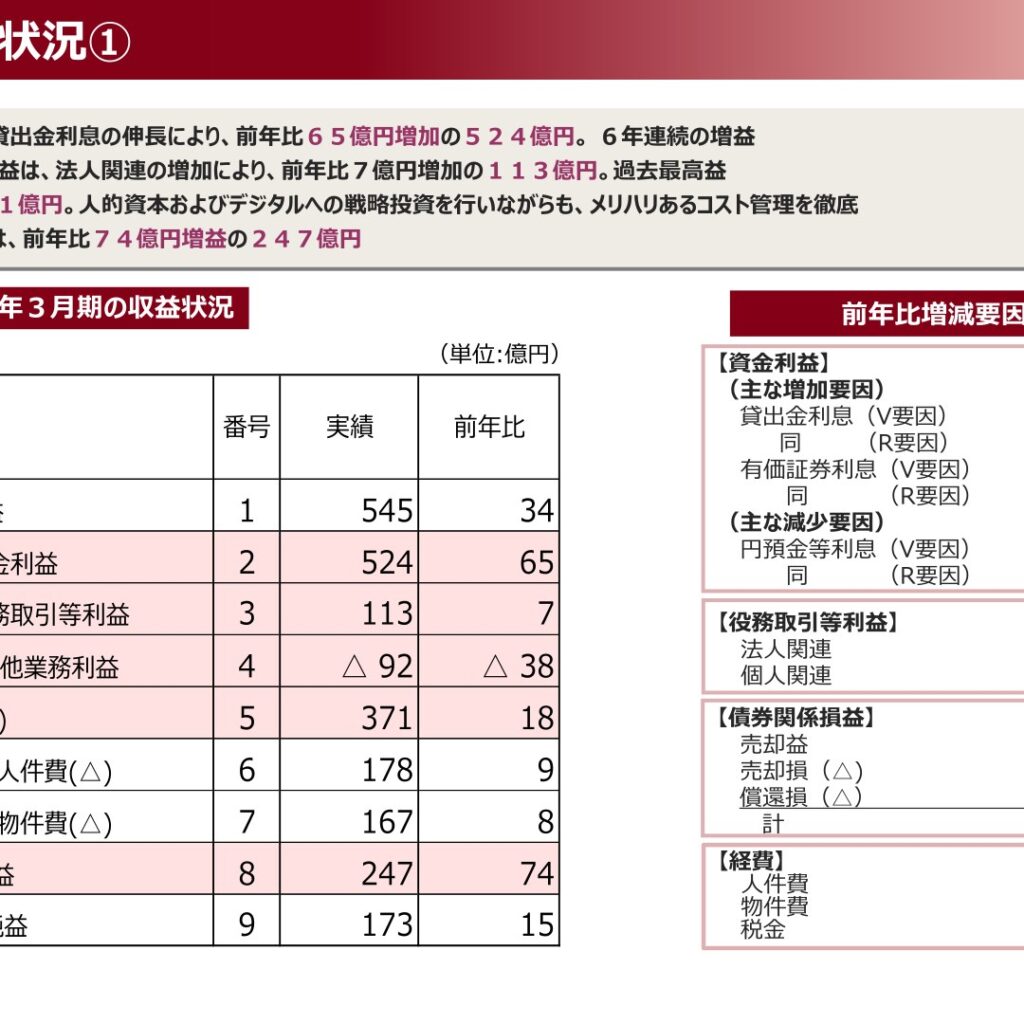
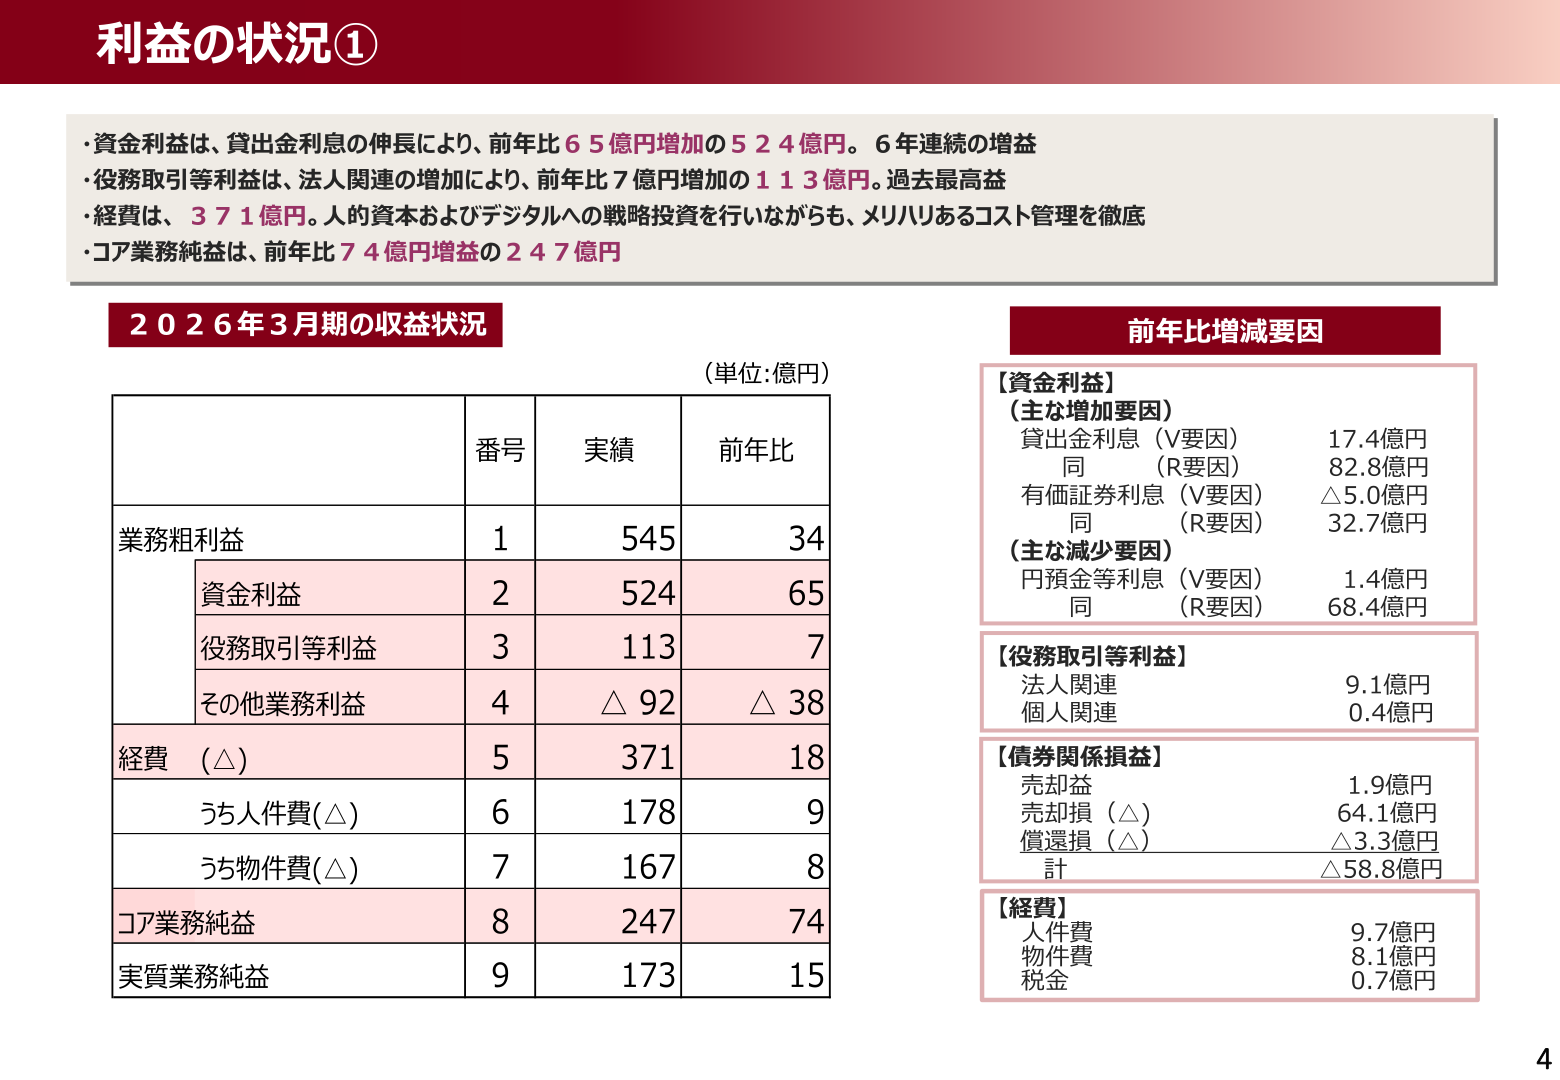
On the non-consolidated revenue side, net interest income increased ¥6.5 billion year on year to ¥52.4 billion on growth in interest on loans (a sixth consecutive year of increase), and fee and commission income increased ¥0.7 billion to ¥11.3 billion on higher income from corporate clients (a record high). Expenses were ¥37.1 billion (up ¥1.8 billion), which the bank says reflects thorough, disciplined cost management even while making strategic investments in human capital and digitalization. As a result, core business profit increased ¥7.4 billion year on year to ¥24.7 billion. Credit-related costs increased ¥2.4 billion year on year to ¥3.9 billion, reflecting a precautionary increase in the general allowance for loan losses, while stock-related gains/losses increased ¥5.8 billion year on year to ¥7.1 billion on the reduction of cross-shareholdings.
| Item | FY2025 (Actual, Non-Consolidated) | YoY Change |
|---|---|---|
| Gross business profit | ¥54.5 billion | +¥3.4 billion |
| Net interest income | ¥52.4 billion | +¥6.5 billion |
| Fee and commission income | ¥11.3 billion | +¥0.7 billion |
| Other business income | –¥9.2 billion | –¥3.8 billion |
| Expenses | ¥37.1 billion | +¥1.8 billion |
| Of which, personnel expenses | ¥17.8 billion | +¥0.9 billion |
| Of which, non-personnel expenses | ¥16.7 billion | +¥0.8 billion |
| Core business profit | ¥24.7 billion | +¥7.4 billion |
| Real net business profit | ¥17.3 billion | +¥1.5 billion |
| Credit-related costs (–) | ¥3.9 billion | +¥2.4 billion |
| Stock-related gains/losses | ¥7.1 billion | +¥5.8 billion |
| Ordinary profit | ¥21.6 billion | +¥4.5 billion |
| Net income | ¥14.8 billion | +¥2.0 billion |
Loans and Deposits
The loan balance grew across both business and non-business loans, increasing ¥194.9 billion year on year (an annualized rate of 4.7%) to ¥4,321.3 billion. The breakdown was business loans of ¥2,388.4 billion, non-business loans of ¥1,694.6 billion, and loans to local governments and other public entities of ¥218.2 billion. Deposits and similar balances maintained an uptrend among both individual and corporate customers, increasing ¥111.3 billion year on year (an annualized rate of 2.1%) to ¥5,204.9 billion, while assets in custody increased ¥121.2 billion year on year (an annualized rate of 16.8%) to ¥843.2 billion. The non-performing loan ratio was 1.5%, flat versus the prior fiscal year; the materials state that “the balance of non-performing loans continues to decline, and with the non-performing loan ratio remaining at a low level, the soundness of the loan portfolio is being adequately maintained.” The credit cost ratio was 9.5 basis points, which the materials describe as “still at a low level, with no sign of a sharp increase.” The capital adequacy ratio (consolidated, final Basel III basis) was 13.41%, against a target adequacy level of around 10.5%. The bank reduced its cross-shareholdings by 18 issues in FY2025, bringing the market value of cross-shareholdings as a proportion of consolidated net assets to 17.0% (target: below 15%).
FY2026 Forecast
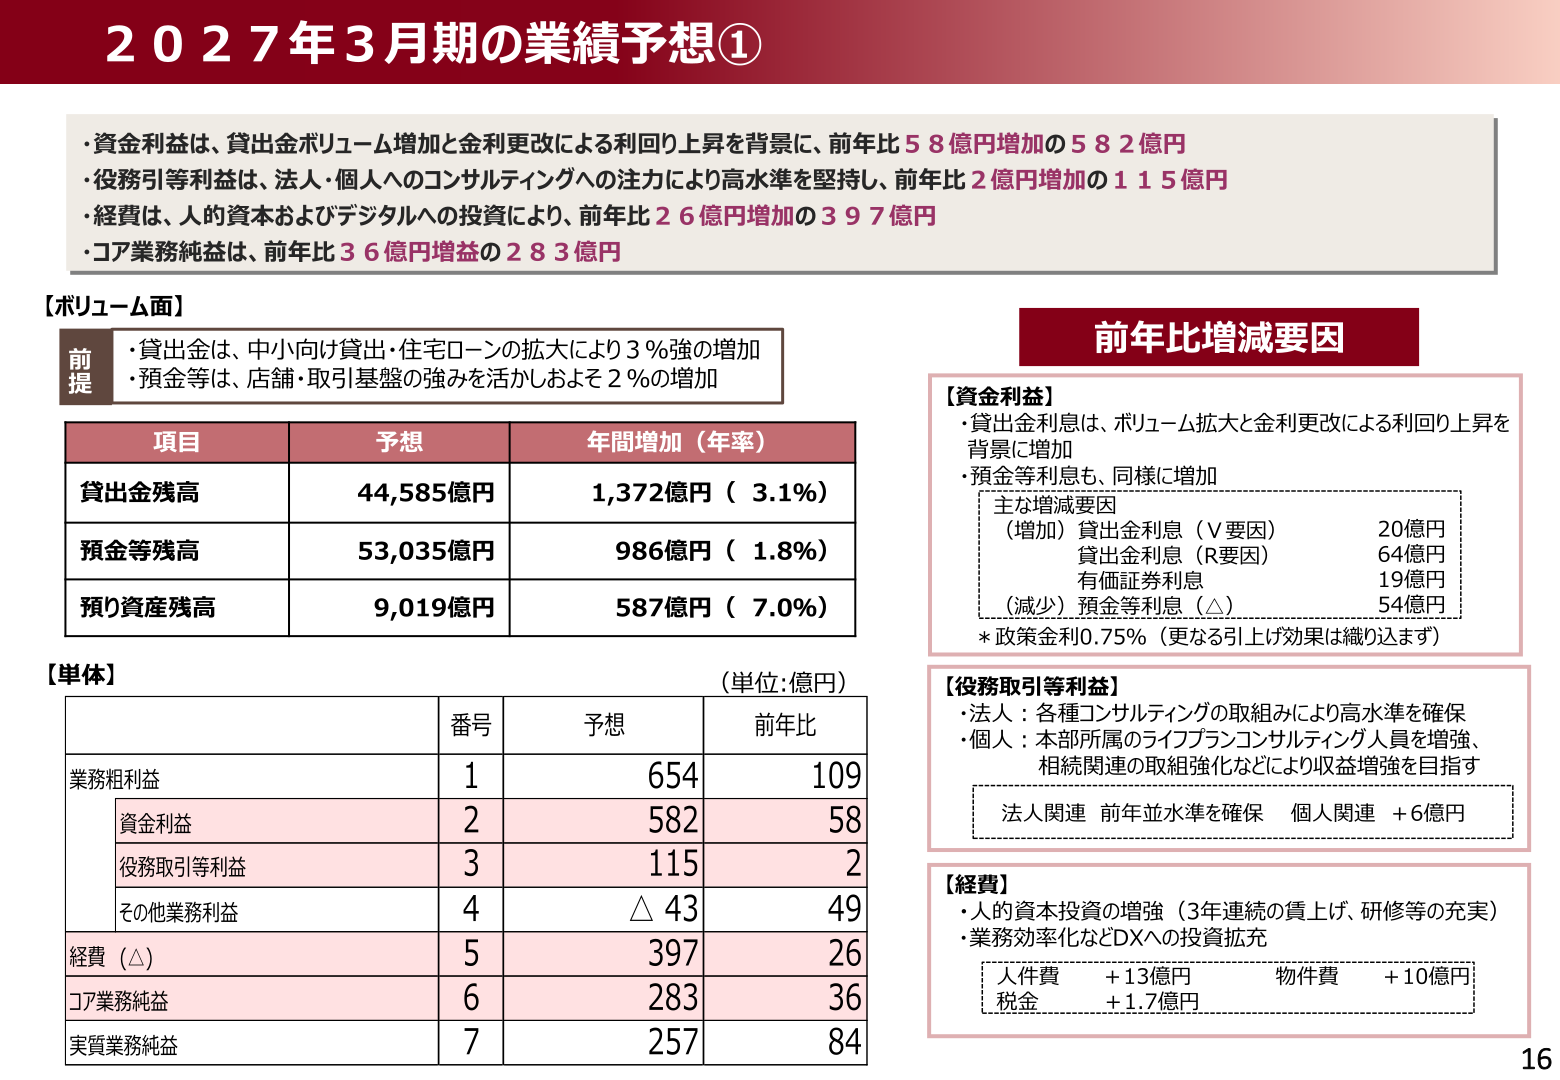
For the fiscal year ending March 31, 2027, on a non-consolidated basis the bank expects net interest income of ¥58.2 billion (up ¥5.8 billion year on year), fee and commission income of ¥11.5 billion (up ¥0.2 billion), expenses of ¥39.7 billion (up ¥2.6 billion), core business profit of ¥28.3 billion (up ¥3.6 billion), ordinary profit of ¥27.6 billion (up ¥6.0 billion, a seventh consecutive year of increase) and net income of ¥19.0 billion (up ¥4.2 billion, an eighth consecutive year of increase and a new record). On a consolidated basis, the bank forecasts ordinary profit of ¥28.7 billion (up ¥5.9 billion) and profit attributable to owners of parent of ¥19.5 billion (up ¥4.1 billion). In terms of volume, the bank expects a loan balance of ¥4,458.5 billion (up ¥137.2 billion for the year, an annualized rate of 3.1%), deposits and similar balances of ¥5,303.5 billion (up ¥98.6 billion, an annualized rate of 1.8%), and assets in custody of ¥901.9 billion (up ¥58.7 billion, an annualized rate of 7.0%). The forecast assumes a policy interest rate of 0.75% and does not factor in the effect of any further rate hikes.
| Item | FY2026 Forecast | FY2025 (Actual) YoY Change |
|---|---|---|
| Gross business profit (Non-Consolidated) | ¥65.4 billion | +¥10.9 billion |
| Net interest income (Non-Consolidated) | ¥58.2 billion | +¥5.8 billion |
| Fee and commission income (Non-Consolidated) | ¥11.5 billion | +¥0.2 billion |
| Expenses (Non-Consolidated) | ¥39.7 billion | +¥2.6 billion |
| Core business profit (Non-Consolidated) | ¥28.3 billion | +¥3.6 billion |
| Ordinary profit (Non-Consolidated) | ¥27.6 billion | +¥6.0 billion |
| Net income (Non-Consolidated) | ¥19.0 billion | +¥4.2 billion |
| Ordinary profit (Consolidated) | ¥28.7 billion | +¥5.9 billion |
| Profit attributable to owners of parent (Consolidated) | ¥19.5 billion | +¥4.1 billion |
Shareholder Returns
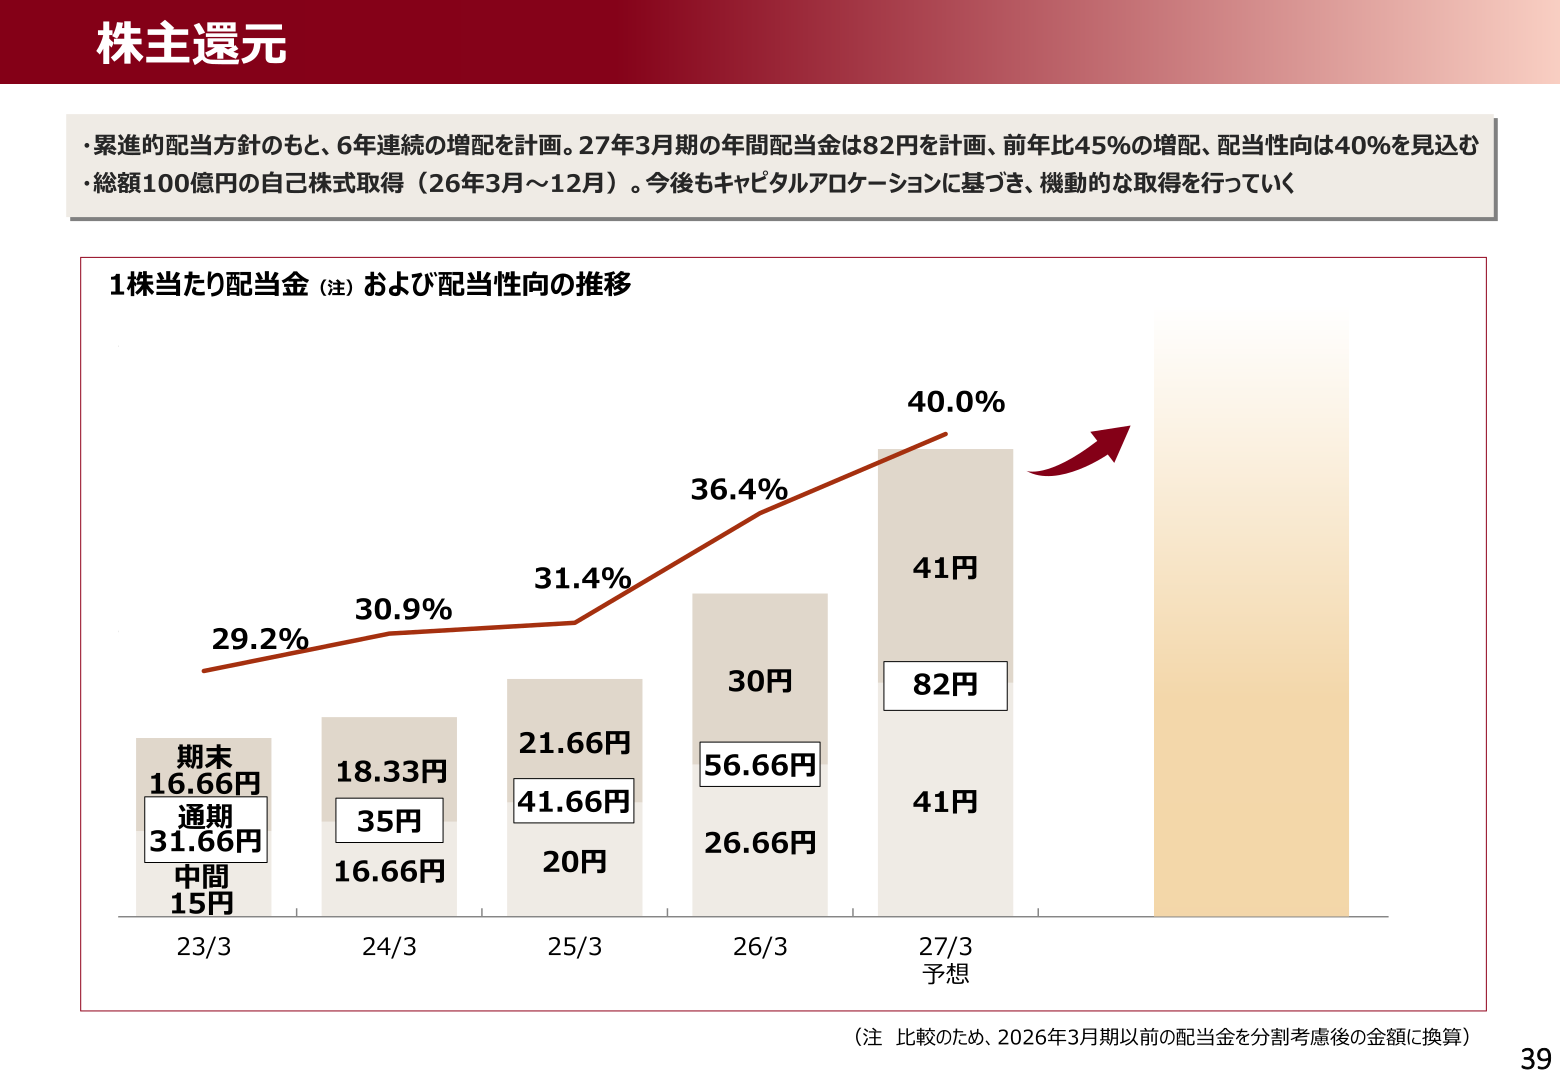
Under its progressive dividend policy, the bank plans a sixth consecutive year of dividend increases: the annual dividend for the fiscal year ending March 2027 is planned at ¥82.00 per share (a 45% increase year on year), with a payout ratio of 40.0% expected. The FY2025 (year ended March 2026) actual annual dividend was ¥56.66 (interim ¥26.66, year-end ¥30.00), with a payout ratio of 36.4%. Per a note in the materials, dividend figures for the fiscal year ended March 2026 and earlier are shown converted to reflect the stock split, for comparability. The bank also carried out a share repurchase of up to ¥10.0 billion in total from March to December 2026, and states that it will continue to conduct flexible repurchases going forward based on its capital allocation policy. As part of its efforts to broaden its shareholder base, the bank introduced a shareholder benefit program following its three-for-one stock split.
| Item | FYE March 2023 | FYE March 2024 | FYE March 2025 | FYE March 2026 | FYE March 2027 (Forecast) |
|---|---|---|---|---|---|
| Interim dividend (yen) | 15.00 | 16.66 | 20.00 | 26.66 | 41.00 |
| Year-end dividend (yen) | 16.66 | 18.33 | 21.66 | 30.00 | 41.00 |
| Annual dividend (yen) | 31.66 | 35.00 | 41.66 | 56.66 | 82.00 |
| Payout ratio (%) | 29.2 | 30.9 | 31.4 | 36.4 | 40.0 |
Medium-Term Management Plan “MCP 2/3”
The new medium-term management plan “MCP 2/3,” covering the four-year period from April 2026 to March 2030, sets out three fundamental strategies: Fundamental Strategy I, “Deepening into value co-creation consulting”; Fundamental Strategy II, “Contributing to creating new value in Saitama”; and Fundamental Strategy III, “Strengthening the management foundation that supports the future.” As management targets to be achieved by the end of the plan (in four years), the bank has set consolidated ROE of 10% or higher, profit attributable to owners of parent of ¥30.0 billion or more, core business profit of ¥40.0 billion or more, and non-consolidated core OHR (overhead ratio) of 55% or below. On the previous medium-term management plan, “MCP 1/3” (fiscal year ended March 2023 through fiscal year ended March 2026), the materials state that “results exceeded targets on every management indicator”: core business profit rose from ¥15.2 billion to ¥24.7 billion (against a target of ¥20.0 billion), profit attributable to owners of parent rose from ¥10.8 billion to ¥15.4 billion (against a target of ¥13.0 billion), consolidated ROE rose from 4.31% to 5.62% (against a target of 4.5%), and consolidated core OHR improved from 70.29% to 61.36% (against a target of 65%). [Note: this site has corrected the starting-point ROE figure for the MCP 1/3 review from Investalk’s reported 3.60% to 4.31%, matching the fiscal year ended March 2023 starting value shown on the corresponding “Review of MCP 1/3” page of the underlying Japanese-language presentation material; 3.60% is the value for the fiscal year ended March 2022, one year before MCP 1/3 began, taken from a separate five-year ROE/PBR trend chart elsewhere in the same document.] ROE for the fiscal year ended March 2026 was 5.62%, and the bank expects to reach 7% in the fiscal year ending March 2027. EPS was ¥155.41 (fiscal year ended March 2026) and is expected to reach ¥204.63 (fiscal year ending March 2027), with PER at 13.4x (fiscal year ended March 2026). PBR stood at 0.73x at the end of the fiscal year ended March 2026, and the bank states that it was at approximately 0.9x at the time the materials were prepared, with the aim of achieving 1x or above at an early date.
This article is an analysis based on publicly available information and is not a recommendation to buy or sell any specific securities. Investment decisions are your own responsibility.
















