
This article is based on publicly available IR materials and is not a recommendation to buy or sell any specific securities.
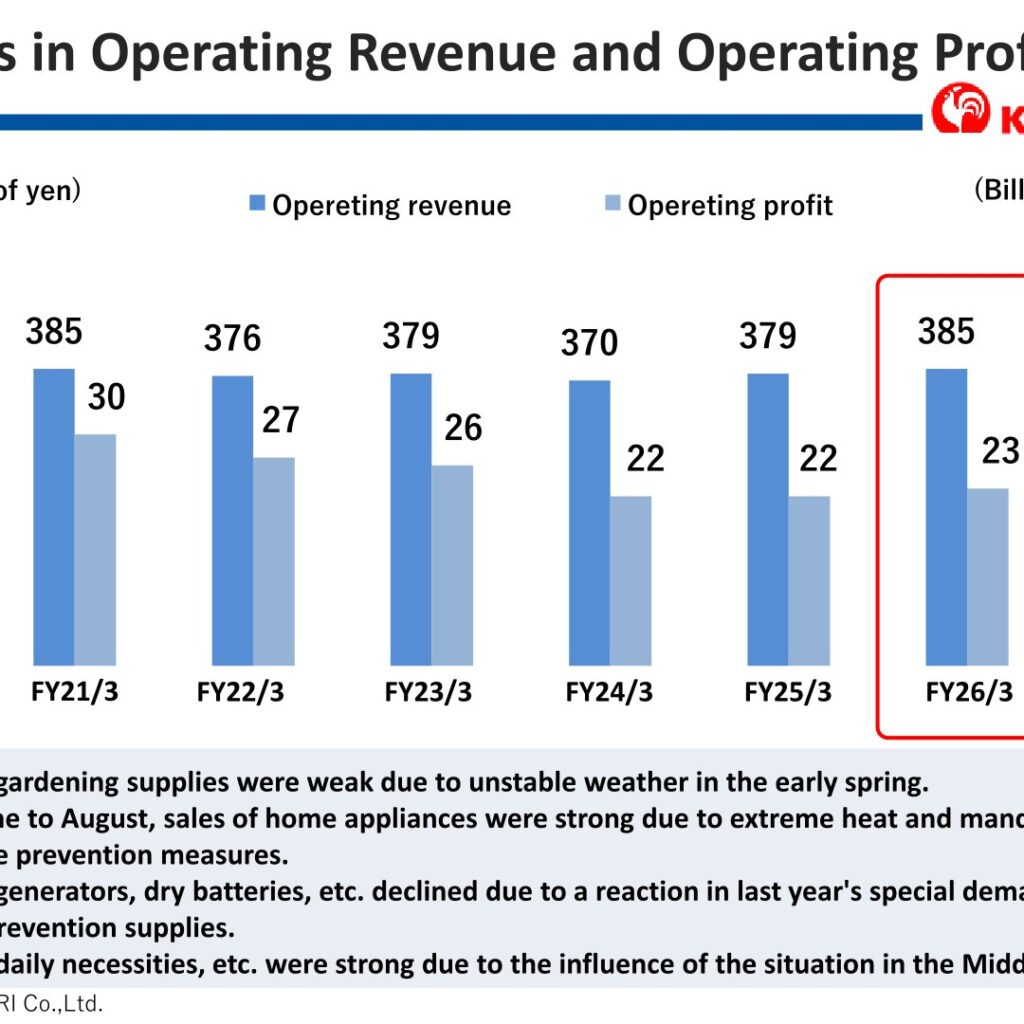
KOMERI CO., LTD. (TSE Prime: 8218) reported consolidated results for the fiscal year ended March 31, 2026 (the company’s own “FY26/3”) showing higher revenue and profit across the board. Operating revenue was ¥385,384 million (101.6% of the prior year), operating profit was ¥23,055 million (102.9% of the prior year), ordinary profit was ¥23,395 million (105.2% of the prior year), and profit attributable to owners of parent was ¥14,645 million (106.7% of the prior year). The company plans to raise its annual dividend for an 11th consecutive period. Note: Komeri labels this fiscal year “FY26/3” rather than “FY2025”; the figures, tables and labels below follow the company’s own presentation as reported.
Consolidated Results (Full-Year Actual)
For the fiscal year ended March 31, 2026, gross profit was ¥133,129 million, or 102.3% of the prior year (34.5% of operating revenue), while selling, general and administrative expenses were ¥110,073 million, or 102.1% of the prior year (28.6% of operating revenue).
| Item | FY26/3 Actual (¥ million) | % of Operating Revenue | YoY |
|---|---|---|---|
| Operating revenue | 385,384 | 100.0% | 101.6% |
| Gross profit | 133,129 | 34.5% | 102.3% |
| Selling, general and administrative expenses | 110,073 | 28.6% | 102.1% |
| Operating profit | 23,055 | 6.0% | 102.9% |
| Ordinary profit | 23,395 | 6.1% | 105.2% |
| Profit attributable to owners of parent | 14,645 | 3.8% | 106.7% |
Analysis of Changes in Operating Profit
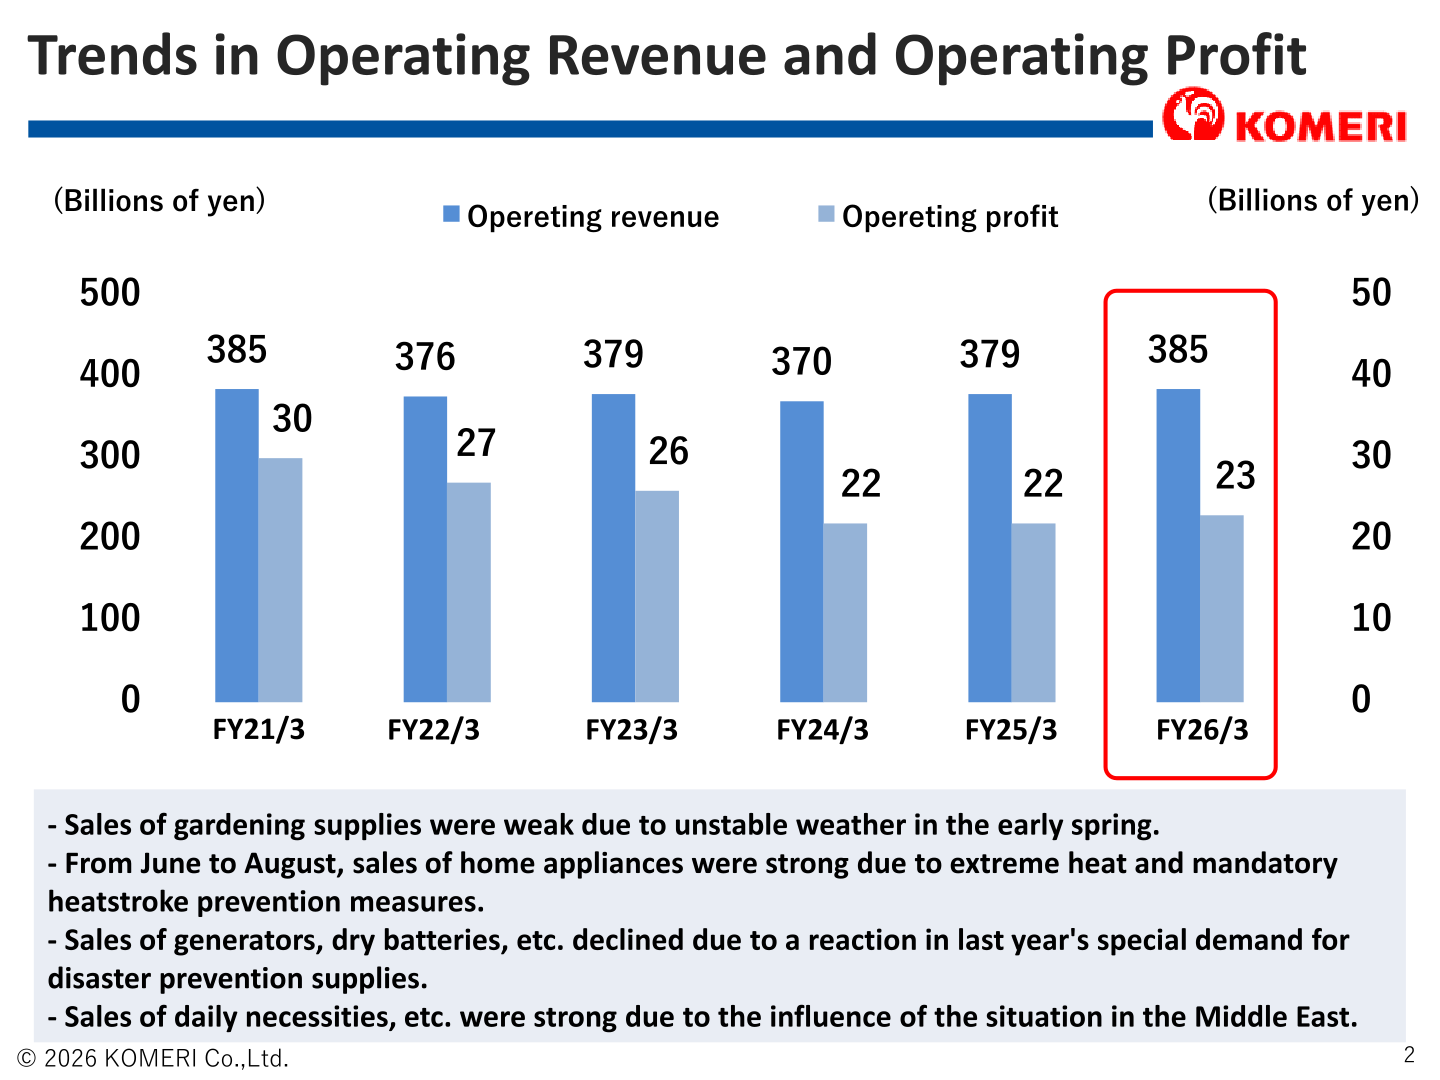
Operating profit increased from ¥22,396 million in FY25/3 to ¥23,055 million in FY26/3. The bridge shows a ¥2,122 million positive contribution from the increase in net sales (driven by strong sales of agricultural materials and net sales growth from new stores and store-format changes) and an ¥824 million positive contribution from the change in gross margin (+0.2 percentage points, reflecting strong PB product sales and the impact of exchange rates), partly offset by ¥542 million in higher personnel expenses (higher unit labor costs from wage increases and the promotion of new store operations) and ¥1,745 million in higher selling, facility and other expenses (higher rent from new store openings, large-scale repairs to distribution centers and planned store repairs, and the introduction of new in-store terminals).
Segment Results: Product Category and Store Format
By product category, Gardening, agriculture, and pet supplies net sales were 103.3% of the prior year at ¥116,313 million and Tools, hardware and working supplies were 101.8% of the prior year at ¥69,840 million, supported by steady demand from construction professionals for work sheets and electrical materials. Remodeling and exterior materials were 100.9% of the prior year at ¥55,705 million as market unit prices for plywood and other materials declined, Interior goods, household goods, and office supplies were 98.8% of the prior year at ¥33,704 million on weak sales of durable consumer goods such as carpets, and Fuel, etc. was 97.3% of the prior year at ¥14,998 million. Home Center business total net sales were ¥380,916 million, or 101.7% of the prior year. By store format, the PRO format (professional-oriented stores) posted the strongest growth, with total sales at 123.8% of the prior year (same-store sales at 107.3%), supported by consumable materials sales and heat-stroke-prevention clothing with fans; the Power format’s total sales were 103.3% of the prior year (same-store sales at 101.2%) on strong sales of summer-related products such as air conditioning equipment; and the Hard & Green format was largely flat at 100.0% of the prior year (same-store sales at 99.8%), affected by weak kerosene sales.
| Product Category | Net Sales (¥ million) | YoY | % of Operating Revenue | Gross Margin | YoY Change (pt) |
|---|---|---|---|---|---|
| Tools, hardware and working supplies | 69,840 | 101.8% | 18.1% | 42.5% | (0.2) |
| Remodeling and exterior materials | 55,705 | 100.9% | 14.5% | 29.2% | +0.1 |
| Gardening, agriculture, and pet supplies | 116,313 | 103.3% | 30.2% | 30.9% | +0.3 |
| Commodities, home appliances, car supplies, and leisure goods | 75,523 | 101.4% | 19.6% | 26.0% | +0.4 |
| Interior goods, household goods, and office supplies | 33,704 | 98.8% | 8.7% | 39.9% | (0.2) |
| Fuel, etc. | 14,998 | 97.3% | 3.9% | 13.2% | ±0.0 |
| Other | 14,829 | 105.2% | 3.8% | 100.0% | +1.6 |
| Home Center business total | 380,916 | 101.7% | 98.8% | 34.6% | +0.2 |
| Store Format | FY25/3 Total Sales (YoY) | FY25/3 Same-Store Sales (YoY) | FY26/3 Total Sales (YoY) | FY26/3 Same-Store Sales (YoY) |
|---|---|---|---|---|
| Power | 103.0% | 101.1% | 103.3% | 101.2% |
| PRO | 143.6% | 106.1% | 123.8% | 107.3% |
| Hard & Green | 101.2% | 100.8% | 100.0% | 99.8% |
| Total | 102.3% | 101.0% | 101.6% | 100.5% |
Capital Investment and Store Network
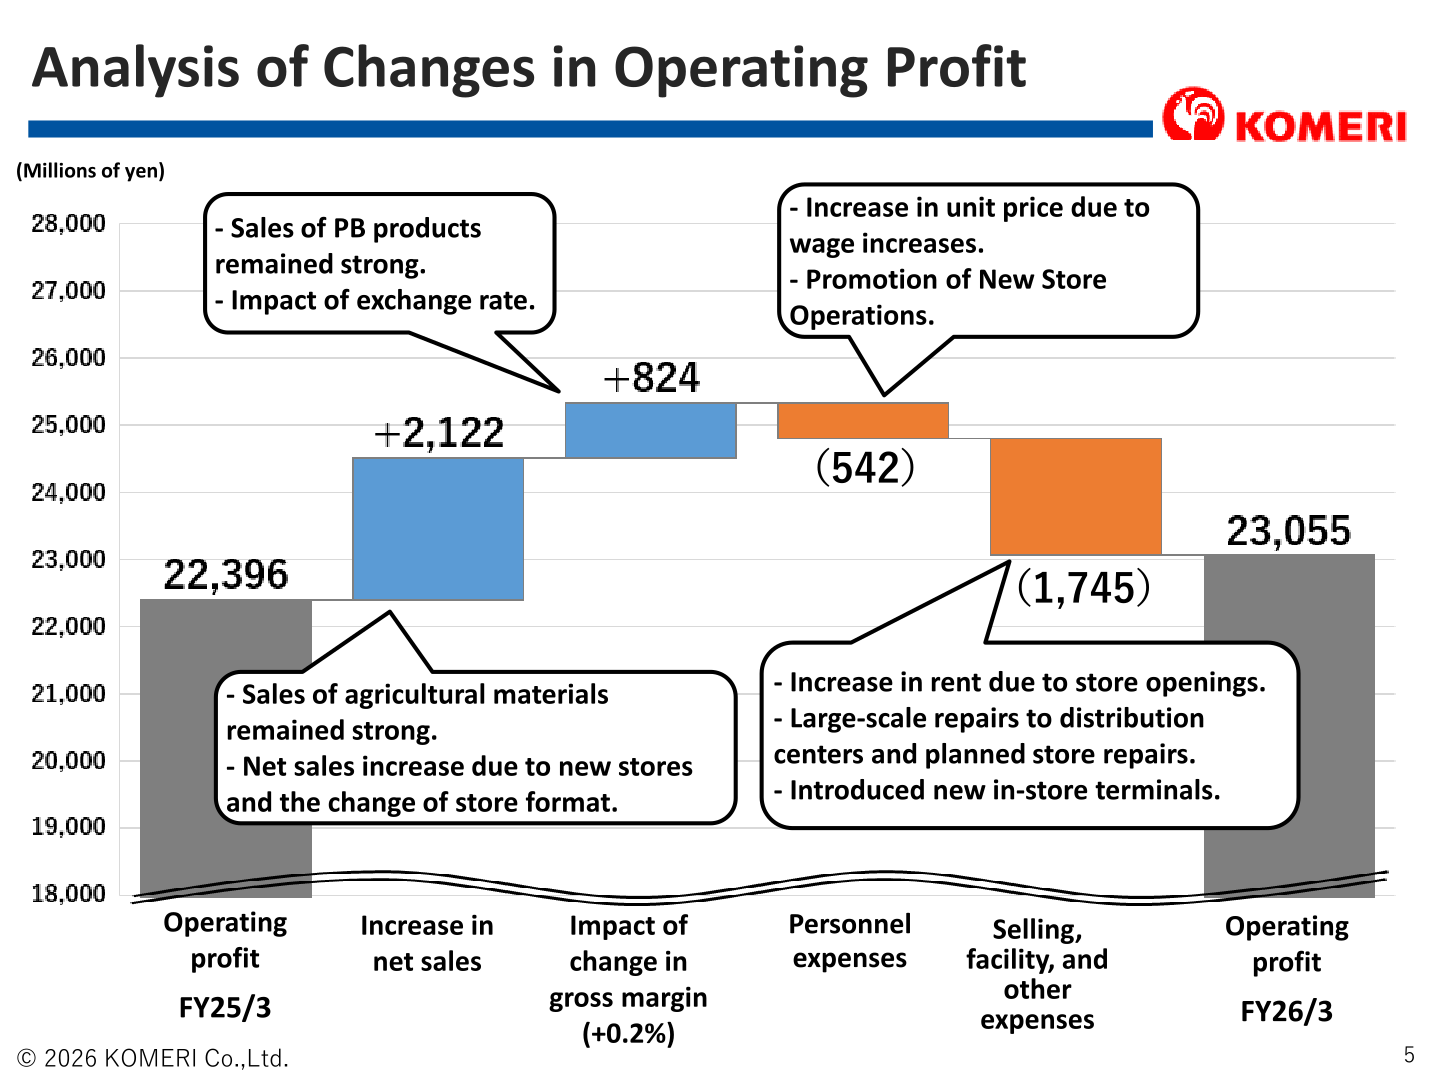
Total capital investment for FY26/3 was ¥25,000 million, against a plan of ¥30,000 million. This comprised ¥10,400 million for the opening of 22 new stores (against a plan of 35 stores and ¥13,000 million), ¥2,100 million for remodeling 142 existing stores covering 305,626 square meters, ¥10,400 million for logistics centers, including the start of operations at the New Kansai Logistics Center, ¥1,900 million for IT systems and other investments, and ¥200 million for green investment (two Power-format stores and two centers). For FY27/3, the company plans total capital investment of ¥22,000 million, comprising ¥14,000 million for 42 new stores, ¥3,000 million for remodeling approximately 140 stores (approximately 330,000 square meters), ¥1,000 million for expansion of existing logistics centers, ¥2,000 million for IT systems, and ¥2,000 million for green investment. Store remodeling in FY26/3 lifted net sales at remodeled stores by approximately 5.2%, and total sales floor area rose to 101.8% of the prior fiscal year-end level.
FY2026 Forecast
For FY27/3 (the fiscal year ending March 31, 2027), the company forecasts operating revenue of ¥400,800 million, or 104.0% of FY26/3, operating profit of ¥24,000 million (104.1%), ordinary profit of ¥23,900 million (102.2%), and profit attributable to owners of parent of ¥15,000 million (102.4%). For the first half of FY27/3, the company forecasts operating revenue of ¥209,500 million (104.1% of the prior-year first half), operating profit of ¥16,400 million (106.8%), ordinary profit of ¥16,350 million (104.8%), and profit attributable to owners of parent of ¥11,000 million (106.2%). Note: in the source presentation’s forecast table, both the operating-revenue row and the operating-profit row are printed with the same row label (“Operating incomes”); the labels below have been corrected to “Operating revenue” and “Operating profit” respectively, based on the figures matching the consolidated results table on P.1 of the same presentation, which uses those distinct labels for the identical values. No figures have been changed.
| Item | FY26/3 Actual (¥ million) | YoY | 1H FY27/3 Forecast (¥ million) | YoY | FY27/3 Full-Year Forecast (¥ million) | YoY |
|---|---|---|---|---|---|---|
| Operating revenue | 385,384 | 101.6% | 209,500 | 104.1% | 400,800 | 104.0% |
| Operating profit | 23,055 | 102.9% | 16,400 | 106.8% | 24,000 | 104.1% |
| Ordinary profit | 23,395 | 105.2% | 16,350 | 104.8% | 23,900 | 102.2% |
| Profit attributable to owners of parent | 14,645 | 106.7% | 11,000 | 106.2% | 15,000 | 102.4% |
| Distribution (dividend per share) | Interim: ¥28 / Year-end: ¥28 | +¥2 | Interim: ¥29 | +¥1 | Year-end: ¥29 | +¥1 |
Shareholder Returns
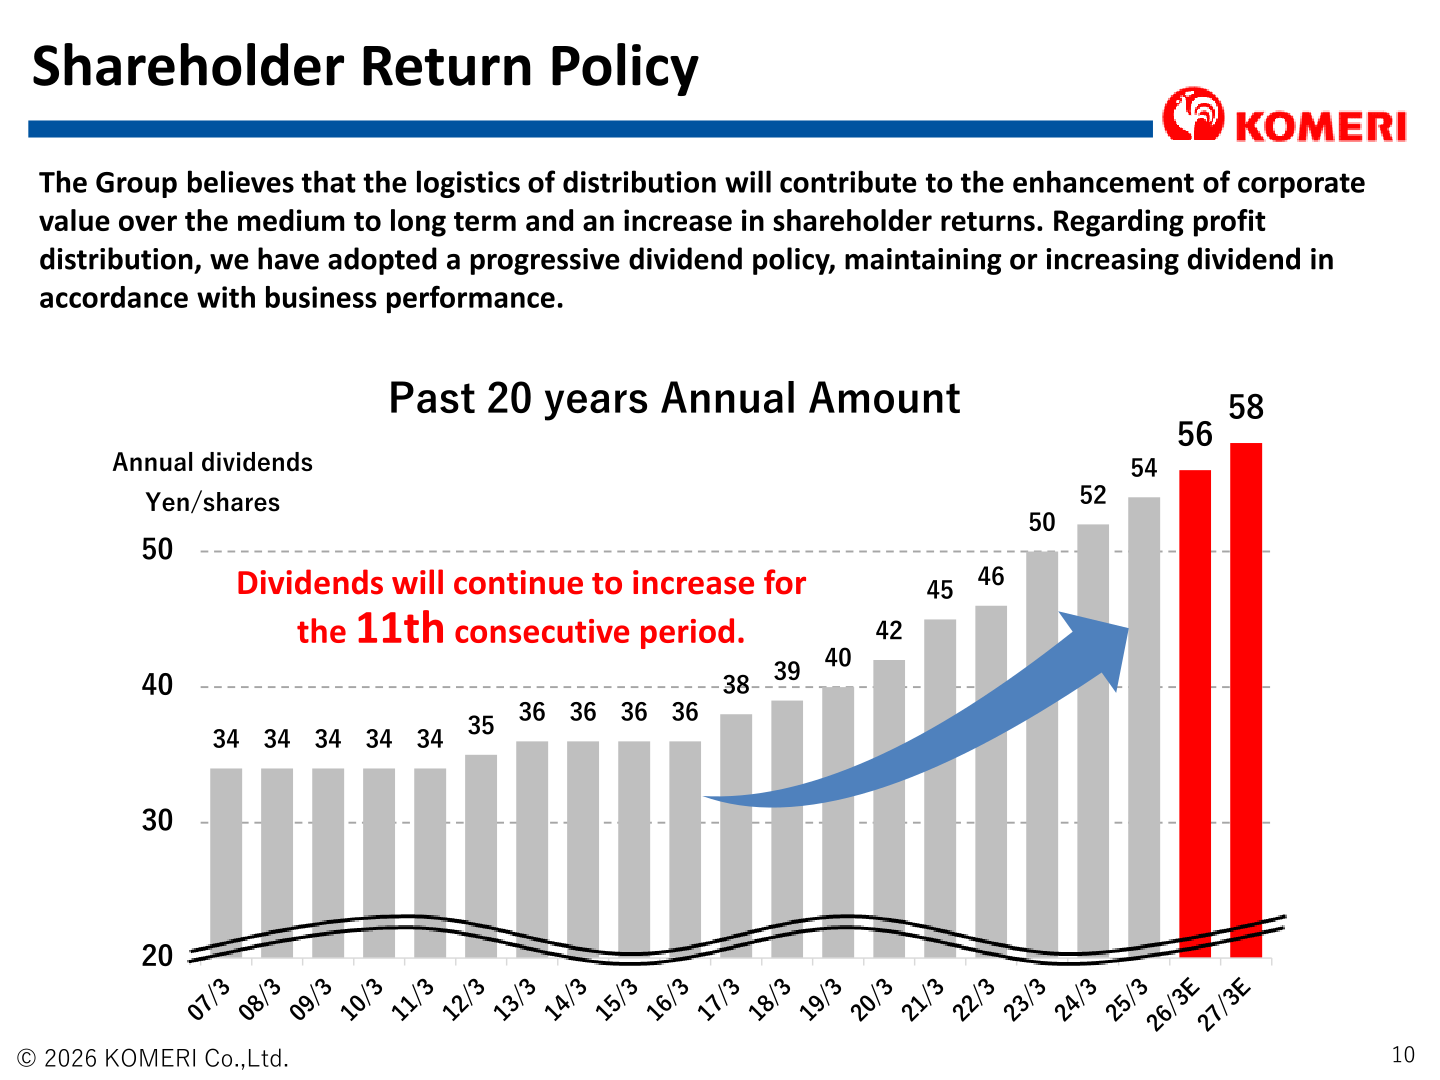
Komeri Group’s basic policy is to maintain or increase dividends in line with business performance under a progressive dividend policy, believing that modernizing distribution in the home and living sector will contribute to enhancing corporate value and increasing shareholder returns over the medium to long term. For FY26/3, the interim dividend was ¥28 per share and the year-end dividend was ¥28 per share, for an annual total of ¥56 per share. For FY27/3, the company plans an interim dividend of ¥29 per share and a year-end dividend of ¥29 per share, for a planned annual total of ¥58 per share. This would mark the 11th consecutive fiscal year of dividend increases.
Medium-Term Strategy Topics
The presentation frames Komeri’s growth opportunity as a combined ¥7 trillion market spanning the ¥4 trillion home center market and the ¥5 trillion hardware, building materials, gardening and agricultural supplies market (with an overlap of approximately ¥2 trillion), within which the company estimates its current market share at approximately 10% and sets a sales target of ¥1.5 trillion. Key initiatives cited include logistics modernization through the newly operational New Kansai Logistics Center, strengthening product competitiveness through 12 domestic and 6 (procurement centers: 8) overseas consolidation/procurement locations, expansion of e-commerce (online sales up 112.8% year on year, with an online sales ratio of 6.8% and more than 80% of online orders picked up in-store), and DX initiatives such as self-checkouts installed in 167 stores and cleaning robots in 26 stores. On sustainability, the company reported human capital investment of ¥1,880 million in FY26/3 and plans to expand its solar power generation sites from 27 (as of FY26/3) to 85 by the end of FY27/3, targeting an annual CO2 reduction of approximately 6,460 tons.
This article is an analysis based on publicly available information and is not a recommendation to buy or sell any specific securities. Investment decisions are your own responsibility.
















