
This article is based on publicly available IR materials and is not a recommendation to buy or sell any specific securities.
Royal Holdings Co., Ltd. reported record consolidated net sales, operating profit, and ordinary profit for the fiscal year ended December 31, 2025, which the company labels FY12/25 (referred to here as FY2025). Net sales rose 8.8% year on year to 165,495 million yen, operating profit increased 4.3% to 7,685 million yen, and ordinary profit rose 8.2% to 7,917 million yen, with ordinary profit exceeding the company’s full-year forecast of 7,800 million yen by 1.5%. Profit attributable to owners of parent declined 4.5% year on year to 5,660 million yen but still reached a 116.7% progress rate against the initial forecast of 4,850 million yen. Growth was led by the Hotel Business, which achieved significant sales and profit growth on robust domestic and international tourism demand, while the Restaurant (Domestic) and Contract Food Service businesses saw a slight year-on-year decrease in ordinary profit due to rising raw material costs and store opening expenses. For FY12/26, the company forecasts net sales, operating profit, and ordinary profit will reach new record highs for a third consecutive year.
Consolidated Results (Full-Year Actual)
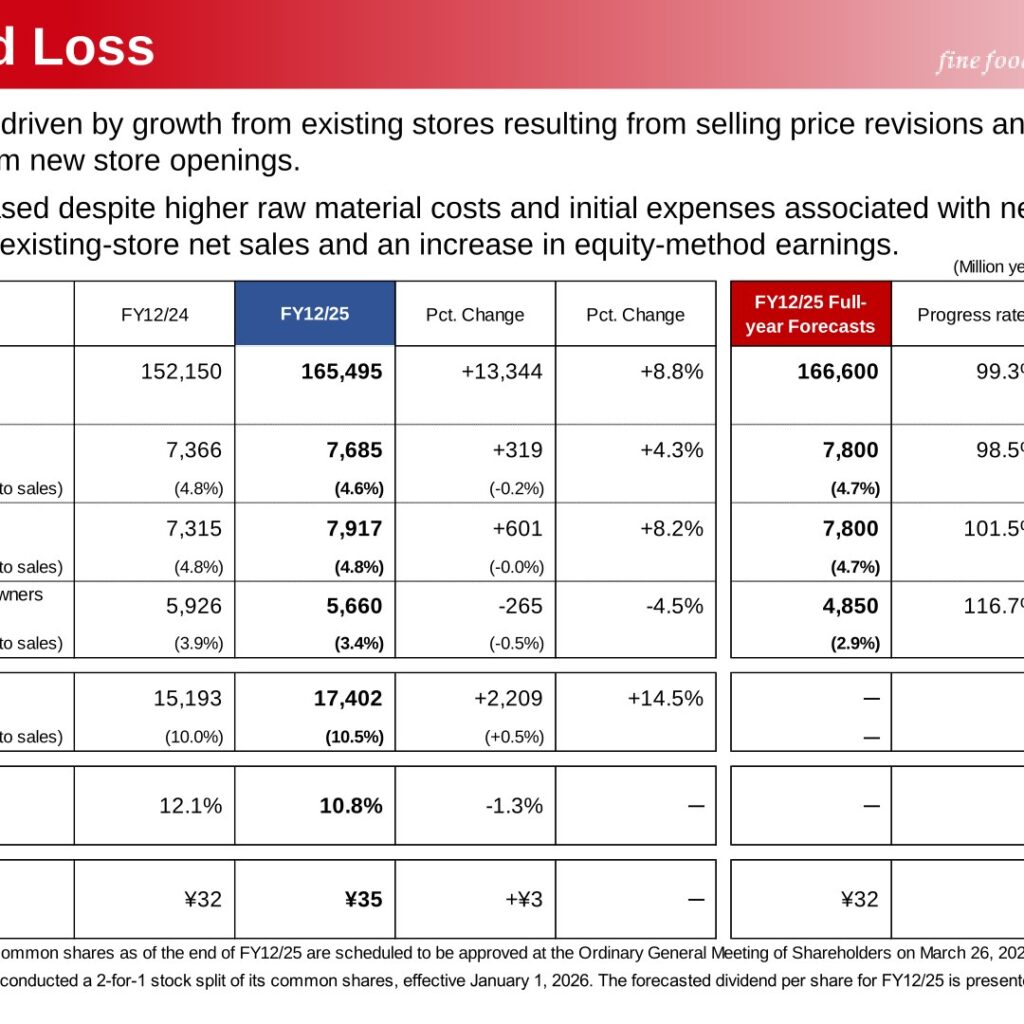
Net sales increased on growth from existing stores driven by selling price revisions and other factors, together with contributions from new store openings. Ordinary profit increased despite higher raw material costs and initial expenses associated with new store openings, supported by steady existing-store net sales and an increase in equity-method earnings. EBITDA rose 14.5% to 17,402 million yen (10.5% of net sales, up from 10.0%). ROE was 10.8%, down 1.3 points year on year. Dividend per share (pre-stock-split basis) was raised to ¥35, up ¥3 from FY12/24’s ¥32 and above the company’s original FY12/25 forecast of ¥32; dividends for FY12/25 are scheduled for approval at the Ordinary General Meeting of Shareholders on March 26, 2026.
| Item | FY12/24 | FY12/25 | YoY (Amount) | YoY (%) | FY12/25 Full-Year Forecast | Progress Rate |
|---|---|---|---|---|---|---|
| Net sales (million yen) | 152,150 | 165,495 | +13,344 | +8.8% | 166,600 | 99.3% |
| Operating profit (million yen) | 7,366 | 7,685 | +319 | +4.3% | 7,800 | 98.5% |
| (Ratio to sales) | (4.8%) | (4.6%) | (-0.2%) | ― | (4.7%) | ― |
| Ordinary profit (million yen) | 7,315 | 7,917 | +601 | +8.2% | 7,800 | 101.5% |
| (Ratio to sales) | (4.8%) | (4.8%) | (-0.0%) | ― | (4.7%) | ― |
| Profit attributable to owners of parent (million yen) | 5,926 | 5,660 | -265 | -4.5% | 4,850 | 116.7% |
| (Ratio to sales) | (3.9%) | (3.4%) | (-0.5%) | ― | (2.9%) | ― |
| EBITDA (million yen) | 15,193 | 17,402 | +2,209 | +14.5% | ― | ― |
| Dividend per share (pre-split basis) | ¥32 | ¥35 | +¥3 | ― | ¥32 | ― |
| ROE | 12.1% | 10.8% | -1.3% | ― | ― | ― |
Segment Results
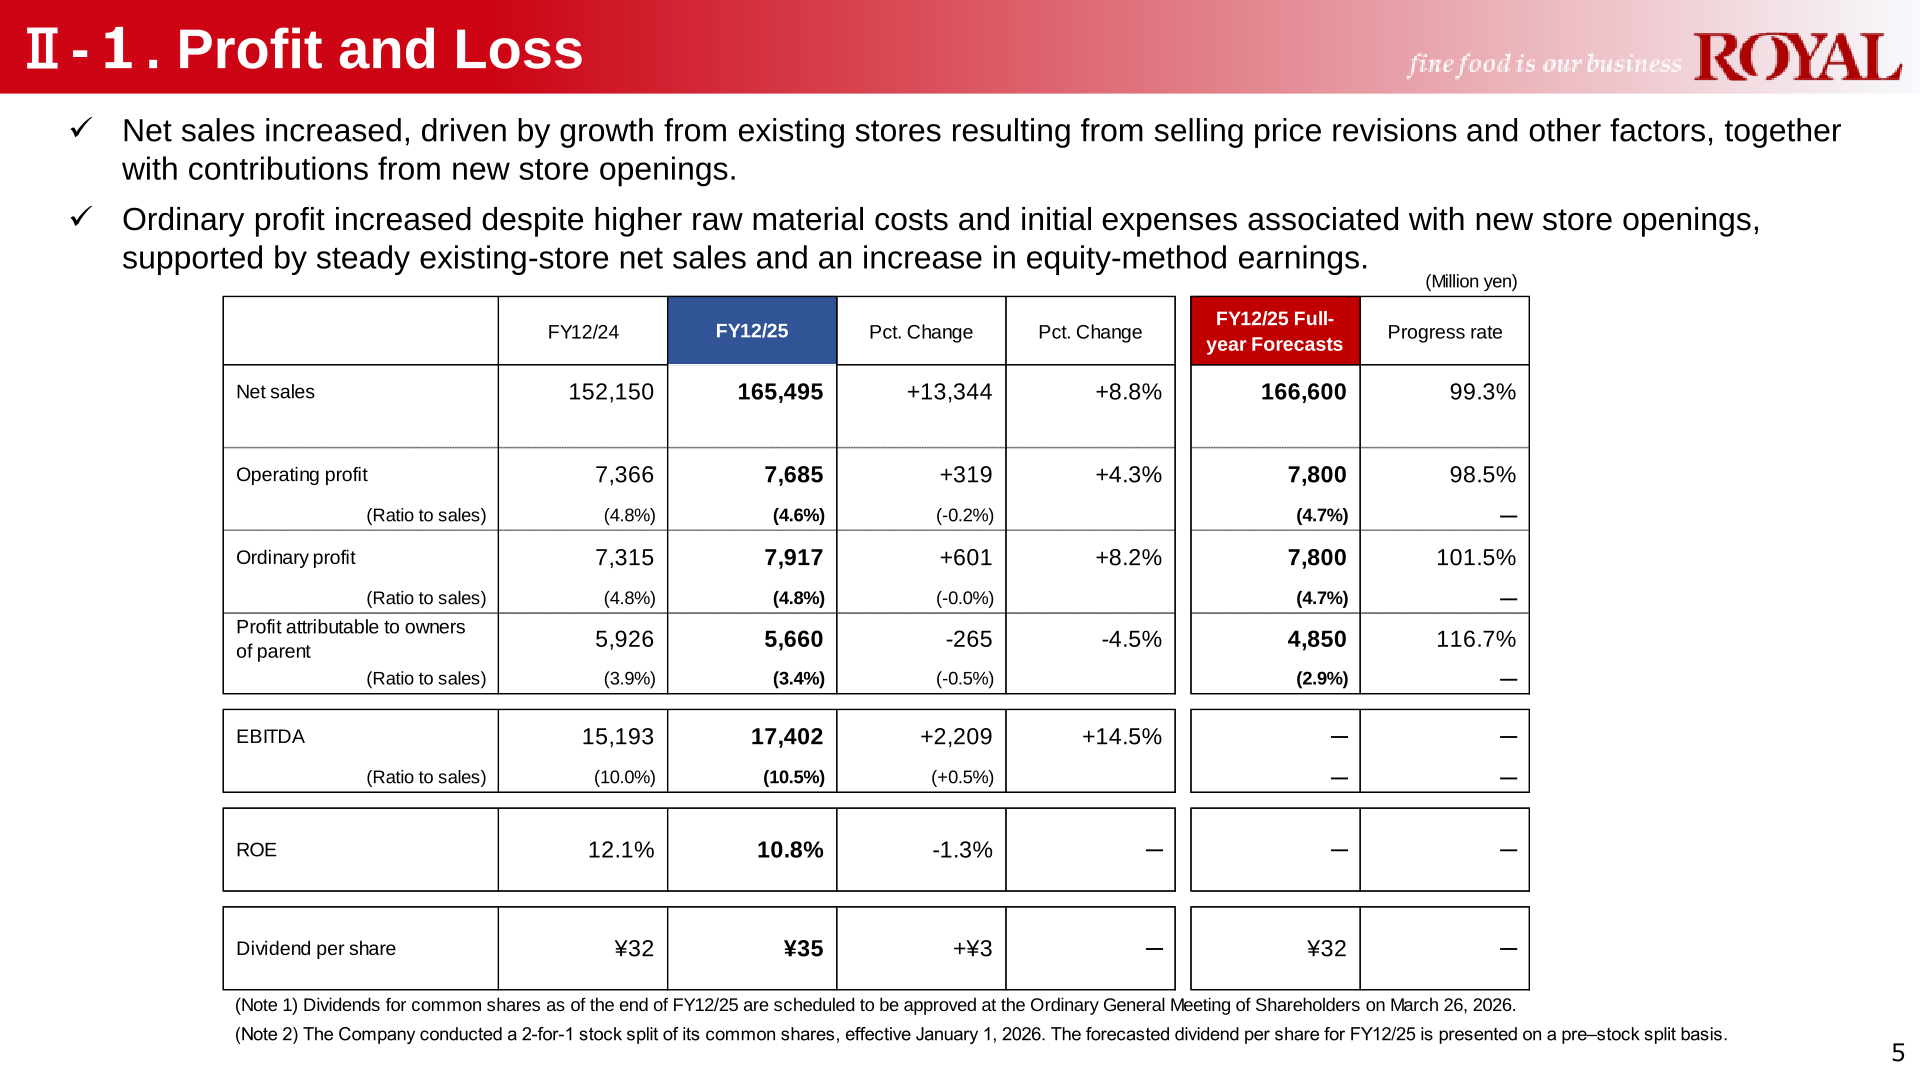
The Hotel Business achieved substantial increases in sales and profits compared with both the prior year and the full-year plan, driven by higher occupancy rates and increases in average daily rate (ADR); the ordinary profit target for the final year of the Medium-Term Management Plan (FY12/27) was achieved in the first year of the plan. The Restaurant Business’s overseas operations, tracked from Q1 FY12/25, recorded net sales of 755 million yen and an ordinary loss of 819 million yen as the company began opening stores in Vietnam and the U.S. Other Business recorded profit growth, supported by an increase in equity-method earnings from the in-flight catering company. At directly operated hotels (43 Richmond Hotels and 1 THE BASEMENT HOTEL), full-year occupancy rose to 87.9% (up 7.4 percentage points year on year) from 80.5%, and ADR rose to 13,594 yen (up 1,103 yen) from 12,491 yen, aided by a higher ratio of inbound guests. On a same-store sales basis (index versus the prior year, not a percentage change), Richmond Hotel and Airport Terminals continued to perform well; Tenya exceeded the previous year’s sales for 58 consecutive months (since March 2021) and Royal Host for 17 consecutive months (since August 2024), while sales at entertainment facilities declined after a pullback from the initial boost of new store openings.
| Segment | Metric | FY12/24 | FY12/25 | YoY (Amount) | YoY (%) |
|---|---|---|---|---|---|
| Restaurant Business | Net sales (million yen) | 63,034 | 66,844 | +3,810 | +6.0% |
| Restaurant Business (Japan) | Net sales (million yen) | 63,034 | 66,088 | +3,054 | +4.8% |
| Restaurant Business (Overseas) | Net sales (million yen) | ― | 755 | +755 | ― |
| Restaurant Business | Ordinary profit (million yen) | 3,197 | 2,337 | -859 | -26.9% |
| Restaurant Business (Japan) | Ordinary profit (million yen) | 3,197 | 3,156 | -40 | -1.3% |
| Restaurant Business (Overseas) | Ordinary profit (million yen) | ― | -819 | -819 | ― |
| Contract Food Service Business | Net sales (million yen) | 49,789 | 53,364 | +3,575 | +7.2% |
| Contract Food Service Business | Ordinary profit (million yen) | 2,747 | 2,656 | -91 | -3.3% |
| Hotel Business | Net sales (million yen) | 35,072 | 41,416 | +6,344 | +18.1% |
| Hotel Business | Ordinary profit (million yen) | 5,424 | 6,849 | +1,424 | +26.3% |
| Food Manufacturing Business | Net sales (million yen) | 12,473 | 12,955 | +482 | +3.9% |
| Food Manufacturing Business | Ordinary profit (million yen) | 107 | 452 | +345 | +320.7% |
| Other Business | Net sales (million yen) | 327 | 316 | -11 | -3.4% |
| Other Business | Ordinary profit (million yen) | 601 | 973 | +371 | +61.7% |
| Consolidated Total | Net sales (million yen) | 152,150 | 165,495 | +13,344 | +8.8% |
| Consolidated Total | Ordinary profit (million yen) | 7,315 | 7,917 | +601 | +8.2% |
FY2026 Forecast
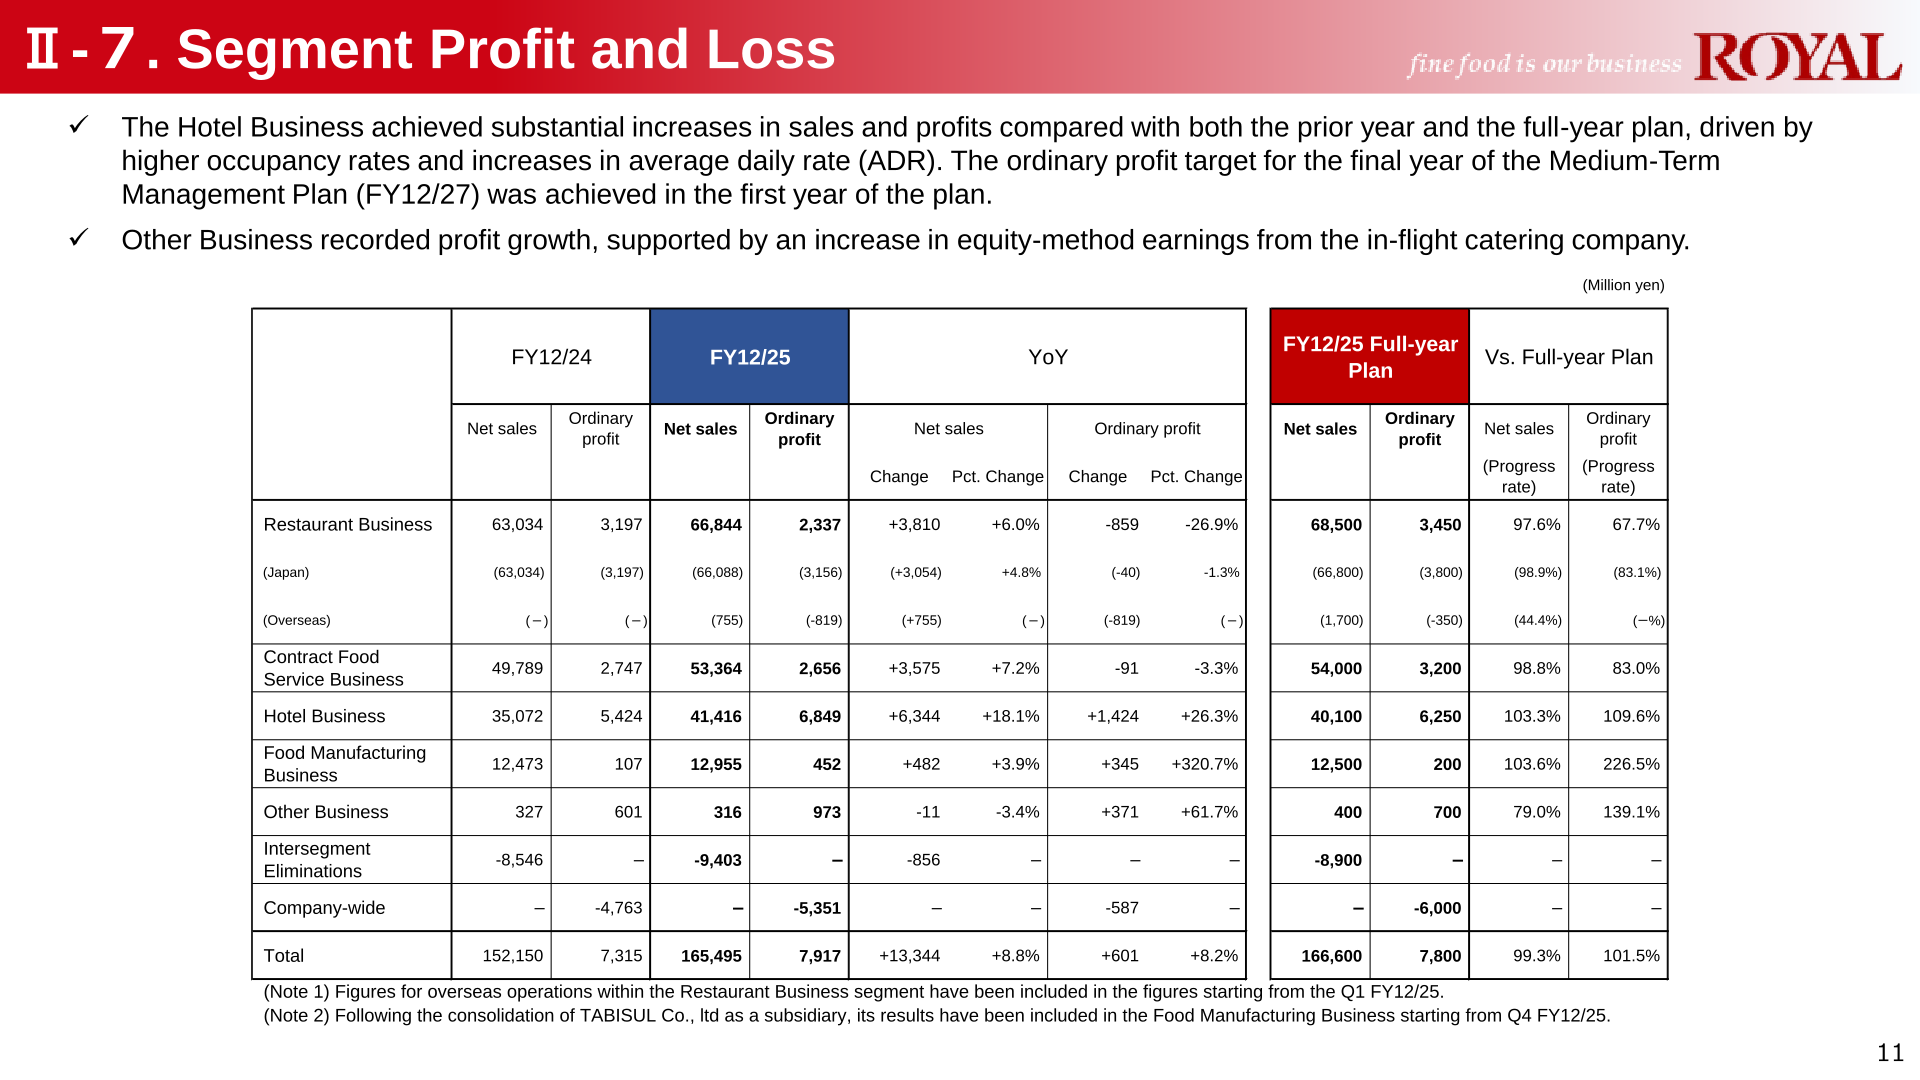
Net sales and ordinary profit are expected to reach new record highs for a third consecutive year, with the ordinary profit target of 10.0 billion yen for the final year of the Medium-Term Management Plan (FY12/27) within sight. Even after factoring in profit-reducing factors totaling approximately 2.9 billion yen — including a 2.2 billion yen increase in raw material costs and a 0.7 billion yen increase in DX (digital transformation) initiatives and marketing expenses — an increase in profit is expected compared with the previous fiscal year. By segment, the Restaurant Business plans to improve overseas profitability through expansion of directly operated stores in Vietnam while advancing a high value-added strategy domestically to address persistently high raw material costs; the Contract Food Service Business plans to leverage its restaurant operations expertise to secure new store management contracts; and the Hotel Business plans to enhance accommodation value at existing hotels through renovations while opening new hotels under new business formats. Same-store sales (combined total of the Restaurant, Contract Food Service, and Hotel businesses) are projected at 103% of the prior-year level.
| Item | FY12/25 (Actual) | FY12/26 Plan | Change | Pct. Change |
|---|---|---|---|---|
| Net sales (million yen) | 165,495 | 174,800 | +9,304 | +5.6% |
| Operating profit (million yen) | 7,685 | 8,950 | +1,264 | +16.4% |
| (Ratio to sales) | (4.6%) | (5.1%) | (+0.5%) | ― |
| Ordinary profit (million yen) | 7,917 | 8,800 | +882 | +11.1% |
| (Ratio to sales) | (4.8%) | (5.0%) | (+0.2%) | ― |
| Profit attributable to owners of parent (million yen) | 5,660 | 5,700 | +39 | +0.7% |
| (Ratio to sales) | (3.4%) | (3.3%) | (-0.2%) | ― |
| Dividend per share (post-split basis) | ¥17.50 | ¥17.50 | +¥0 | ― |
By segment, Restaurant Business ordinary profit is planned to rise 71.1% to 4,000 million yen (Japan: +36.2% to 4,300 million yen; Overseas: loss narrowing from -819 million yen to -300 million yen), while Food Manufacturing Business ordinary profit is planned to decline 55.8% to 200 million yen. Company-wide costs, which include system-related expenses (planned to increase from 1,789 million yen to 2,300 million yen), are expected to widen from -5,351 million yen to -6,300 million yen.
| Segment | Metric | FY12/25 | FY12/26 Plan | Change | Pct. Change |
|---|---|---|---|---|---|
| Restaurant Business | Net sales (million yen) | 66,844 | 72,300 | +5,455 | +8.2% |
| Restaurant Business (Japan) | Net sales (million yen) | 66,088 | 70,400 | +4,311 | +6.5% |
| Restaurant Business (Overseas) | Net sales (million yen) | 755 | 1,900 | +1,144 | +151.4% |
| Restaurant Business | Ordinary profit (million yen) | 2,337 | 4,000 | +1,662 | +71.1% |
| Restaurant Business (Japan) | Ordinary profit (million yen) | 3,156 | 4,300 | +1,143 | +36.2% |
| Restaurant Business (Overseas) | Ordinary profit (million yen) | -819 | -300 | +519 | ― |
| Contract Food Service Business | Net sales (million yen) | 53,364 | 53,000 | -364 | -0.7% |
| Contract Food Service Business | Ordinary profit (million yen) | 2,656 | 2,900 | +243 | +9.2% |
| Hotel Business | Net sales (million yen) | 41,416 | 43,800 | +2,383 | +5.8% |
| Hotel Business | Ordinary profit (million yen) | 6,849 | 7,100 | +250 | +3.7% |
| Food Manufacturing Business | Net sales (million yen) | 12,955 | 15,400 | +2,444 | +18.9% |
| Food Manufacturing Business | Ordinary profit (million yen) | 452 | 200 | -252 | -55.8% |
| Other Business | Net sales (million yen) | 316 | 400 | +83 | +26.4% |
| Other Business | Ordinary profit (million yen) | 973 | 900 | -73 | -7.6% |
| Consolidated Total | Net sales (million yen) | 165,495 | 174,800 | +9,304 | +5.6% |
| Consolidated Total | Ordinary profit (million yen) | 7,917 | 8,800 | +882 | +11.1% |
Balance Sheet and Cash Allocation
As of the end of FY12/25, total assets amounted to 139,763 million yen, an increase of 12,024 million yen from the end of the previous fiscal year (127,738 million yen). The shareholders’ equity ratio was 39.2% (down from 39.3%), and the fixed asset to long-term capital ratio was 96.4% (up from 94.0%). Intangible assets, mainly goodwill, increased to 22,293 million yen (goodwill rose to 8,769 million yen, up 3,837 million yen) due to the consolidation of TABISUL Co., Ltd., while borrowings rose to 26,500 million yen (up 4,800 million yen) on growth investments in Japan and overseas. On a cash allocation basis, operating cash flow (pre-tax) of 16.1 billion yen and debt financing of 2.0 billion yen were allocated to capital expenditures of 10.2 billion yen, growth investments (equity investments) of 6.2 billion yen, shareholder returns (dividends) of 1.6 billion yen, and corporate tax payments of 0.3 billion yen. Group-wide capital expenditure for FY12/25 totaled 11.72 billion yen, a 25.2% progress rate against the 46.5 billion yen three-year investment plan for 2025-2027.
Shareholder Returns
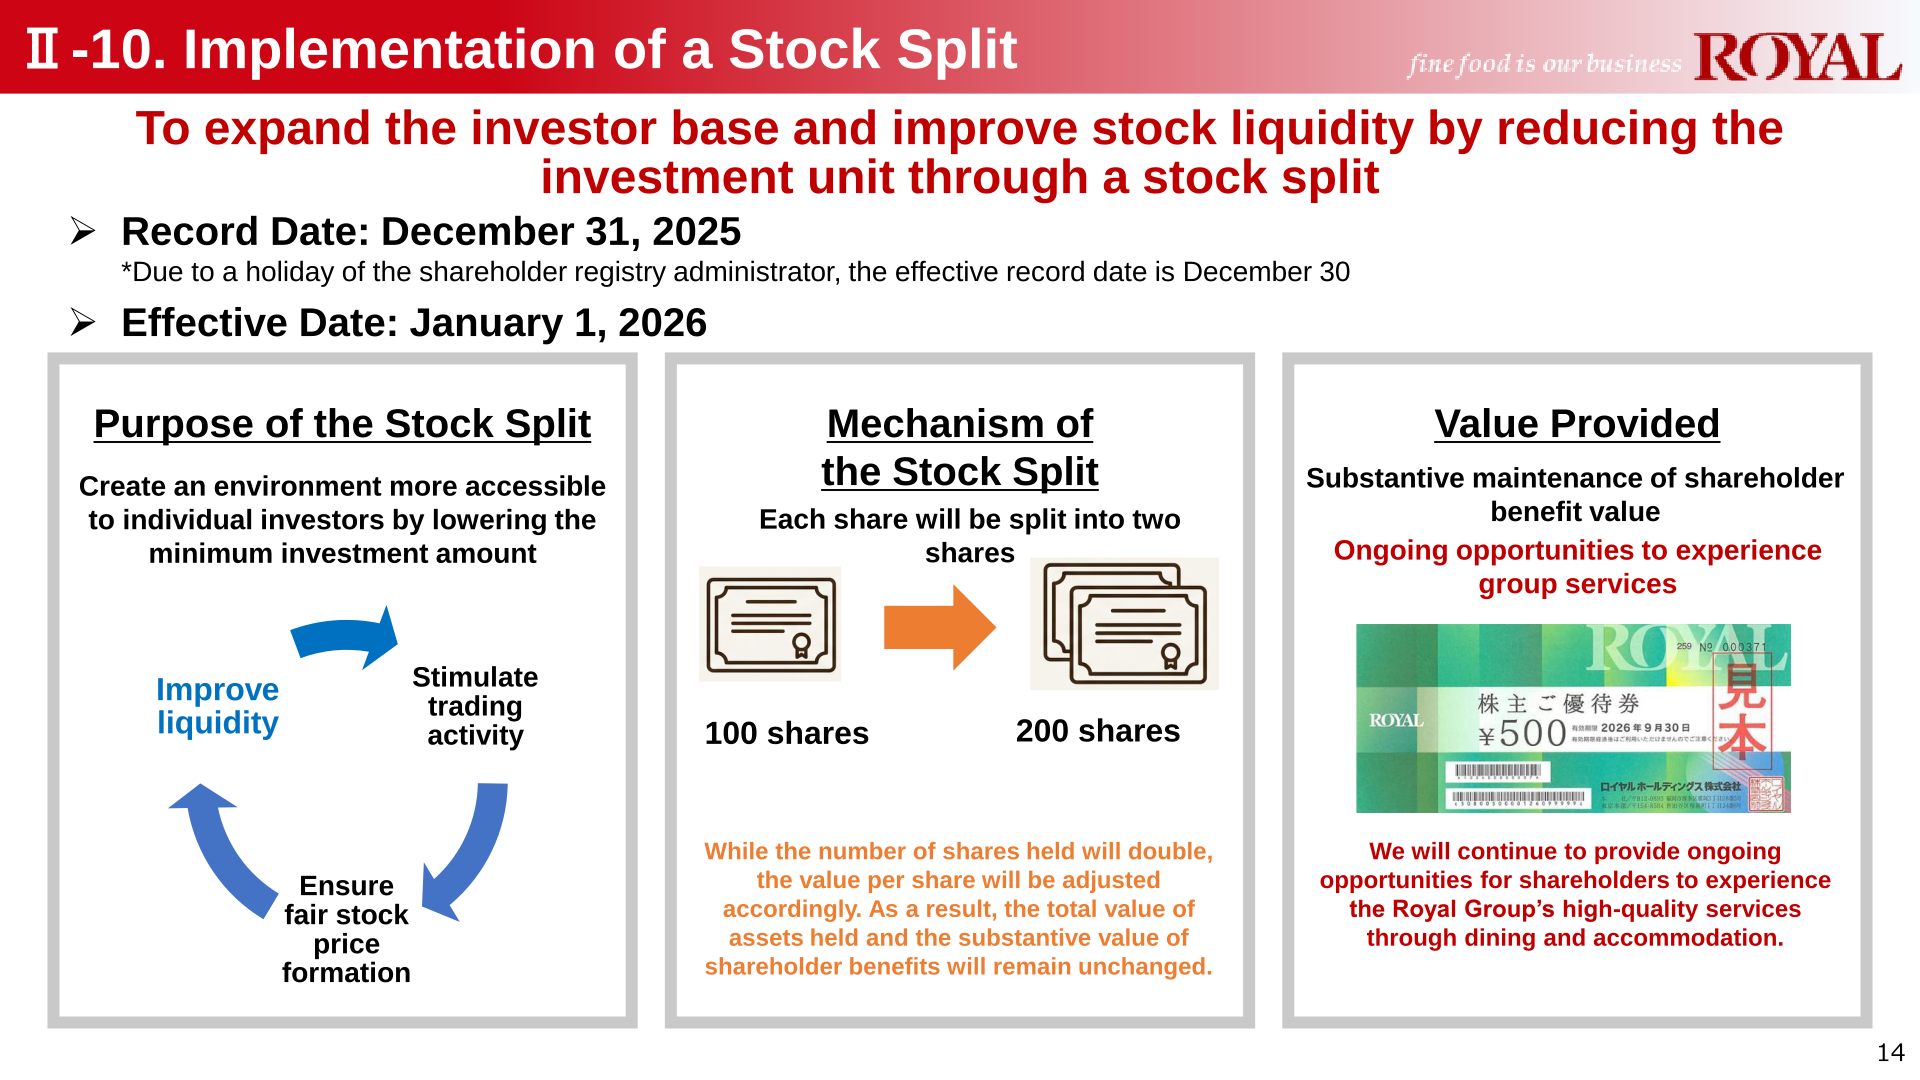
Royal Holdings raised its FY12/25 dividend per share to ¥35 (pre-stock-split basis), up from ¥32 in FY12/24 and above the company’s original forecast of ¥32. The company conducted a 2-for-1 stock split of its common shares (record date December 31, 2025; effective date January 1, 2026) to expand the investor base and improve stock liquidity; on a post-split basis, dividend per share is presented as ¥17.50 for both FY12/25 and the FY12/26 plan, meaning the pre-split-equivalent dividend is expected to be maintained at the FY12/25 level. The stated purpose of the stock split includes stimulating trading activity, ensuring fair stock price formation, and improving liquidity, while maintaining the substantive value of shareholder benefits. Under its cash allocation framework, the company plans to maintain stable dividends based on solid performance.
Medium-Term Plan / Topics
The Hotel Business achieved the ordinary profit target set for FY12/27, the final year of the current Medium-Term Management Plan, in the first year of the plan, supported by higher occupancy and ADR. Following the consolidation of TABISUL Co., Ltd. as a subsidiary, its results have been included in the Food Manufacturing Business from Q4 FY12/25. The Restaurant Business commenced new store openings in Vietnam and the U.S. during the year. Group-wide capital expenditure of 11.72 billion yen in FY12/25 represented 25.2% progress against the 46.5 billion yen three-year investment plan (2025-2027), which covers new store openings, renovations, DX initiatives, and equipment replacement across the Restaurant, Contract Food Service, Hotel, and Food Manufacturing businesses.
This article is an analysis based on publicly available information and is not a recommendation to buy or sell any specific securities. Investment decisions are your own responsibility.
















