
This article is based on publicly available IR materials and is not a recommendation to buy or sell any specific securities.
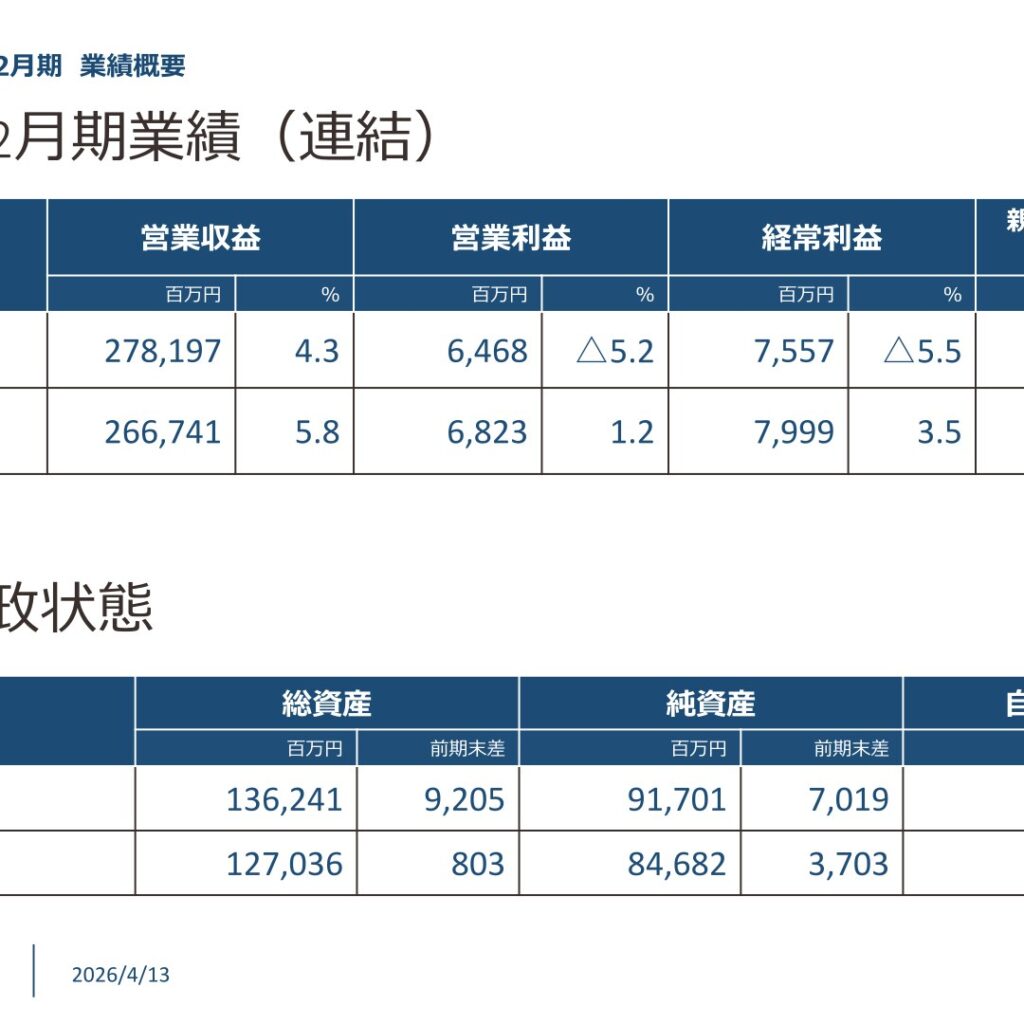
Note: Retail Partners Co., Ltd. does not publish an English results presentation; this article is an English translation of the Japanese-language article on our sister site Investalk, which is based on the company’s Japanese-language IR materials, with figures transcribed as reported. Retail Partners’ fiscal year ends in February; this site classifies the most recent completed fiscal year as FY2025, while the company’s own materials label the period as the fiscal year ended February 28, 2026 (2026年2月期). For the fiscal year ended February 28, 2026 (consolidated), Retail Partners recorded operating revenues of 278,197 million yen (up 11,456 million yen, or 4.3%, year on year), a record high. Gross profit and gross operating profit also reached record levels, marking three consecutive years of revenue and profit growth on a gross-profit basis.
On the other hand, operating income was 6,468 million yen (△5.2% year on year), ordinary profit was 7,557 million yen (△5.5%), and profit attributable to owners of parent was 5,138 million yen (△1.7%), resulting in higher revenue but lower profit. According to the materials, in addition to the impact of rising store operating costs such as electricity charges, factors behind the profit decline included upfront investments such as “investment in people” (higher personnel expenses) to improve employee engagement and secure human resources, the start of operations at the “RPG Miyazaki Logistics Center,” which optimizes the logistics base in the South Kyushu area, and M&A-related acquisition costs associated with Nagano Co., Ltd. joining the group to expand area market share. Nagano Co., Ltd. has been included in consolidated results from the third quarter of the fiscal year ended February 28, 2026, and the company expects Retail Partners’ combined share of food sales in Miyazaki Prefecture to reach approximately 12.5% going forward (third in the prefecture; source: 2025 Food Supermarket Yearbook).
Consolidated Results (Fiscal Year Ended February 2026, Actual)
| Item | FY ended Feb 2026 | FY ended Feb 2025 | YoY Change |
|---|---|---|---|
| Operating revenues | 278,197 million yen | 266,741 million yen | +4.3% |
| Operating income | 6,468 million yen | 6,823 million yen | △5.2% |
| Ordinary profit | 7,557 million yen | 7,999 million yen | △5.5% |
| Profit attributable to owners of parent | 5,138 million yen | 5,225 million yen | △1.7% |
| Total assets | 136,241 million yen | 127,036 million yen | +9,205 million yen |
| Equity ratio | 67.3% | 66.7% | +0.6pt |
Segment Results
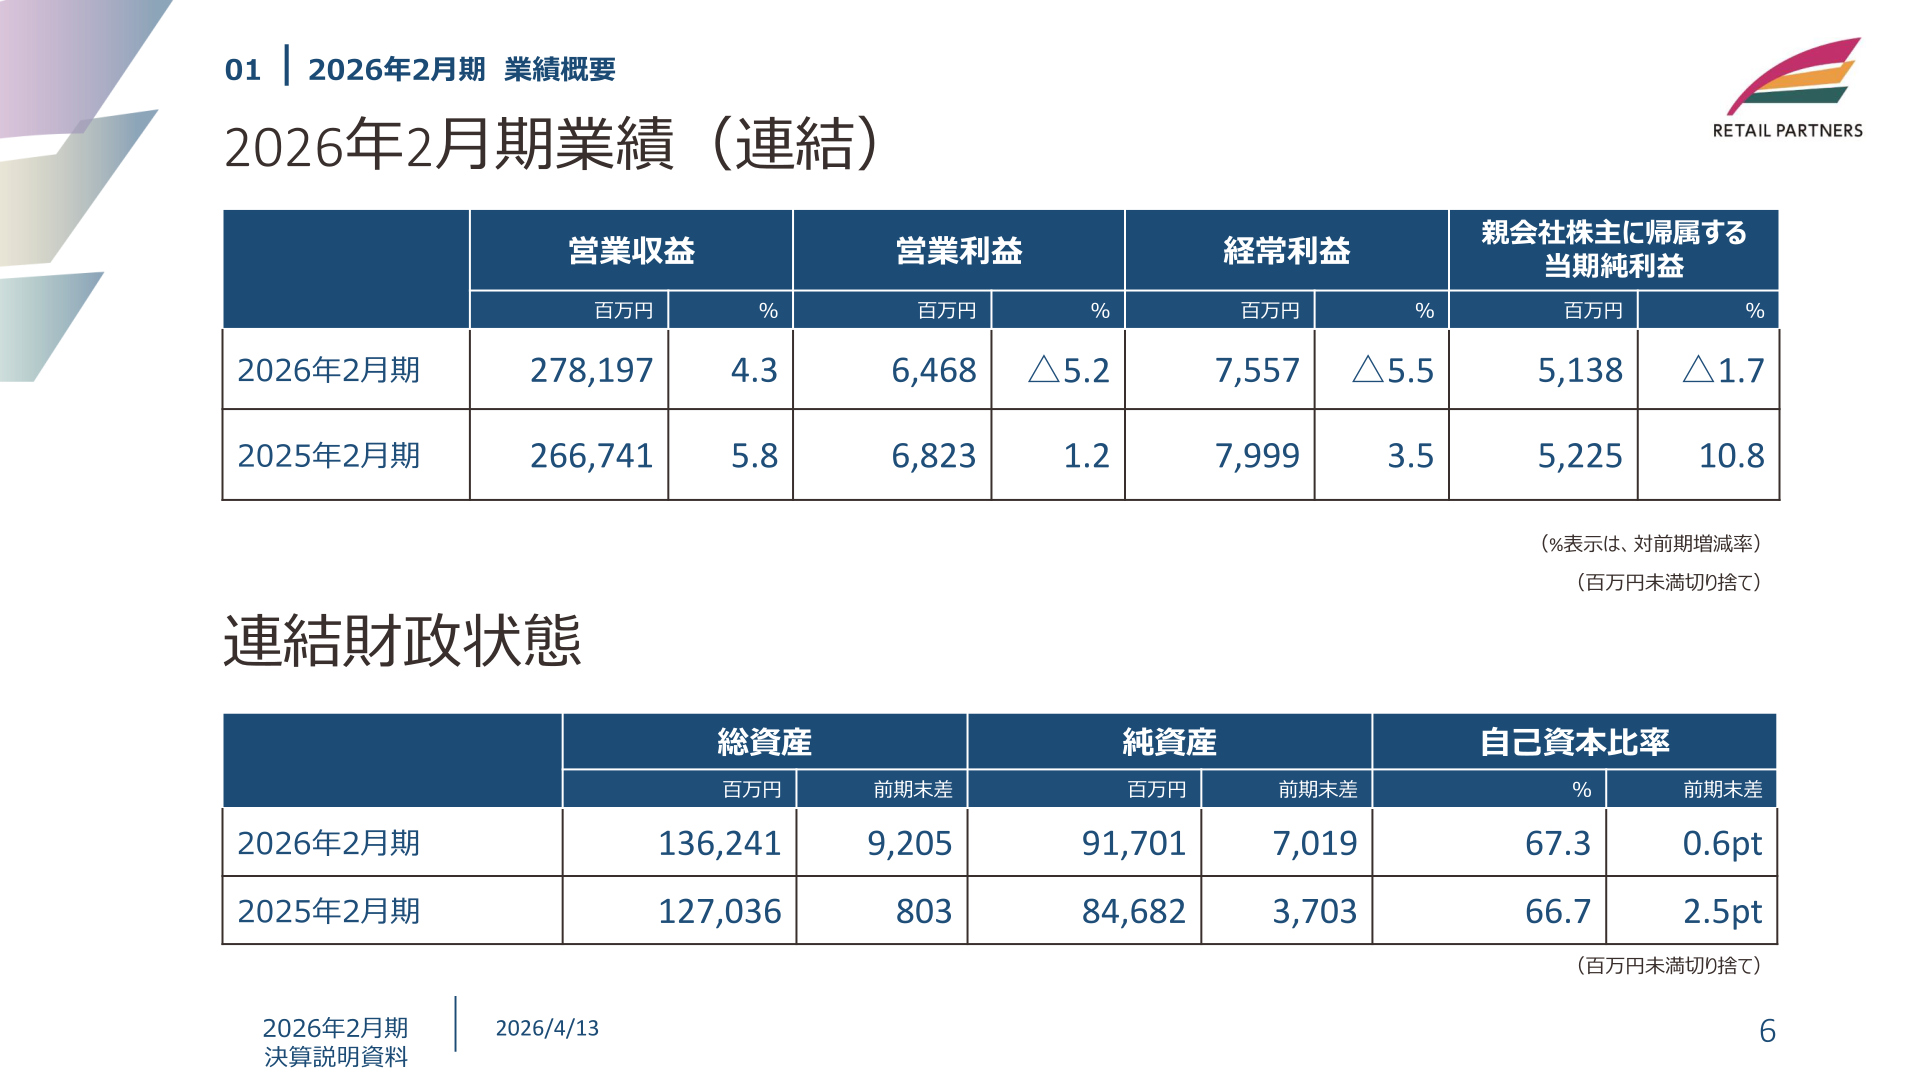
The Group’s reportable segments were previously classified as “Supermarket Business” and “Discount Store Business”; from the previous consolidated fiscal year, these two segments have been integrated into “Supermarket Business.” Under the new classification, the Supermarket Business recorded operating revenues of 277,301 million yen (up 4.3% year on year) and operating income of 6,851 million yen (△4.3%). The Other Business recorded operating revenues of 1,045 million yen (up 8.1%) and operating income of 140 million yen (up 23.1%).
| Segment | Metric | FY ended Feb 2026 | FY ended Feb 2025 | YoY Change |
|---|---|---|---|---|
| Supermarket Business (post-reclassification) | Operating revenues | 277,301 million yen | 265,936 million yen | +4.3% |
| Supermarket Business (post-reclassification) | Operating income | 6,851 million yen | 7,162 million yen | △4.3% |
| Other Business | Operating revenues | 1,045 million yen | 967 million yen | +8.1% |
| Other Business | Operating income | 140 million yen | 114 million yen | +23.1% |
FY2026 Forecast (Fiscal Year Ending February 2027)
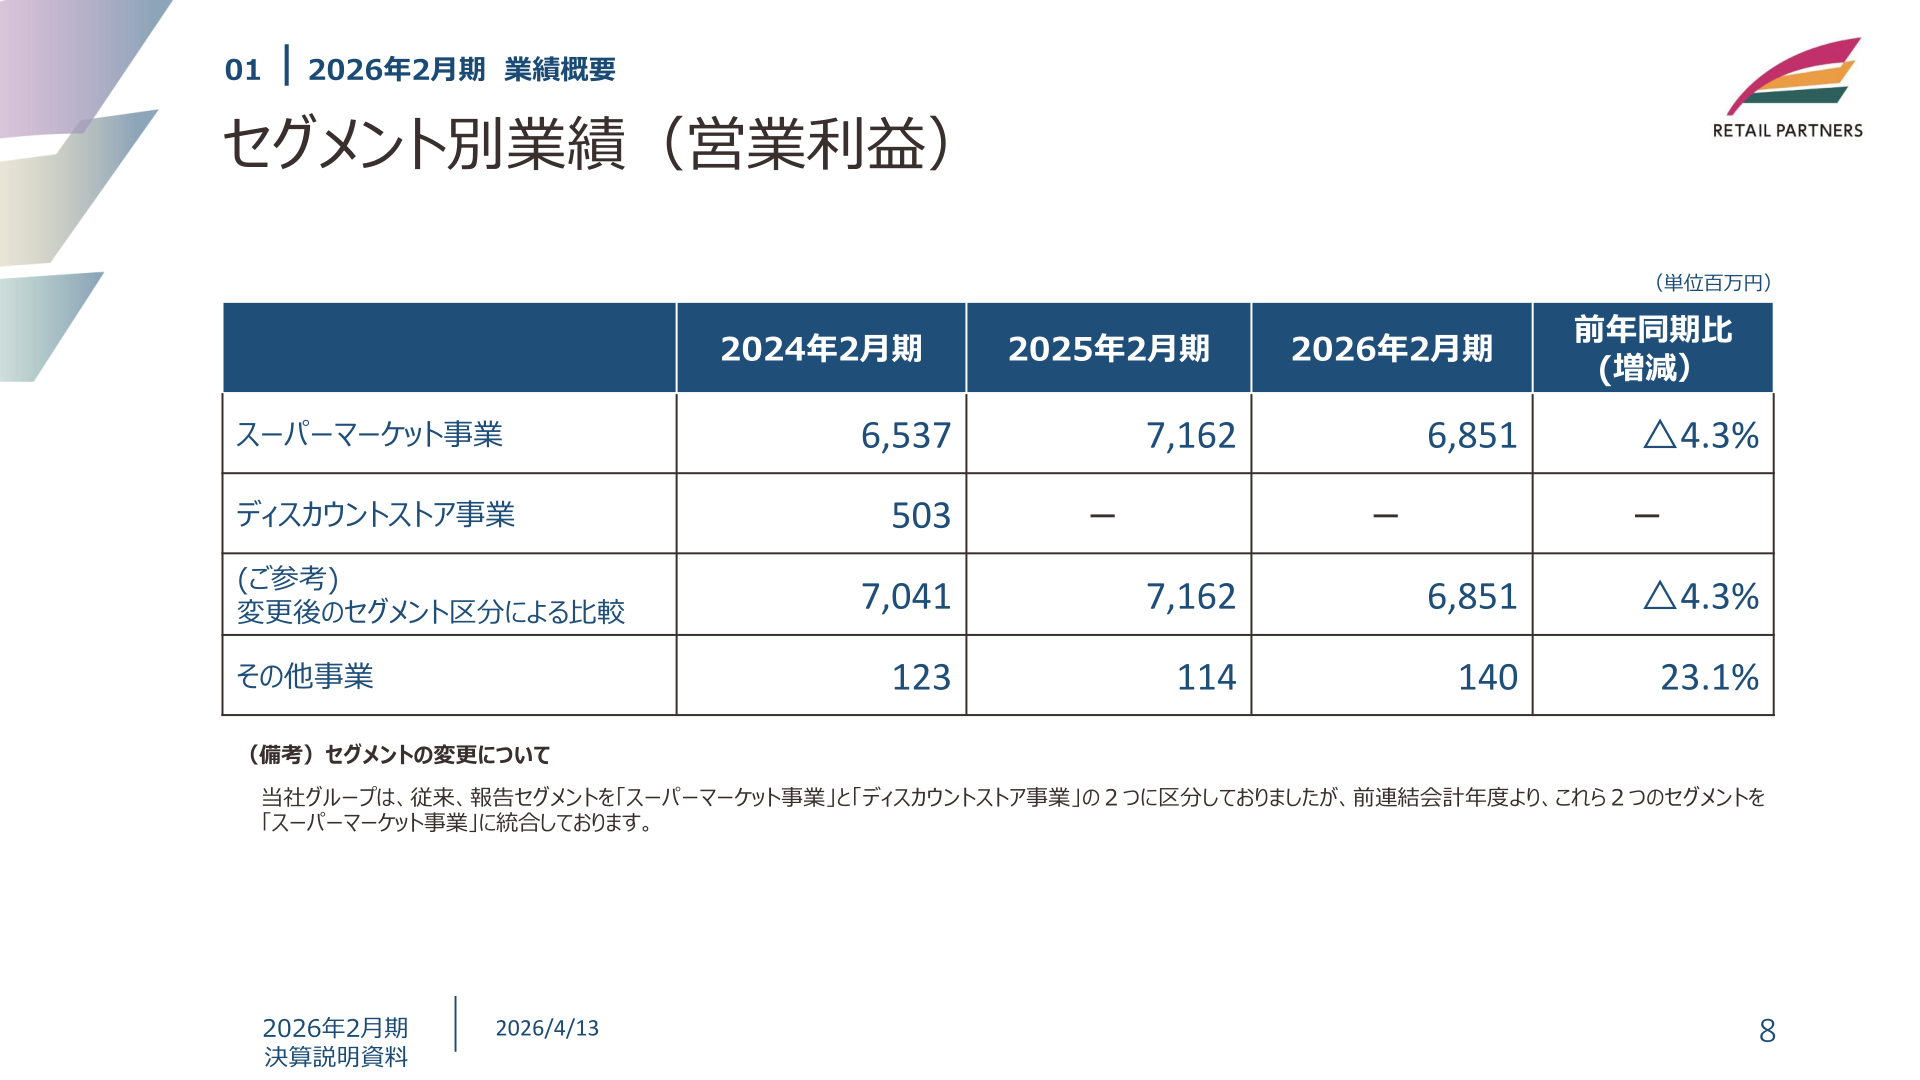
The fiscal year ending February 28, 2027 (the next fiscal year) is the final year of the Third Medium-Term Management Plan. The consolidated full-year forecast calls for operating revenues of 288,500 million yen (up 3.7% year on year), operating income of 6,800 million yen (up 5.1%), ordinary profit of 7,700 million yen (up 1.9%), and profit attributable to owners of parent of 5,350 million yen (up 4.1%), representing higher revenue and higher profit. On the other hand, the company expects to fall short of the 9.8 billion yen ordinary profit target set for the final year of the Third Medium-Term Management Plan. The materials cite as factors: a shortfall in part of the three-year uplift effect from M&A that had been factored into the plan, higher expenses due to inflation exceeding the level assumed when the plan was formulated, and a structural rise in personnel expenses as an essential “investment in people” to support sustainable growth.
| Item | FY ending Feb 2027 (Forecast) | FY ended Feb 2026 (Actual) | YoY Change |
|---|---|---|---|
| Operating revenues | 288,500 million yen | 278,197 million yen | +3.7% |
| Operating income | 6,800 million yen | 6,468 million yen | +5.1% |
| Ordinary profit | 7,700 million yen | 7,557 million yen | +1.9% |
| Profit attributable to owners of parent | 5,350 million yen | 5,138 million yen | +4.1% |
Shareholder Returns
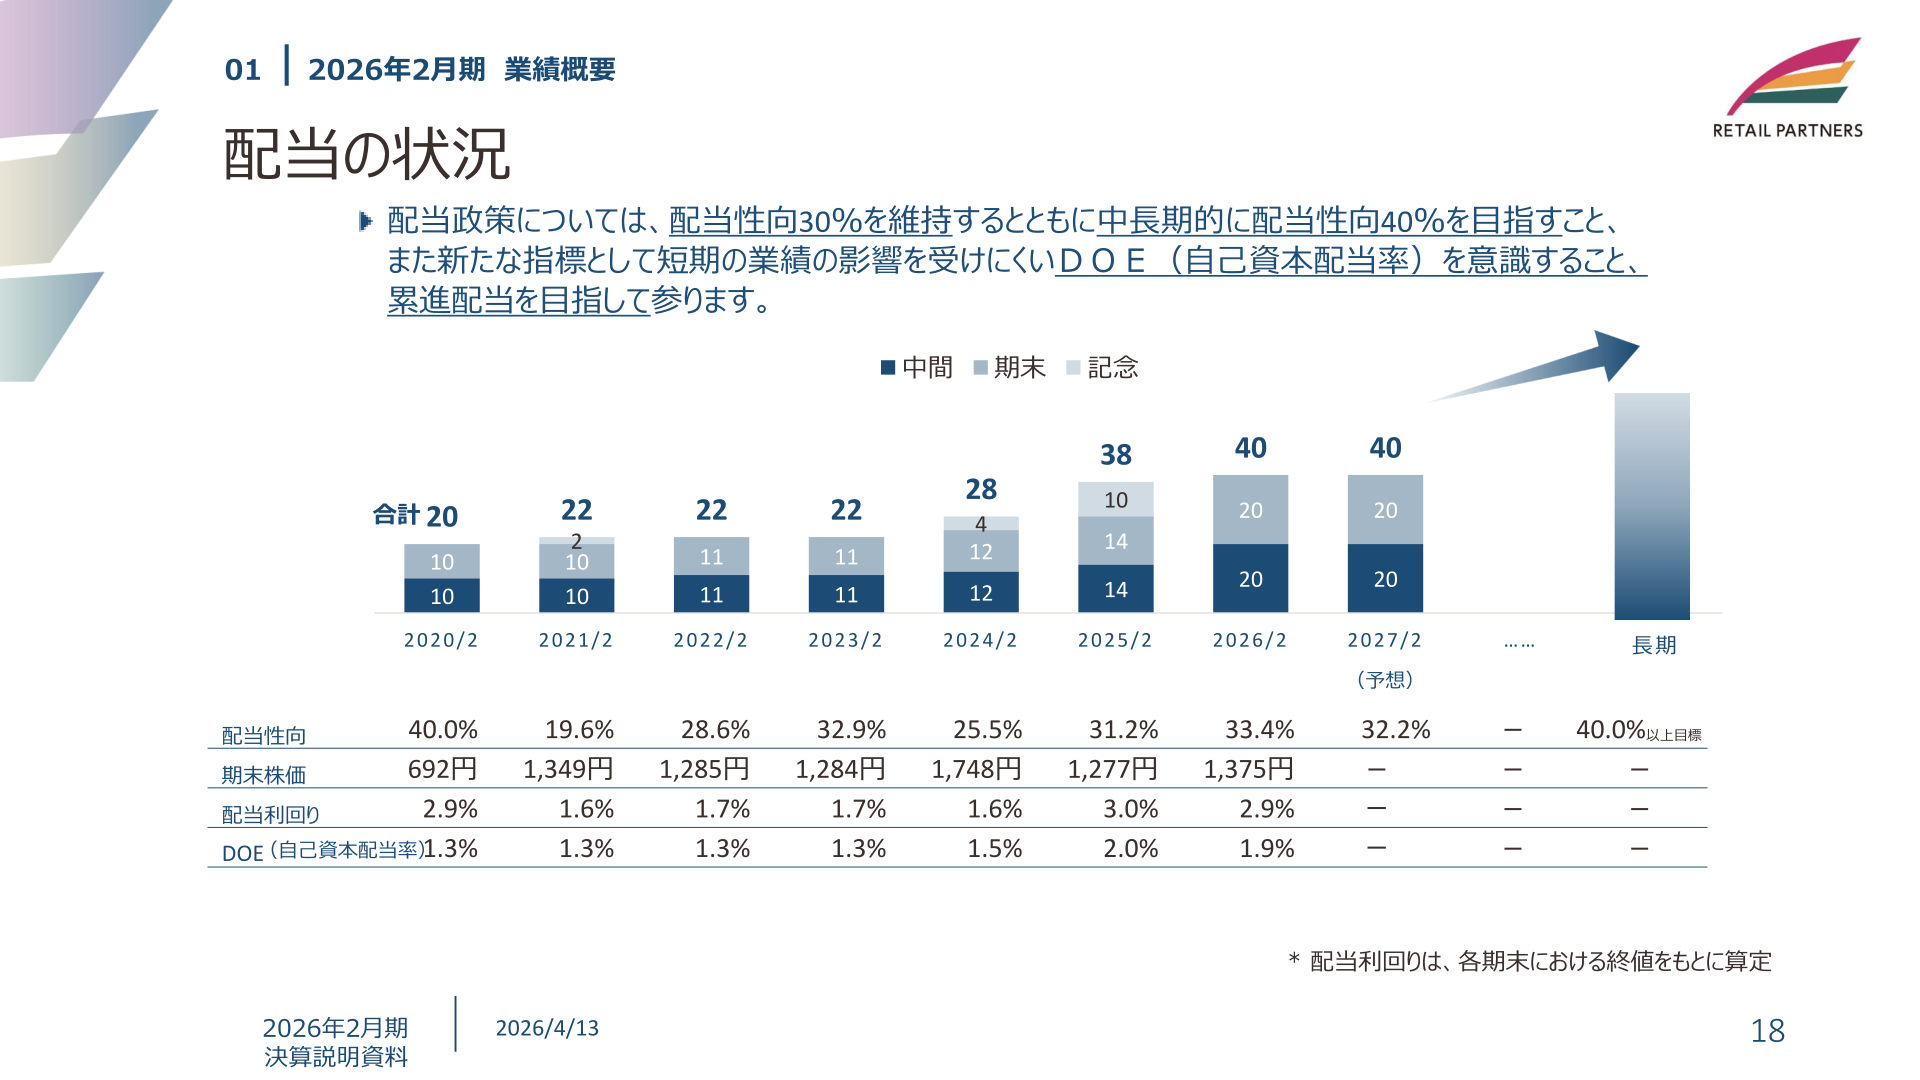
The company’s dividend policy is to maintain a payout ratio of 30% while aiming for a medium- to long-term payout ratio of 40%, and to pursue progressive dividends with an awareness of DOE (dividend on equity ratio) as a new indicator. The annual dividend for the fiscal year ended February 28, 2026 was 40 yen per share (interim 20 yen, year-end 20 yen; payout ratio 33.4%), an increase from the previous fiscal year’s (fiscal year ended February 28, 2025) total of 38 yen (interim 14 yen, year-end 14 yen, including a commemorative dividend of 10 yen). For the fiscal year ending February 28, 2027, the company forecasts an annual dividend of 40 yen (interim 20 yen, year-end 20 yen; forecast payout ratio 32.2%), maintaining the interim and year-end levels (20 yen each) of the previous fiscal year excluding the commemorative dividend.
| Item | FY ended Feb 2024 | FY ended Feb 2025 | FY ended Feb 2026 | FY ending Feb 2027 (Forecast) |
|---|---|---|---|---|
| Interim dividend | 12 yen | 14 yen | 20 yen | 20 yen |
| Year-end dividend | 12 yen | 14 yen | 20 yen | 20 yen |
| Commemorative dividend | 4 yen | 10 yen | ー | ー |
| Total annual dividend | 28 yen | 38 yen | 40 yen | 40 yen |
| Payout ratio | 25.5% | 31.2% | 33.4% | 32.2% |
| DOE (dividend on equity ratio) | 1.5% | 2.0% | 1.9% | ー |
Capital Cost and Share Price-Conscious Management
The company has set targets of ROE of 7.0% or higher and PBR above 1.1x for the final year of the Third Medium-Term Management Plan (fiscal year ending February 2027), and ROE of 8.0% or higher and PBR above 1.3x for its long-term management vision (fiscal 2035). Actual results for the fiscal year ended February 28, 2026 were ROE of 6.1% (down 0.3pt year on year) and PBR of 0.64x (down 0.01x year on year). As part of strengthening its dividend policy, the company has set a long-term target payout ratio of “30% or higher,” and states that the 33.4% payout ratio achieved in the fiscal year ended February 28, 2026 cleared this target level. The company also states that it will consider share buybacks from time to time to improve capital efficiency.
This article is an analysis based on publicly available information and is not a recommendation to buy or sell any specific securities. Investment decisions are your own responsibility.
















