
This article is based on publicly available IR materials and is not a recommendation to buy or sell any specific securities.
Note on fiscal-year labels: Sanshin Electronics refers to the fiscal year ended March 31, 2026 as the “03/26 Term” (or “Year Ended March 2026”) in its presentation materials; this article labels it FY2025 per site convention. The following fiscal year, ending March 31, 2027, is referred to by the company as the “03/27 Term” and is labeled FY2026 in this article.
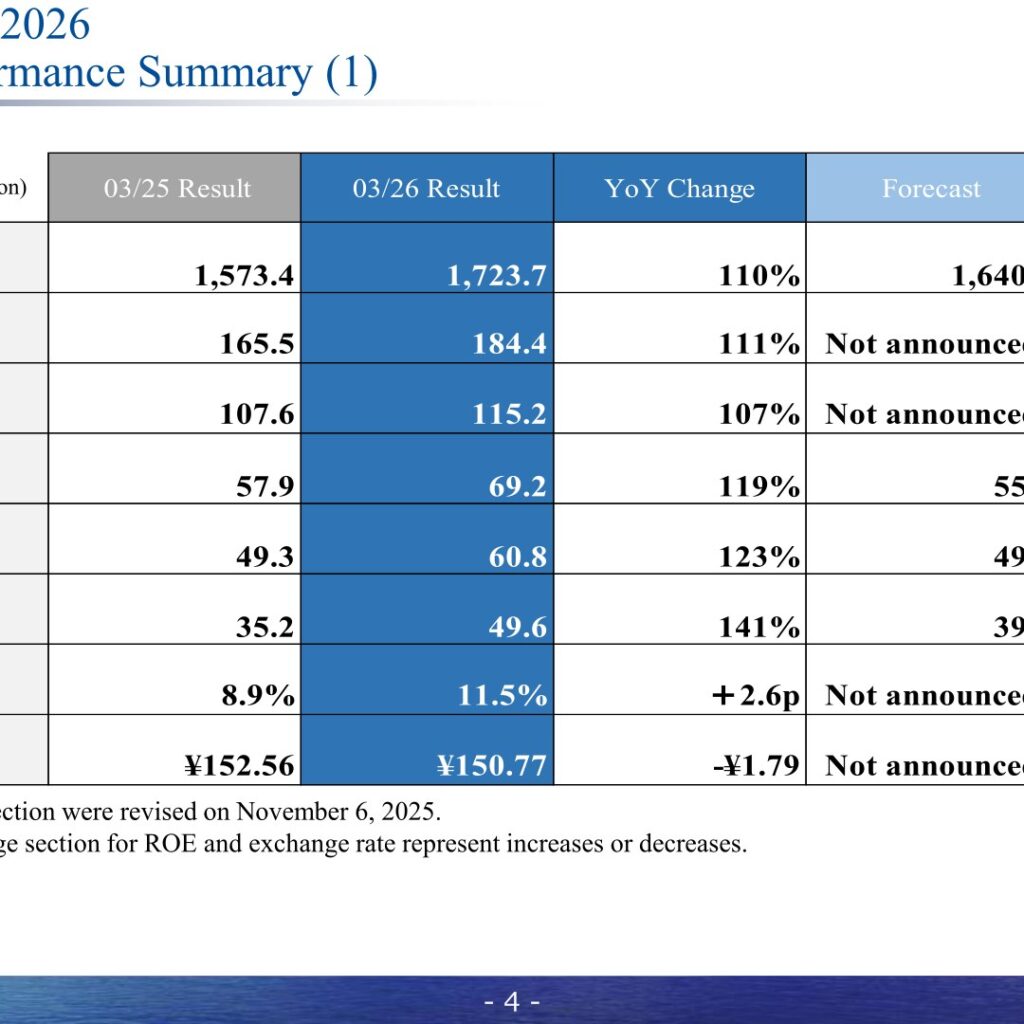
Sanshin Electronics Co., Ltd. reported consolidated results for the year ended March 31, 2026 with net sales of 1,723.7 (¥100 million), 110% of the previous year’s level, and operating profit of 69.2 (¥100 million), 119% of the previous year’s level. Ordinary profit rose to ¥6.08 billion, 123% of the previous year’s level, and profit attributable to owners of parent rose to ¥4,955 million, 141% of the previous year’s level. All of net sales, operating profit, ordinary profit and net profit exceeded the company’s own forecast (achievement ratios of 105%, 126%, 124% and 127% respectively), and return on equity (ROE) improved to 11.5%, up 2.6 percentage points year on year. The Solution Business achieved all-time highs in both net sales and segment profit for the year.
Consolidated Results (Full-Year Actual)
Gross profit on sales rose to 184.4 (¥100 million), 111% of the previous year’s level, while SG&A expenses rose to 115.2 (¥100 million), 107% of the previous year’s level. Ordinary profit increased from ¥4.93 billion in the year ended March 2025 to ¥6.08 billion in the year ended March 2026, mainly reflecting an increase in gross profit of approximately ¥1.82 billion (on higher net sales) and an improvement in non-operating profit of approximately ¥0.09 billion (mainly a decrease in interest expenses), partly offset by an increase in SG&A expenses of approximately ¥0.76 billion (mainly strengthened investment in human capital, including personnel expenses, and outsourcing expenses). The average exchange rate was ¥150.77 to the US dollar, compared with ¥152.56 a year earlier.
On the balance sheet, total assets were ¥91.0 billion, up ¥7.0 billion from the end of the previous fiscal year, lifted by an increase in notes and accounts receivable-trade from higher sales and an increase in inventories. Interest-bearing liabilities were ¥19.8 billion, ¥4.4 billion lower than in the previous fiscal year, with a D/E ratio of 0.43. Net assets increased ¥5.4 billion from the end of the previous fiscal year, and the equity ratio was 50.5%. Operating cash flow was ¥5.7 billion.
| Item (¥100 million) | FY2025 (03/26 Result) | FY2024 (03/25 Result) | YoY (index, prior year=100) | FY2025 Company Forecast | Forecast Achievement Ratio |
|---|---|---|---|---|---|
| Net Sales | 1,723.7 | 1,573.4 | 110% | 1,640.0 | 105% |
| Gross Profit on Sales | 184.4 | 165.5 | 111% | Not announced | - |
| SG&A Expenses | 115.2 | 107.6 | 107% | Not announced | - |
| Operating Profit | 69.2 | 57.9 | 119% | 55.0 | 126% |
| Ordinary Profit | 60.8 | 49.3 | 123% | 49.0 | 124% |
| Net Profit Attributable to Shareholders of Parent Company | 49.6 | 35.2 | 141% | 39.0 | 127% |
| ROE | 11.5% | 8.9% | +2.6pt | Not announced | - |
| Exchange Rate (1 US dollar, yen) | 150.77 | 152.56 | -1.79 | Not announced | - |
Segment Results
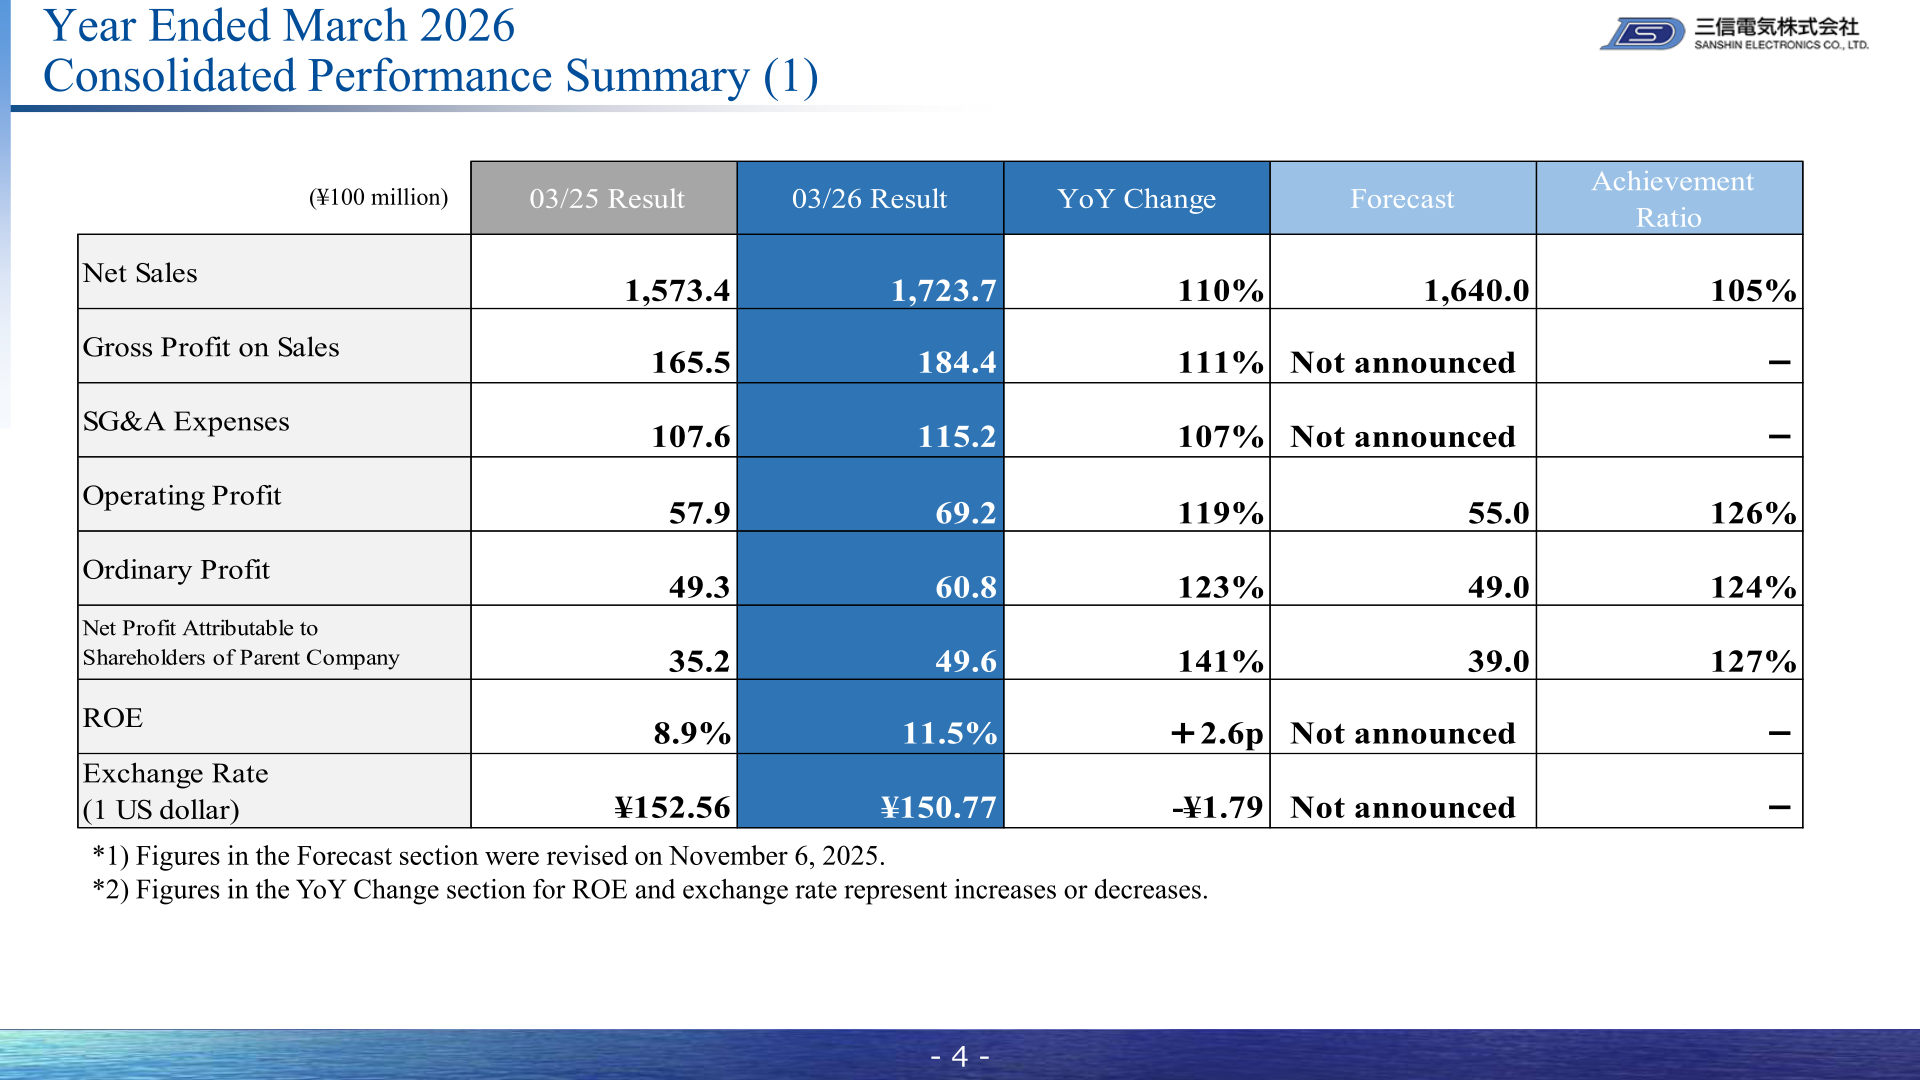
In the Device Business, net sales increased year on year, buoyed by firm sales of mechanical parts and products from overseas manufacturers as well as contributions throughout the fiscal year from new business in vehicle-mounted products; however, segment profit declined year on year amid a changing sales mix and an increase in SG&A expenses. In the Solution Business, trends were generally strong against a favorable business environment, paced by the network-system and platform business units; the company also secured large projects in equipment upgrading in the public sector, with some projects brought forward, resulting in all-time highs in both net sales and segment profit.
Within the Device Business, net sales by supplier category all rose year on year: mechanical parts manufacturers (up 6%, on overall firm trends except for mobile devices), overseas manufacturers (up 10%, on increases in wireless merchandise and analog semiconductors), and other manufacturers (up 8%, on an increase in vehicle-mounted products). Within the Solution Business, net sales rose year on year in NW Systems (up 37%, on favorable networking projects for large corporations), Platform (up 44%, on an increase in server-related sales), AP Systems (up 19%, on an increase in software development projects) and Imaging Systems (up 7%, on an increase in streaming projects), while Firefighting and Disaster Preparedness declined (down 28%, on a decrease in firefighting projects).
| Segment | Metric (¥100 million) | FY2025 (03/26 Result) | FY2024 (03/25 Result) | YoY Change |
|---|---|---|---|---|
| Device Business | Net Sales | 1,502.2 | 1,392.7 | +7.9% |
| Device Business | Segment Profit | 26.9 | 27.7 | -2.8% |
| Solution Business | Net Sales | 221.5 | 180.7 | +22.6% |
| Solution Business | Segment Profit | 33.8 | 21.6 | +56.6% |
| Total | Net Sales | 1,723.7 | 1,573.4 | +9.5% |
| Total | Segment Profit | 60.8 | 49.3 | +23.2% |
FY2026 Forecast
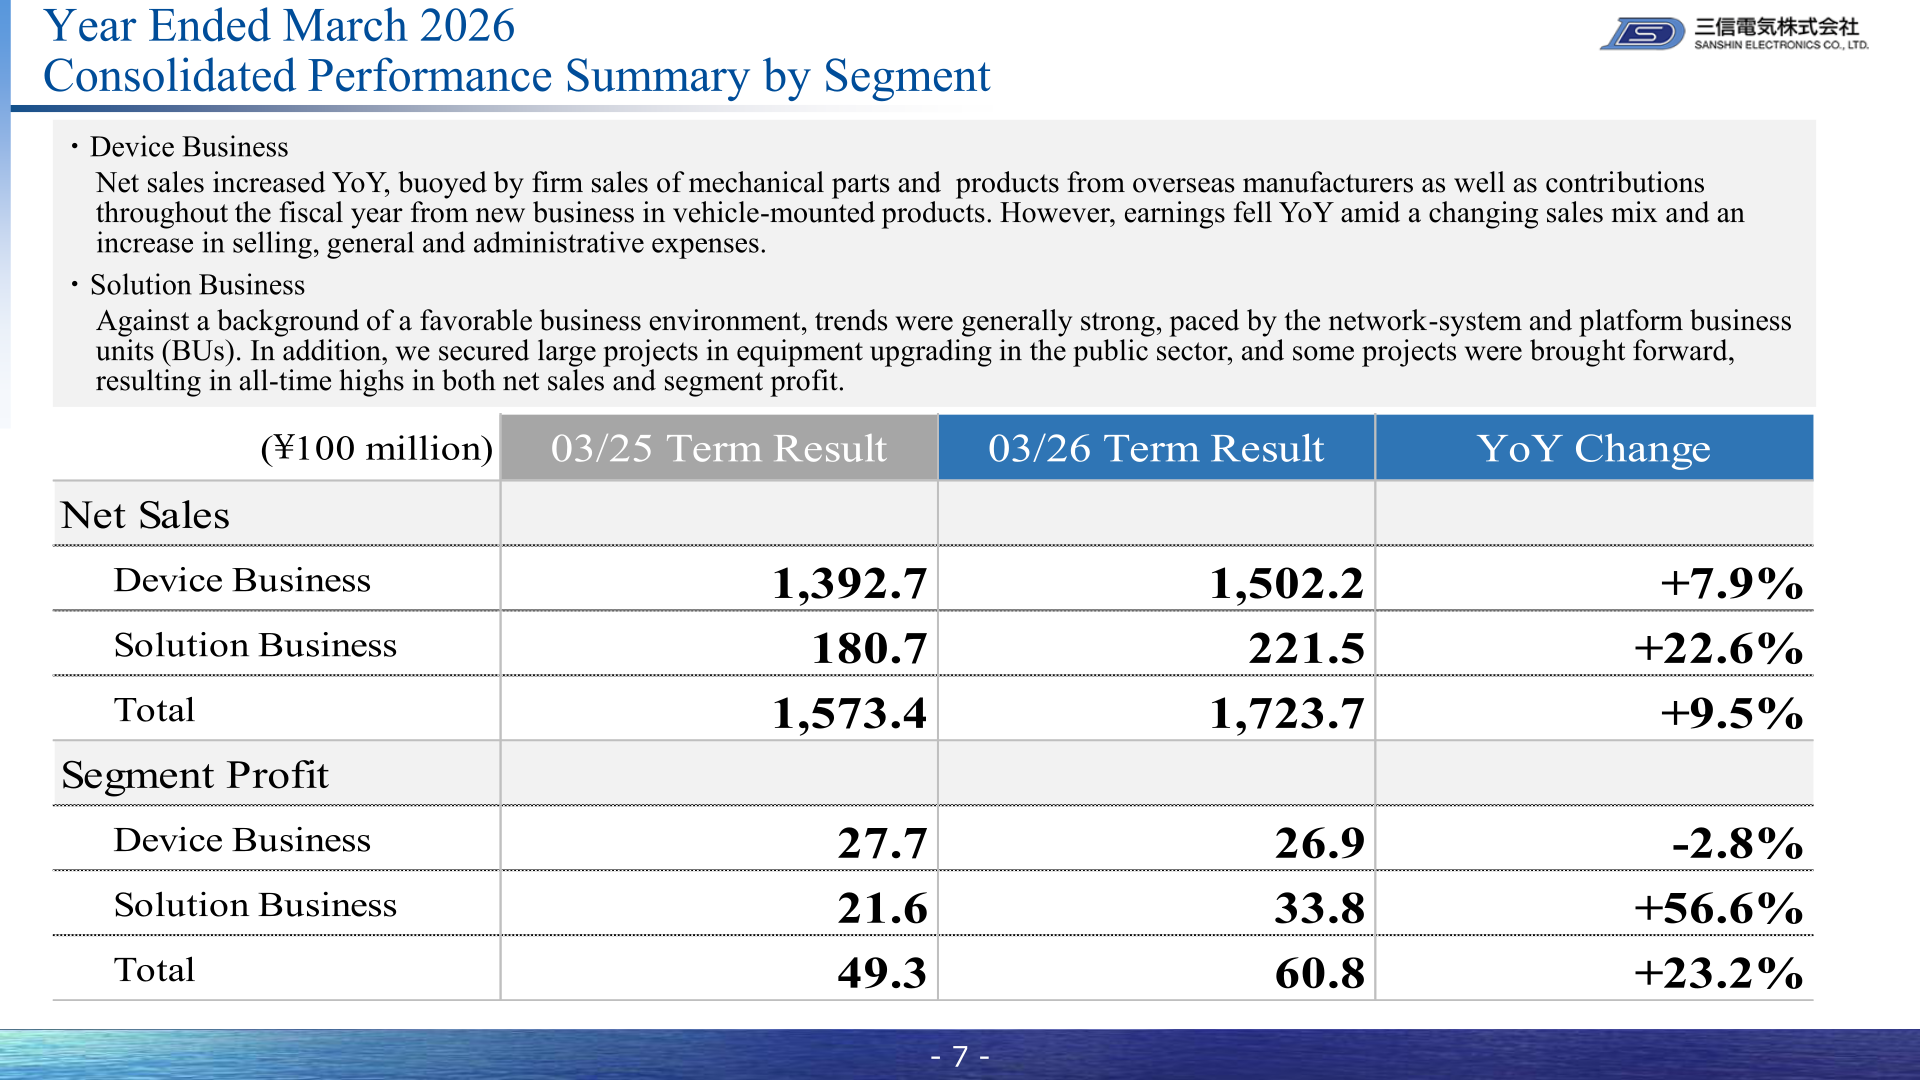
The company states that net sales are expected to increase year on year due to growth in the Device Business, while earnings are expected to decline year on year due to a reactionary drop in the Solution Business, which recorded record-high earnings under the influence of special demand in the year ended March 2026, as well as expenses associated with increased investment in human capital and redevelopment of the head-office building. By segment, net sales and segment profit in the Device Business are both expected to rise year on year, on sales for mobile applications and an increase in IPO (International Procurement Office) business, while net sales and segment profit in the Solution Business are both expected to decline year on year, reflecting the rebound from special demand in the previous fiscal year and expenses from organizational improvements such as increased personnel.
| Item (¥100 million) | FY2026 (03/27 Forecast) | FY2025 (03/26 Result) | YoY (index, prior year=100) |
|---|---|---|---|
| Net Sales | 1,860.0 | 1,723.7 | 108% |
| Gross Profit on Sales | 182.8 | 184.4 | 99% |
| SG&A Expenses | 127.3 | 115.3 | 110% |
| Operating Profit | 55.5 | 69.1 | 80% |
| Ordinary Profit | 50.0 | 60.8 | 82% |
| Net Profit Attributable to Shareholders of Parent Company | 36.0 | 49.6 | 73% |
| ROE | 8.0% | 11.5% | -3.5pt |
| Exchange Rate (1 US dollar, yen) | 145.00 | 150.77 | -5.77 |
Note: the presentation’s forecast-comparison table (P.26) shows the year ended March 2026 operating profit as 69.1 (¥100 million) and SG&A expenses as 115.3 (¥100 million), slightly different from the 69.2 and 115.2 shown on the results-summary page (P.4) for the same period. Both figures are as printed in the source material; the difference is a rounding artifact between the two separate summary tables.
| Segment | Metric (¥100 million) | FY2026 (03/27 Forecast) | FY2025 (03/26 Result) | YoY Change |
|---|---|---|---|---|
| Device Business | Net Sales | 1,641.0 | 1,502.2 | +9.2% |
| Device Business | Segment Profit | 30.0 | 26.9 | +11.4% |
| Solution Business | Net Sales | 219.0 | 221.5 | -1.1% |
| Solution Business | Segment Profit | 20.0 | 33.8 | -40.8% |
| Total | Net Sales | 1,860.0 | 1,723.7 | +7.9% |
| Total | Segment Profit | 50.0 | 60.8 | -17.8% |
Shareholder Returns
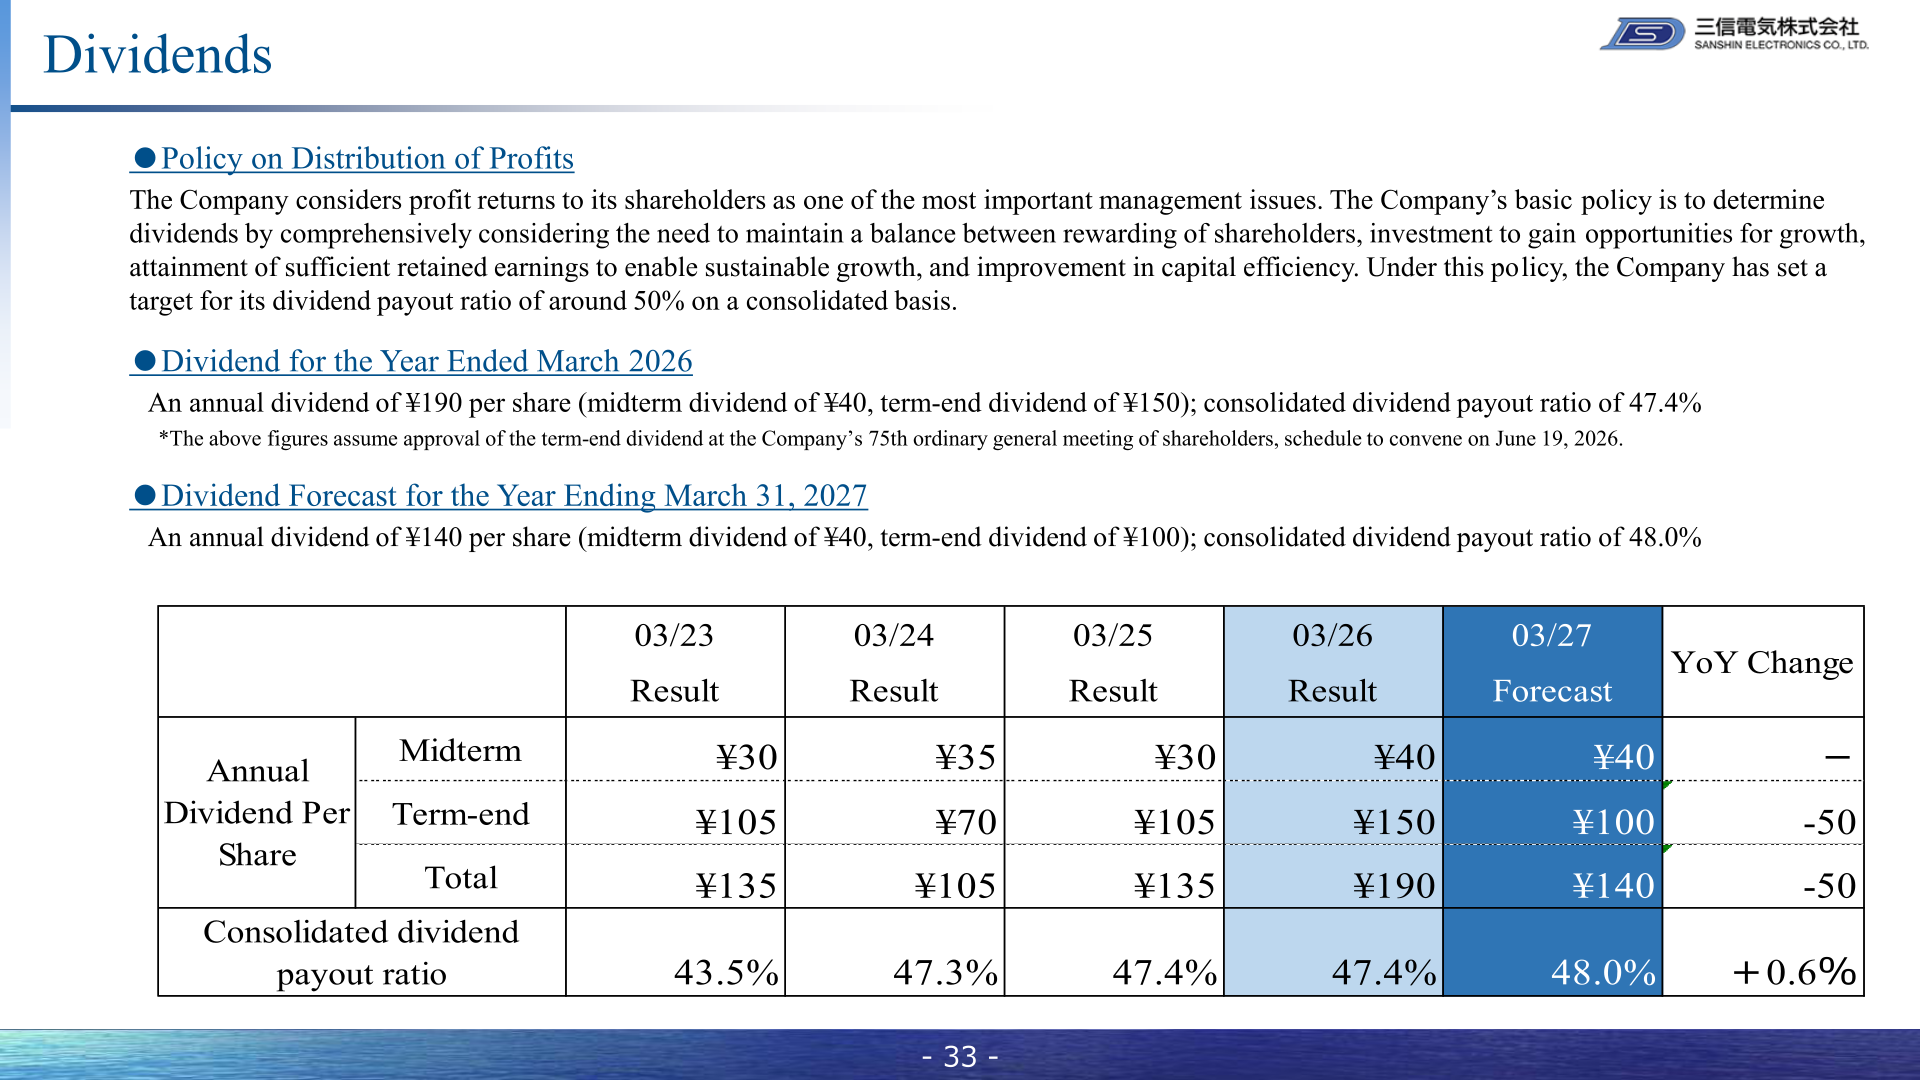
The company considers profit returns to shareholders one of its most important management issues, with a basic policy of determining dividends by comprehensively considering the balance between rewarding shareholders, investment for growth opportunities, retained earnings for sustainable growth, and improvement in capital efficiency; under this policy the company has set a target consolidated dividend payout ratio of around 50%. For the year ended March 2026, the annual dividend was ¥190 per share (interim dividend ¥40, year-end dividend ¥150), a consolidated payout ratio of 47.4%; the year-end dividend is subject to approval at the company’s 75th Ordinary General Meeting of Shareholders, scheduled to convene on June 19, 2026. For the year ending March 31, 2027, the company forecasts an annual dividend of ¥140 per share (interim dividend ¥40, year-end dividend ¥100), a consolidated payout ratio of 48.0%. Consolidated net profit per share was ¥404.89 for the year ended March 2026, up from ¥288.20 a year earlier.
| Fiscal Year | Interim Dividend | Year-End Dividend | Annual Dividend | Consolidated Payout Ratio |
|---|---|---|---|---|
| 03/23 Term (Result) | ¥30 | ¥105 | ¥135 | 43.5% |
| 03/24 Term (Result) | ¥35 | ¥70 | ¥105 | 47.3% |
| 03/25 Term (Result) | ¥30 | ¥105 | ¥135 | 47.4% |
| 03/26 Term (Result) | ¥40 | ¥150 | ¥190 | 47.4% |
| 03/27 Term (Forecast) | ¥40 | ¥100 | ¥140 | 48.0% |
V76 Medium-Term Management Plan / Topics
The year ended March 2026 was the second year of the three-year V76 Medium-Term Management Plan (April 1, 2024 – March 31, 2027). The plan’s final-year (fiscal year ending March 31, 2027) quantitative targets are ordinary profit of more than ¥5 billion, net profit of more than ¥3.5 billion, and ROE of 8% or more, with the aim of forming a business structure that achieves stable ROE of 8% or more. In the year ended March 2026, the company already exceeded all three targets one year ahead of schedule, with ordinary profit of ¥6.08 billion, net profit of ¥4.96 billion, and ROE of 11.5%. As part of the plan’s financial strategy, the company has set a target equity ratio of 40% to 45% (50.5% as of March 31, 2026), and as measures to improve capital efficiency it sold its Osaka Branch in May 2025 and completed the sale of seven cross-shareholding brands during the V76 plan period, while cash conversion cycle (CCC) improved from 105 days as of March 31, 2025 to 97 days as of March 31, 2026.
Under the plan, the company is advancing AI/DX initiatives to raise operating efficiency in both businesses. In the Device Business, this includes building a foundation for stable profitability in electronic devices, expanding mass-market customers (including automobiles, HVAC and India) and growing original solutions such as EMS business and development of SiC modules for automotive applications. In the Solution Business, initiatives include improving profitability in the Application and Platform business units and stable growth in the Network Systems and Imaging Systems business units, alongside expansion of the Firefighting and Disaster Preparedness business.
This article is an analysis based on publicly available information and is not a recommendation to buy or sell any specific securities. Investment decisions are your own responsibility.
















