
This article is based on publicly available IR materials and is not a recommendation to buy or sell any specific securities.
Note: KOMEDA Holdings has a February fiscal year-end. This article covers the fiscal year ended February 28, 2026, which the company itself labels “FY2025”; the following year’s forecast is labeled “FY2026” in the company’s materials.
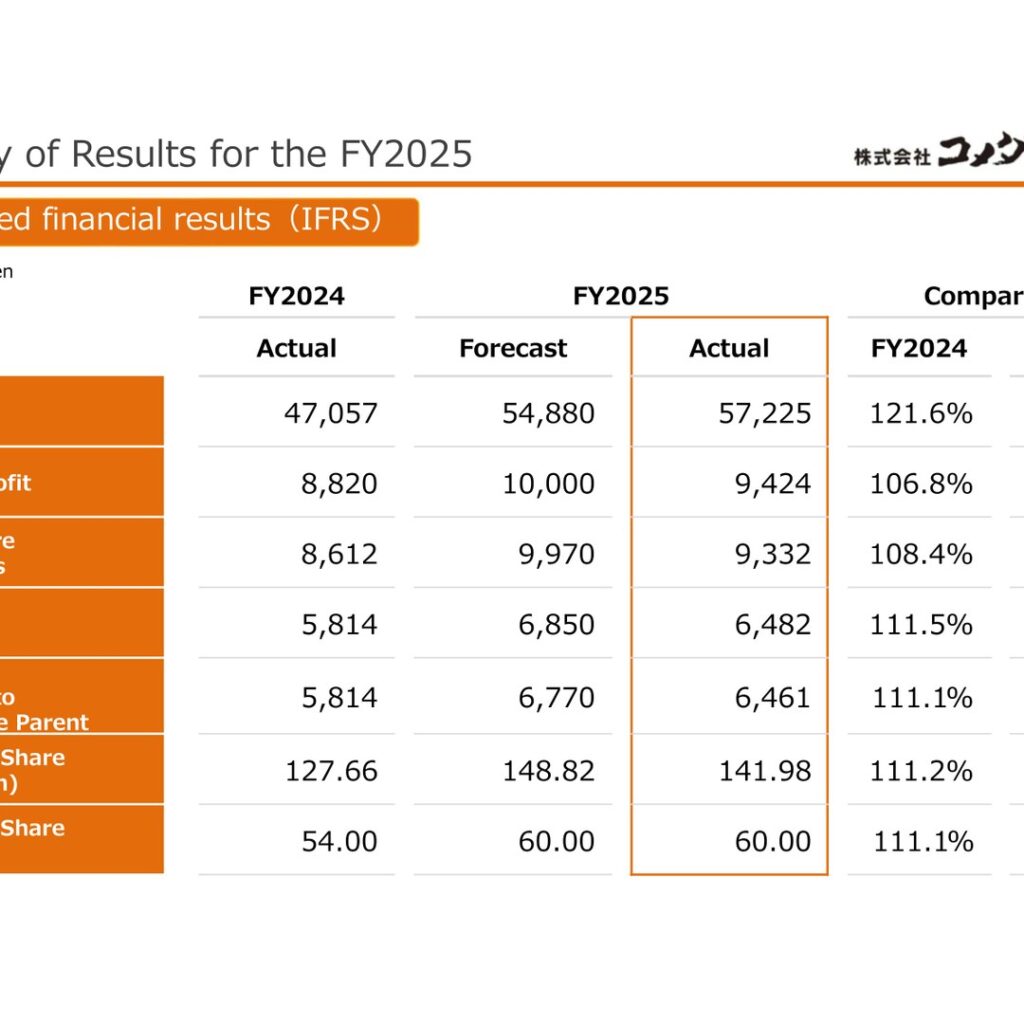
On April 10, 2026, KOMEDA Holdings Co., Ltd. released its “Financial Results for the Fiscal Year Ended February 28, 2026 (FY2025)” together with presentation materials for its new Medium-term Management Plan “CONNECT 2030” (IFRS). Revenue was 57,225 million yen (121.6% of FY2024), operating profit 9,424 million yen (106.8%) and net income attributable to owners of the parent 6,461 million yen (111.1%). Against the company’s forecast, revenue came in at 104.3% while operating profit reached 94.2%. The annual dividend was 60.00 yen per share, in line with the forecast, and the company forecasts 62.00 yen for FY2026.
Consolidated Results (Full-Year Actual)
Revenue rose from 47,057 million yen to 57,225 million yen. In the revenue bridge, wholesales increased by a total of 4,495 million yen (same-store sales +3,064 million yen, closed stores (58) million yen, newly opened stores +1,489 million yen), company-owned stores contributed +1,655 million yen, store development (293) million yen, lease +65 million yen, Singapore +4,143 million yen, Taiwan +227 million yen and others (124) million yen. POON RESOURCES PTE. LTD. in Singapore became a consolidated subsidiary as of March 1, 2025.
| Item (Millions of yen) | FY2024 Actual | FY2025 Forecast | FY2025 Actual | Compared to FY2024 | Compared to Forecast |
|---|---|---|---|---|---|
| Revenue | 47,057 | 54,880 | 57,225 | 121.6% | 104.3% |
| Operating profit | 8,820 | 10,000 | 9,424 | 106.8% | 94.2% |
| Income before income taxes | 8,612 | 9,970 | 9,332 | 108.4% | 93.6% |
| Net income | 5,814 | 6,850 | 6,482 | 111.5% | 94.6% |
| Net income attributable to owners of the parent | 5,814 | 6,770 | 6,461 | 111.1% | 95.4% |
| Earnings per share (basic) (Yen) | 127.66 | 148.82 | 141.98 | 111.2% | 95.4% |
| Dividend per share (Yen) | 54.00 | 60.00 | 60.00 | 111.1% | 100.0% |
In the operating profit bridge from 8,820 million yen to 9,424 million yen, the increase in gross profit due to revenue increase added 2,008 million yen, while the increase in the cost of food ingredients and utilities (due to the soaring prices of key raw materials such as coffee beans) reduced profit by 1,225 million yen. Other factors were the increase in logistics costs due to revenue increase (129) million yen, expenses of shareholder benefit and voting incentive (52) million yen, Singapore +188 million yen, Taiwan +13 million yen, impairment loss (166) million yen and others (33) million yen.
As of February 28, 2026, total assets were 110,385 million yen (105,739 million yen a year earlier), including goodwill of 39,789 million yen (38,354 million yen), and total equity was 50,154 million yen (45,618 million yen). Net cash provided by operating activities was 12,353 million yen (11,235 million yen in FY2024), net cash used in investing activities was (4,773) million yen (642 million yen provided in FY2024), and free cash flows were 7,580 million yen (11,877 million yen). Cash and cash equivalents at the end of the period were 8,859 million yen.
Segment Results
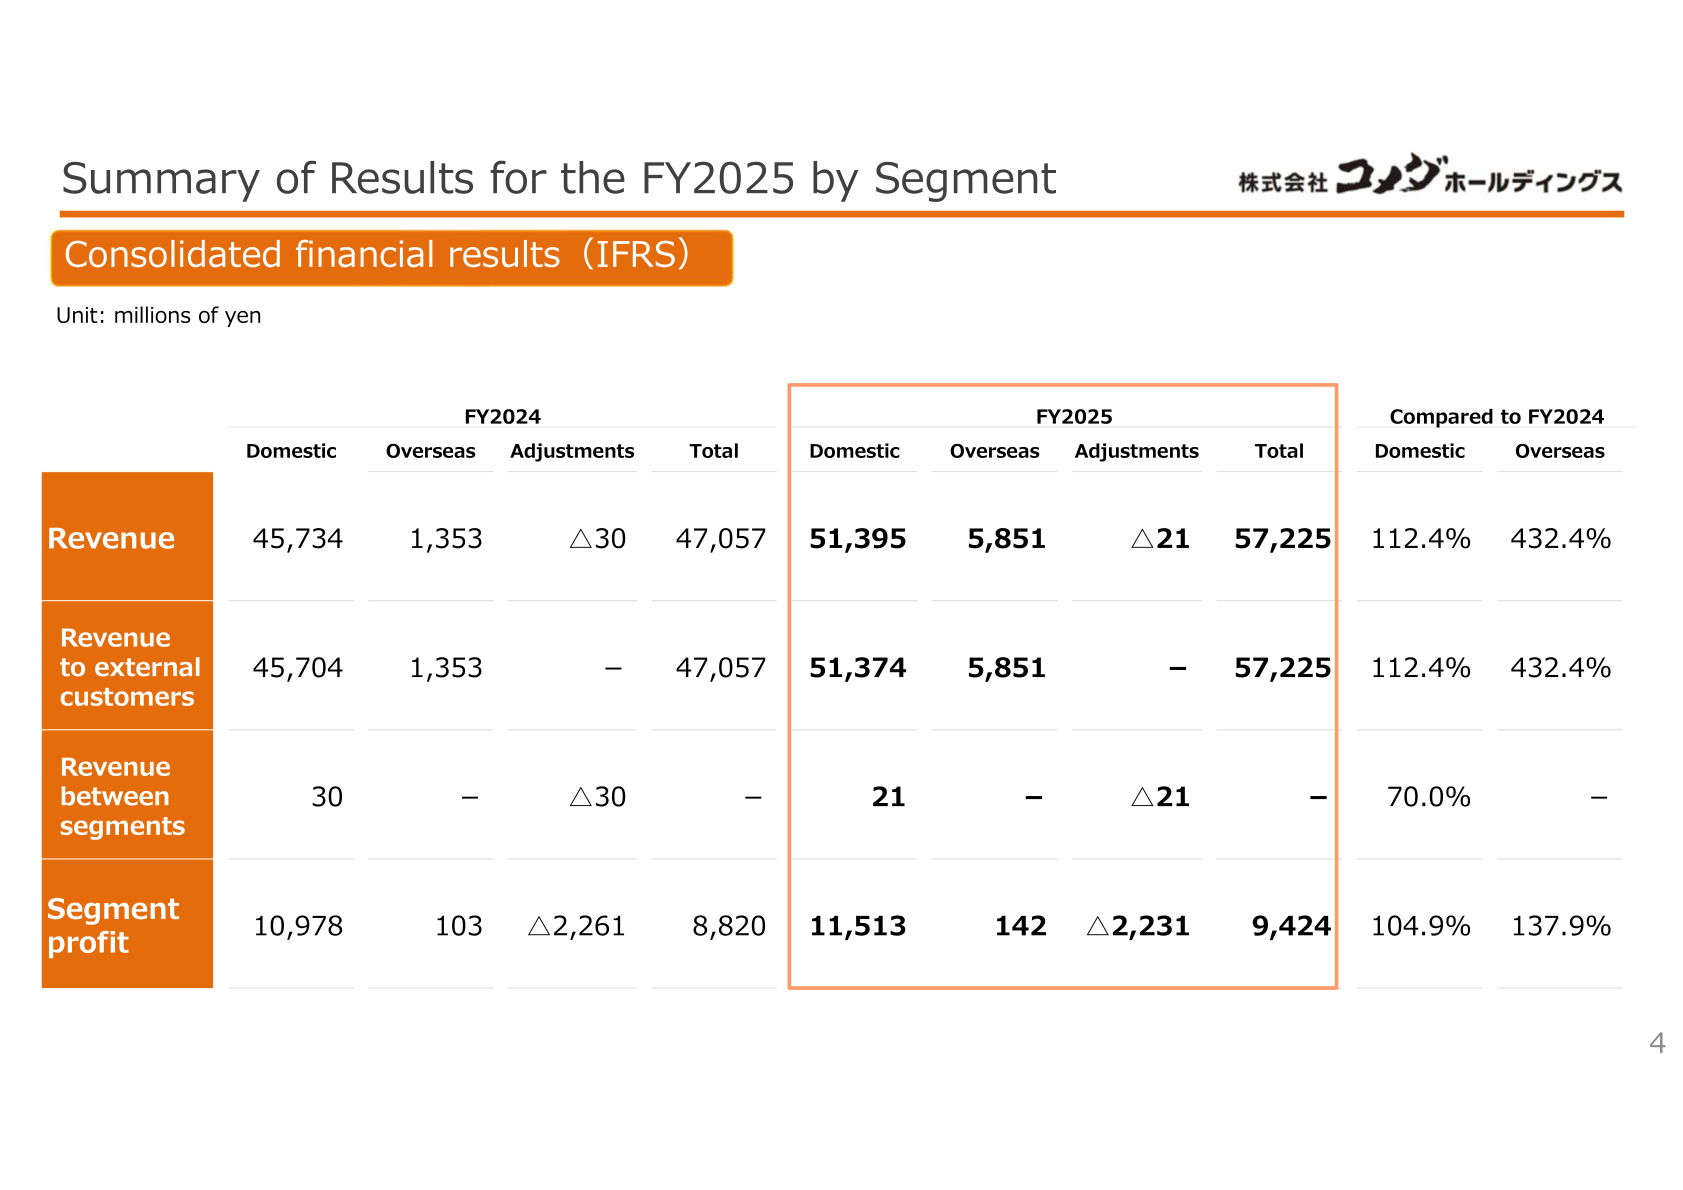
The Domestic segment recorded revenue of 51,395 million yen (112.4% of FY2024) and segment profit of 11,513 million yen (104.9%). The Overseas segment recorded revenue of 5,851 million yen (432.4%) and segment profit of 142 million yen (137.9%).
| Segment (Millions of yen) | Revenue FY2024 | Revenue FY2025 | Compared to FY2024 | Segment profit FY2024 | Segment profit FY2025 | Compared to FY2024 |
|---|---|---|---|---|---|---|
| Domestic | 45,734 | 51,395 | 112.4% | 10,978 | 11,513 | 104.9% |
| Overseas | 1,353 | 5,851 | 432.4% | 103 | 142 | 137.9% |
| Adjustments | △30 | △21 | - | △2,261 | △2,231 | - |
| Total | 47,057 | 57,225 | - | 8,820 | 9,424 | - |
The total number of stores increased by a net 67 (74 opened, 7 closed) to 1,150 at the end of FY2025. Overseas stores rose from 48 to 83, including the acquisition of a total of 30 stores under the three brands “Kaffe & Toast,” “Saap Saap Thai” and “Ma Mum” as a result of POON RESOURCES PTE. LTD. becoming a consolidated subsidiary, and four “BLUE LEAF CAFE” stores acquired by a consolidated subsidiary as of May 1, 2025.
| Region (Stores) | FY2023 | FY2024 | FY2025 | Opened | Closed | Net change |
|---|---|---|---|---|---|---|
| East Japan | 337 | 364 | 379 | 15 | – | +15 |
| Central Japan | 314 | 319 | 322 | 7 | 4 | +3 |
| West Japan | 333 | 352 | 366 | 14 | – | +14 |
| Overseas | 39 | 48 | 83 | 38 | 3 | +35 |
| Total | 1,023 | 1,083 | 1,150 | 74 | 7 | +67 |
FY2026 Forecast
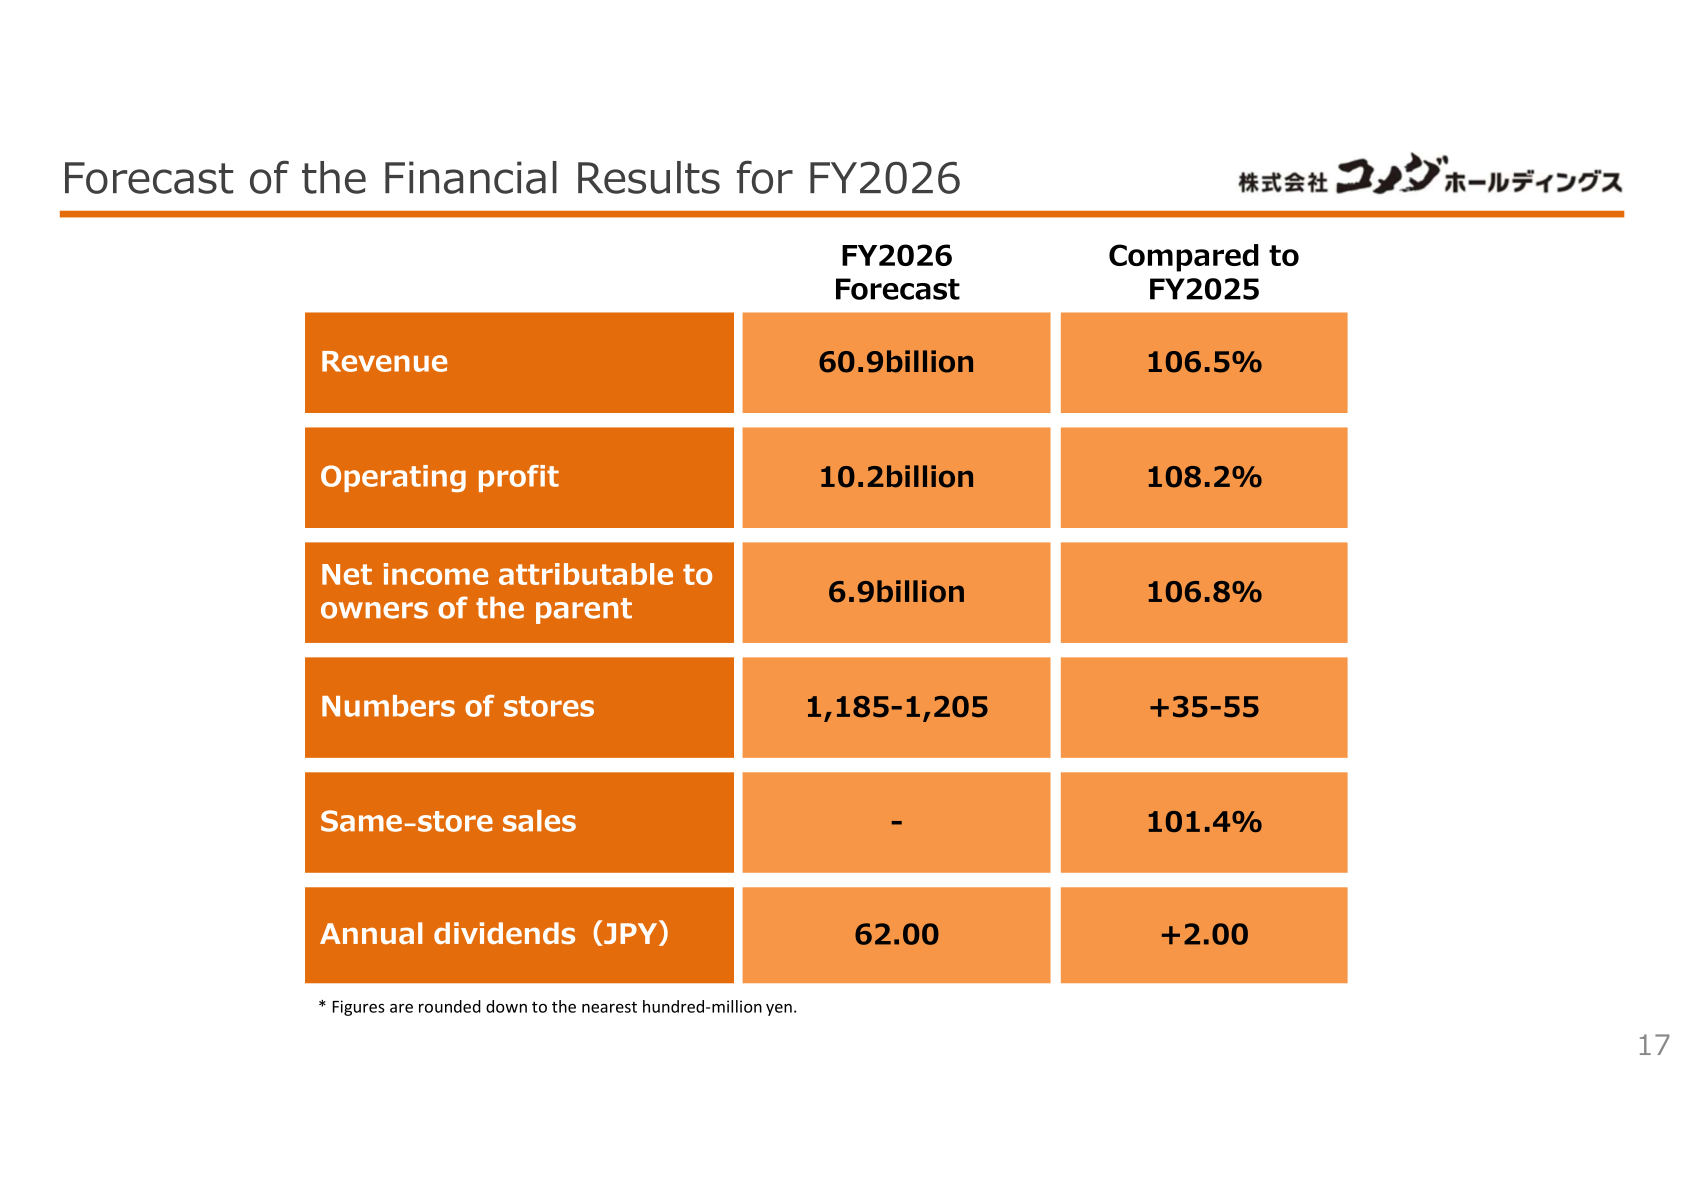
For FY2026, the company forecasts revenue of 60.9 billion yen (106.5% of FY2025), operating profit of 10.2 billion yen (108.2%) and net income attributable to owners of the parent of 6.9 billion yen (106.8%). The number of stores is planned at 1,185-1,205 (+35-55), same-store sales at 101.4%, and annual dividends at 62.00 yen (+2.00 yen). Forecast figures are rounded down to the nearest hundred-million yen.
| Item | FY2026 Forecast | Compared to FY2025 |
|---|---|---|
| Revenue | 60.9 billion yen | 106.5% |
| Operating profit | 10.2 billion yen | 108.2% |
| Net income attributable to owners of the parent | 6.9 billion yen | 106.8% |
| Number of stores | 1,185-1,205 | +35-55 |
| Same-store sales | – | 101.4% |
| Annual dividends (Yen) | 62.00 | +2.00 |
Shareholder Returns
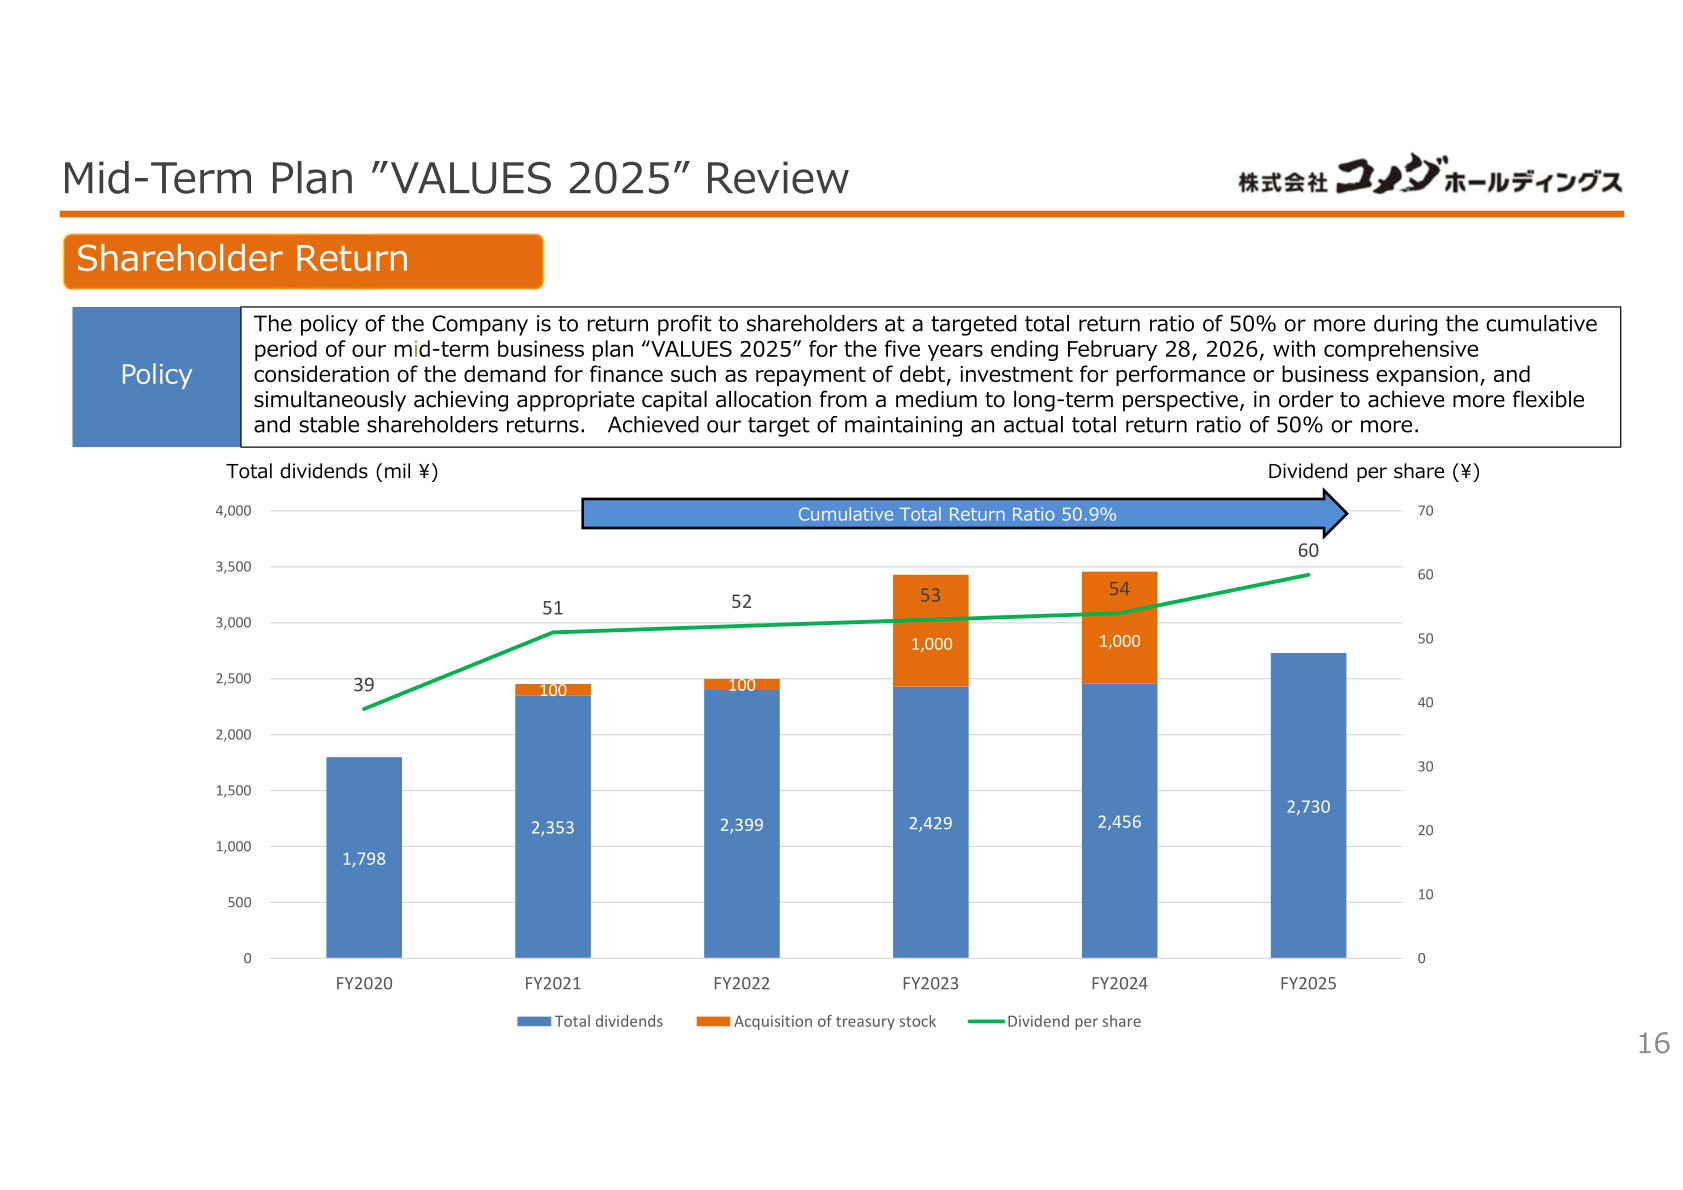
Under the previous mid-term plan “VALUES 2025” (five years ending February 28, 2026), the company’s policy was to return profit to shareholders at a targeted total return ratio of 50% or more over the cumulative period. The cumulative total return ratio was 50.9%, achieving the target. Dividend per share rose from 54 yen in FY2024 to 60 yen in FY2025, and 62.00 yen is forecast for FY2026. Under the new plan “CONNECT 2030,” the company will target a total return ratio of 50% or more during the cumulative period of the five years ending February 28, 2031.
Medium-Term Management Plan
Review of “VALUES 2025”: EPS grew at a CAGR of 12.8% to 141.98 yen, falling short of the annual growth target of 13% or higher. ROIC in the final year was 11.8% (target: 11.5% or higher) and the equity ratio was 45.2% (target: 40% or higher), both achieving their targets.
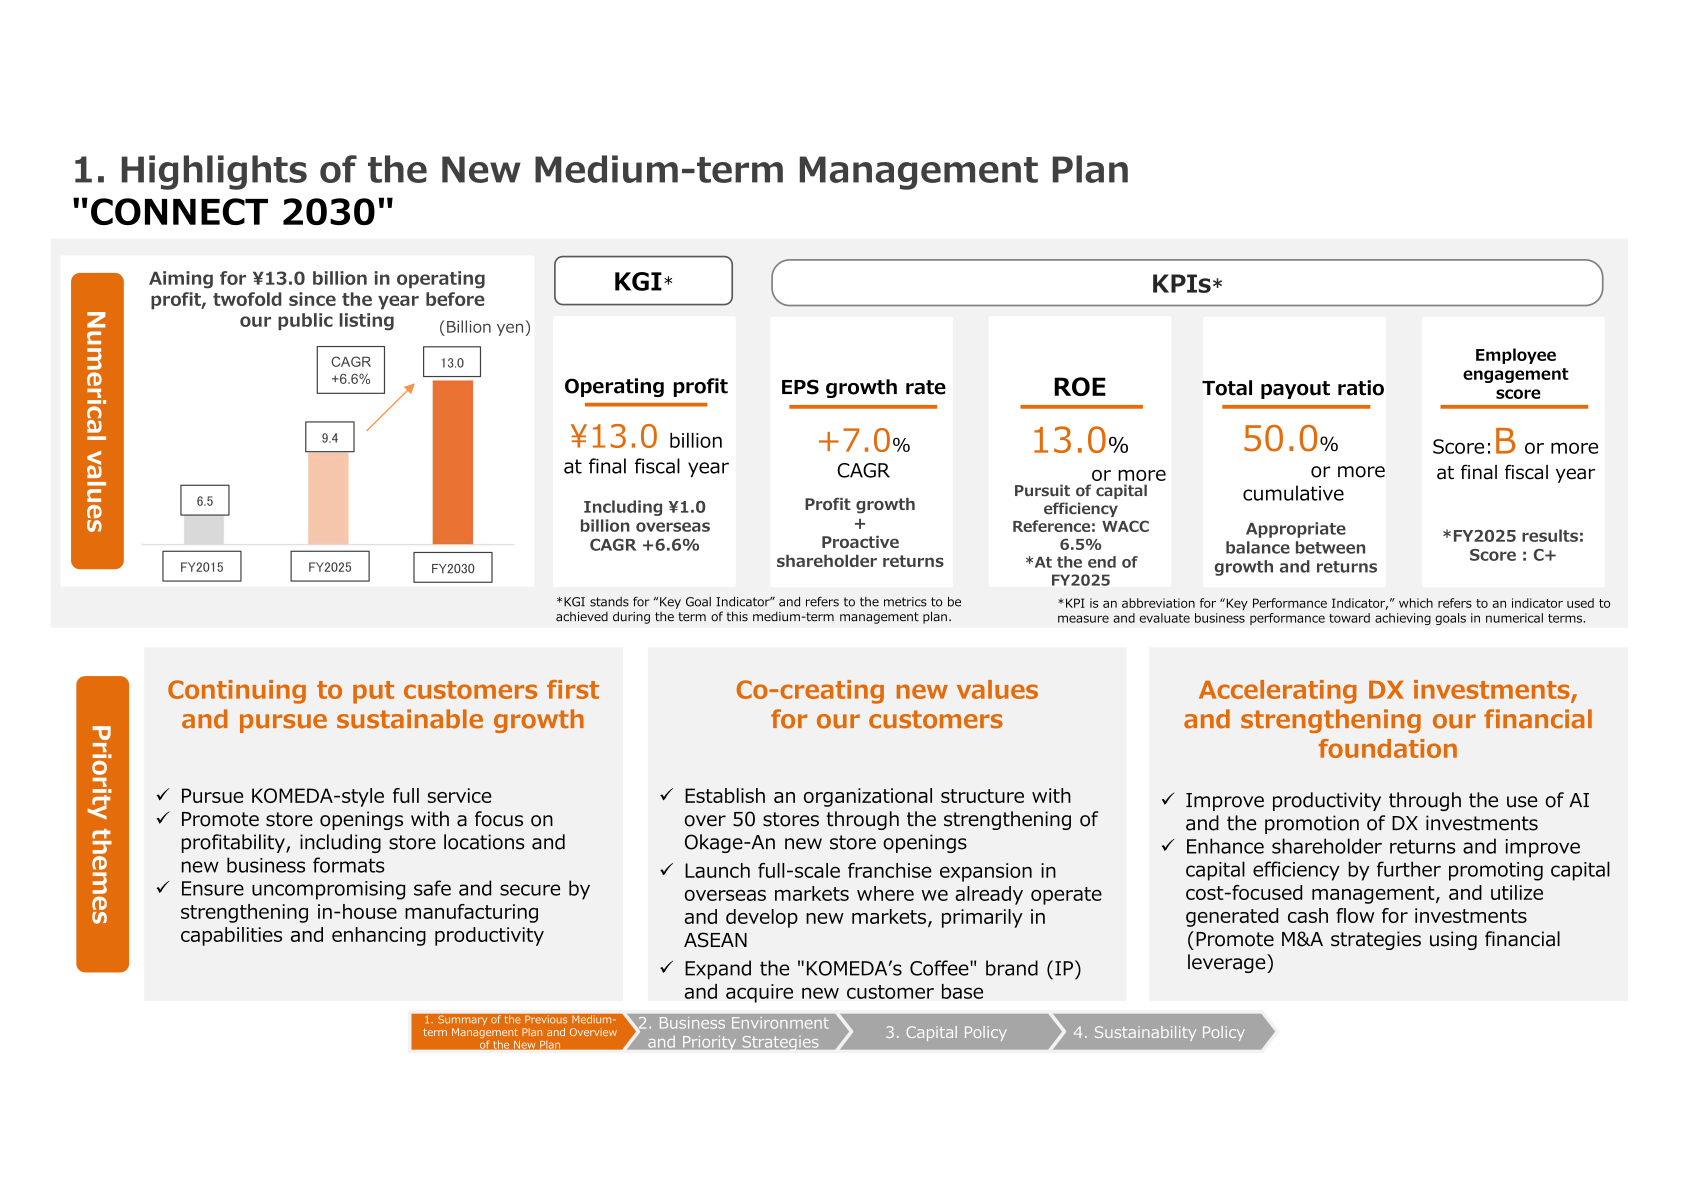
New plan “CONNECT 2030”: Under the vision “Connecting People, Communities, and the World through KUTSUROGI,” the KGI is operating profit of ¥13.0 billion in the final fiscal year (including ¥1.0 billion overseas; CAGR +6.6%), twofold since the year before the company’s public listing. KPIs are an EPS growth rate of +7.0% (CAGR), ROE of 13.0% or more (reference: WACC 6.5% at the end of FY2025), a cumulative total payout ratio of 50.0% or more, and an employee engagement score of B or more in the final fiscal year (FY2025 result: C+). Priority measures include a total of 1,400 Group stores (including 180 overseas), expanding Okage-An to over 50 stores primarily in metropolitan areas, an overseas network of 180 stores with segment profit of ¥1.0 billion, brand utilization through licensing and e-Gifts, and AI and DX investments. The cash allocation plan envisions approx. ¥50.0 billion of 5-year cumulative operating cash flow plus financial leverage/debt financing funding ¥70.0 billion, comprising growth investments of ¥50.0 billion (existing business investments ¥20.0 billion and M&A/new businesses ¥30.0 billion) and shareholder returns of ¥20.0 billion.
This article is an analysis based on publicly available information and is not a recommendation to buy or sell any specific securities. Investment decisions are your own responsibility.
















