
This article is based on publicly available IR materials and is not a recommendation to buy or sell any specific securities.
Note: JPMC (Japan Property Management Center Co.,Ltd.) does not publish an English results presentation; this article is an English translation of the Japanese-language article on our sister site Investalk, which is based on the company’s Japanese-language IR materials (its most recent full-year results materials), with figures transcribed as reported. The company has a December fiscal year-end; its most recent completed full year (the fiscal year ended December 31, 2025) is classified here as FY2025.
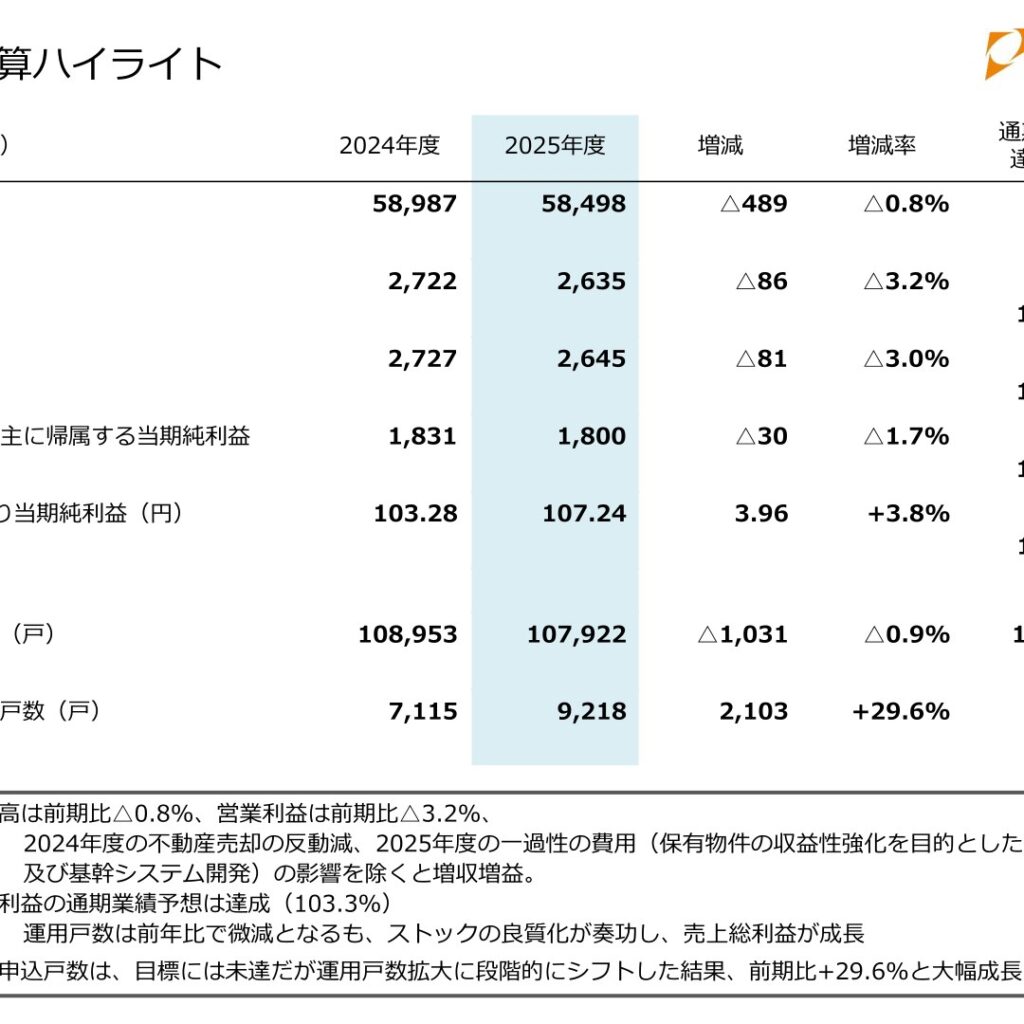
JPMC announced its results for the fiscal year ended December 2025 (full year). Net sales were 58,498 million yen (down 0.8% year on year) and operating profit was 2,635 million yen (down 3.2%), but operating profit achieved 103.3% of the full-year forecast of 2,550 million yen. The company states that, excluding the reactionary decline from the real-estate sales in fiscal 2024 and one-off costs associated with repairs and core-system development aimed at strengthening the profitability of its managed properties, sales and profit increased. New application units, which will affect results from fiscal 2026 onward, came to 9,218 units; although short of the target, this was a substantial 29.6% increase year on year.
Consolidated Results (Fiscal Year Ended December 2025, Actual)
Net sales were 58,498 million yen (down 0.8% year on year; 97.5% of the full-year plan), operating profit was 2,635 million yen (down 3.2% year on year; 103.3% of the full-year plan), ordinary profit was 2,645 million yen (down 3.0% year on year; 103.7% of the full-year plan), and profit attributable to owners of parent was 1,800 million yen (down 1.7% year on year; 106.6% of the full-year plan). Earnings per share were 107.24 yen (up 3.8% year on year; 111.3% of the full-year plan). Units under management totaled 107,922 (down 0.9% year on year), and new application units totaled 9,218 (up 29.6% year on year).
| Item | FY2024 | FY2025 | Change |
|---|---|---|---|
| Net sales (million yen) | 58,987 | 58,498 | △0.8% |
| Operating profit (million yen) | 2,722 | 2,635 | △3.2% |
| Ordinary profit (million yen) | 2,727 | 2,645 | △3.0% |
| Profit attributable to owners of parent (million yen) | 1,831 | 1,800 | △1.7% |
| Earnings per share (yen) | 103.28 | 107.24 | +3.8% |
| Units under management (units) | 108,953 | 107,922 | △0.9% |
| New application units (units) | 7,115 | 9,218 | +29.6% |
Sales by Category (Stock / Flow)
By sales category, property management revenue, the mainstay of stock revenue, was 54,004 million yen (up 0.3% year on year), PM ancillary business revenue was 2,727 million yen (up 2.5%), rent arrears guarantee was 809 million yen (up 2.5%), and the insurance business was 1,667 million yen (up 4.9%). JPMC Hikari was 250 million yen (down 14.0% year on year), and other revenue was 1,766 million yen (of which the renovation business accounted for 936 million yen). The company states that, while gross profit from property management revenue grew steadily on the back of the expansion in units under management and improved profitability, net sales themselves rose only slightly because of an increase in the proportion of services whose sales are presented on a net (offset) basis under the accounting treatment.
| Item | FY2024 | FY2025 | FY2026 (Plan) | Change (vs. FY2025) |
|---|---|---|---|---|
| Property management revenue (million yen) | 53,778 | 54,004 | 54,154 | +0.3% |
| PM ancillary business revenue (million yen) | 2,593 | 2,727 | 2,794 | +2.5% |
| Rent arrears guarantee (million yen) | 774 | 809 | 829 | +2.5% |
| Insurance business (million yen) | 1,547 | 1,667 | 1,749 | +4.9% |
| JPMC Hikari (million yen) | 271 | 250 | 215 | △14.0% |
| Other revenue (million yen) | 2,616 | 1,766 | 2,550 | +44.4% |
| Net sales (million yen) | 58,987 | 58,498 | 59,500 | +1.7% |
Full-Year Forecast (Fiscal Year Ending December 2026)
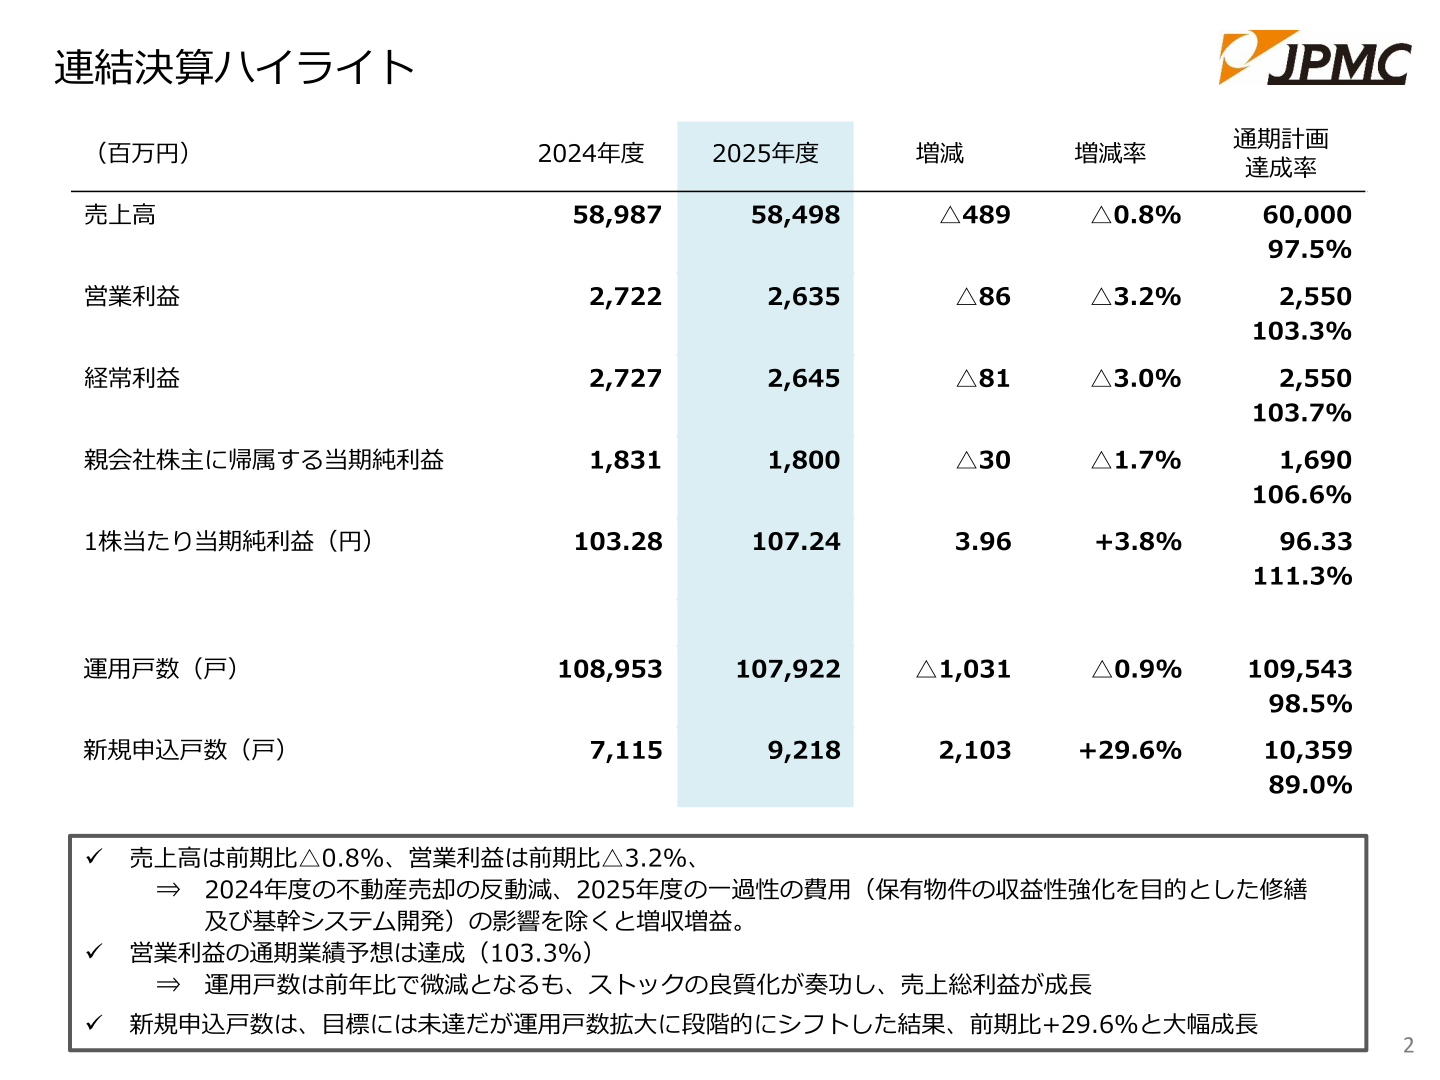
The consolidated forecast for the fiscal year ending December 2026 calls for net sales of 59,500 million yen (up 1.7% year on year), operating profit of 2,900 million yen (up 10.0%), ordinary profit of 2,910 million yen (up 10.0%), and profit attributable to owners of parent of 1,980 million yen (up 10.0%). Earnings per share are expected to be 118.00 yen (up 10.0%). The company states that, centered on its stock business, it aims for record-high operating profit of 2,900 million yen. It plans for 109,000 units under management (up 1.0% year on year) and 9,300 new application units (up 0.9%).
| Item | FY2025 (Actual) | FY2026 (Plan) | Change |
|---|---|---|---|
| Net sales (million yen) | 58,498 | 59,500 | +1.7% |
| Operating profit (million yen) | 2,635 | 2,900 | +10.0% |
| Ordinary profit (million yen) | 2,645 | 2,910 | +10.0% |
| Profit attributable to owners of parent (million yen) | 1,800 | 1,980 | +10.0% |
| Earnings per share (yen) | 107.24 | 118.00 | +10.0% |
| Units under management (units) | 107,922 | 109,000 | +1.0% |
| New application units (units) | 9,218 | 9,300 | +0.9% |
| Annual dividend per share (yen) | 60.00 | 64.00 | +6.7% |
Shareholder Returns
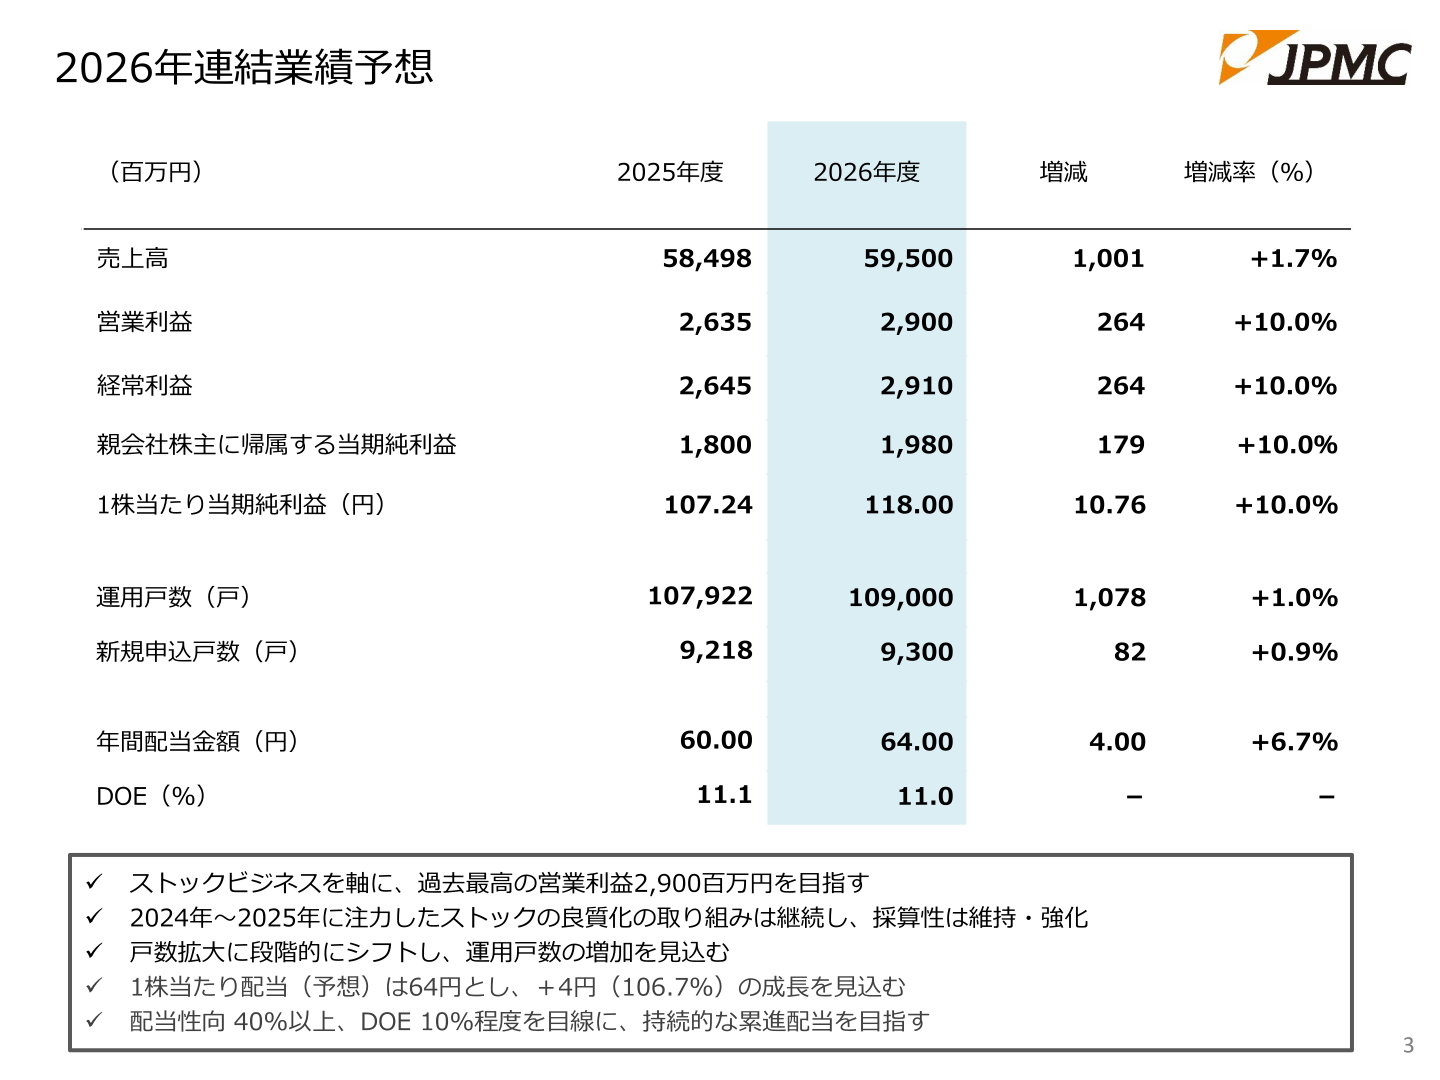
The company continues its policy of consecutive dividend increases (progressive dividends). The fiscal year ended December 2025 marked the sixth consecutive year of dividend increases: the year-end dividend was set at 31 yen, an increase of 2 yen, and as a result the annual dividend was raised to 60 yen from the previously planned 58 yen (55 yen in the prior year). The payout ratio was 55.9%. The annual dividend forecast for the fiscal year ending December 2026 is 64 yen (an increase of 4 yen from the previous year; 106.7%), and the company states that it aims for sustainable progressive dividends with a payout ratio of 40% or more and DOE of around 10% as benchmarks. In addition, in the first half of 2025 the company carried out a share buyback of 1 billion yen and cancelled 1,300,000 shares of treasury stock, equivalent to 6.83% of the total number of shares issued.
| Item | FY2024 | FY2025 | FY2026 (Forecast) |
|---|---|---|---|
| Annual dividend per share (yen) | 55.00 | 60.00 | 64.00 |
| Payout ratio (%) | 53.3% | 55.9% | 40% or more (benchmark) |
| DOE (%) | 10.8% | 11.1% | 11.0% |
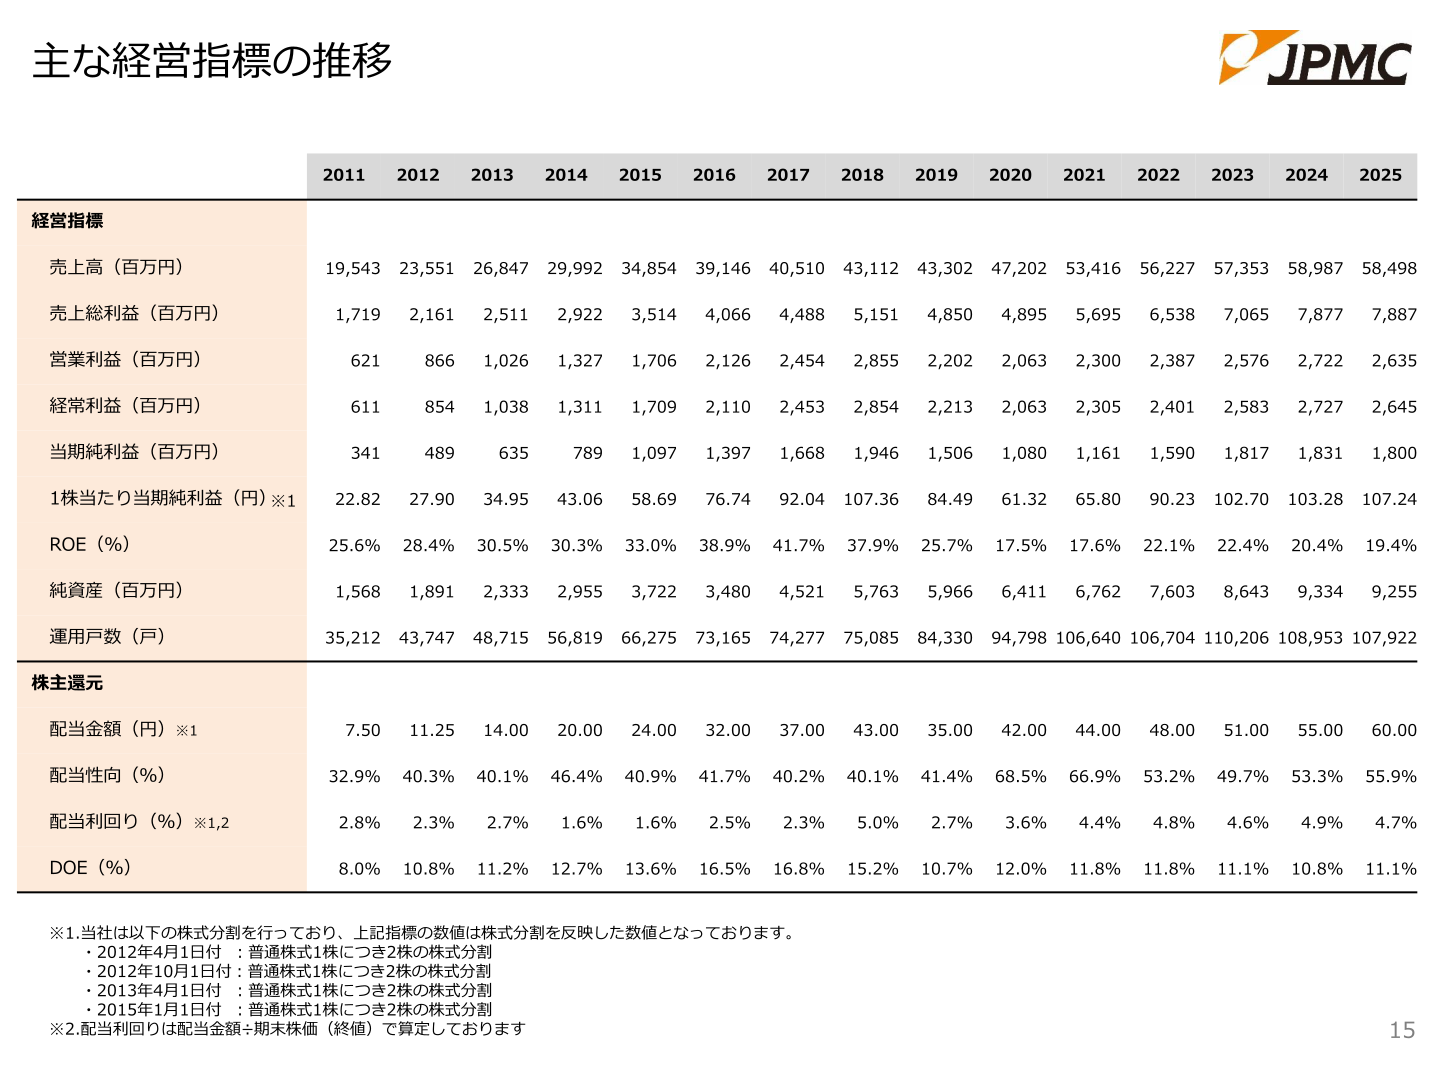
Trends in Key Management Indicators
Looking at the trends since 2011 presented in the materials, net sales have grown from 19,543 million yen (2011) to 58,498 million yen (2025), and units under management have expanded from 35,212 to 107,922. ROE stood at 19.4% as of 2025, and DOE has exceeded 10% for 14 consecutive years; the company states that it has maintained levels above its cost of shareholders’ equity (which the company recognizes as roughly 7–9%).
This article is an analysis based on publicly available information and is not a recommendation to buy or sell any specific securities. Investment decisions are your own responsibility.
















