
This article is based on publicly available IR materials and is not a recommendation to buy or sell any specific securities.
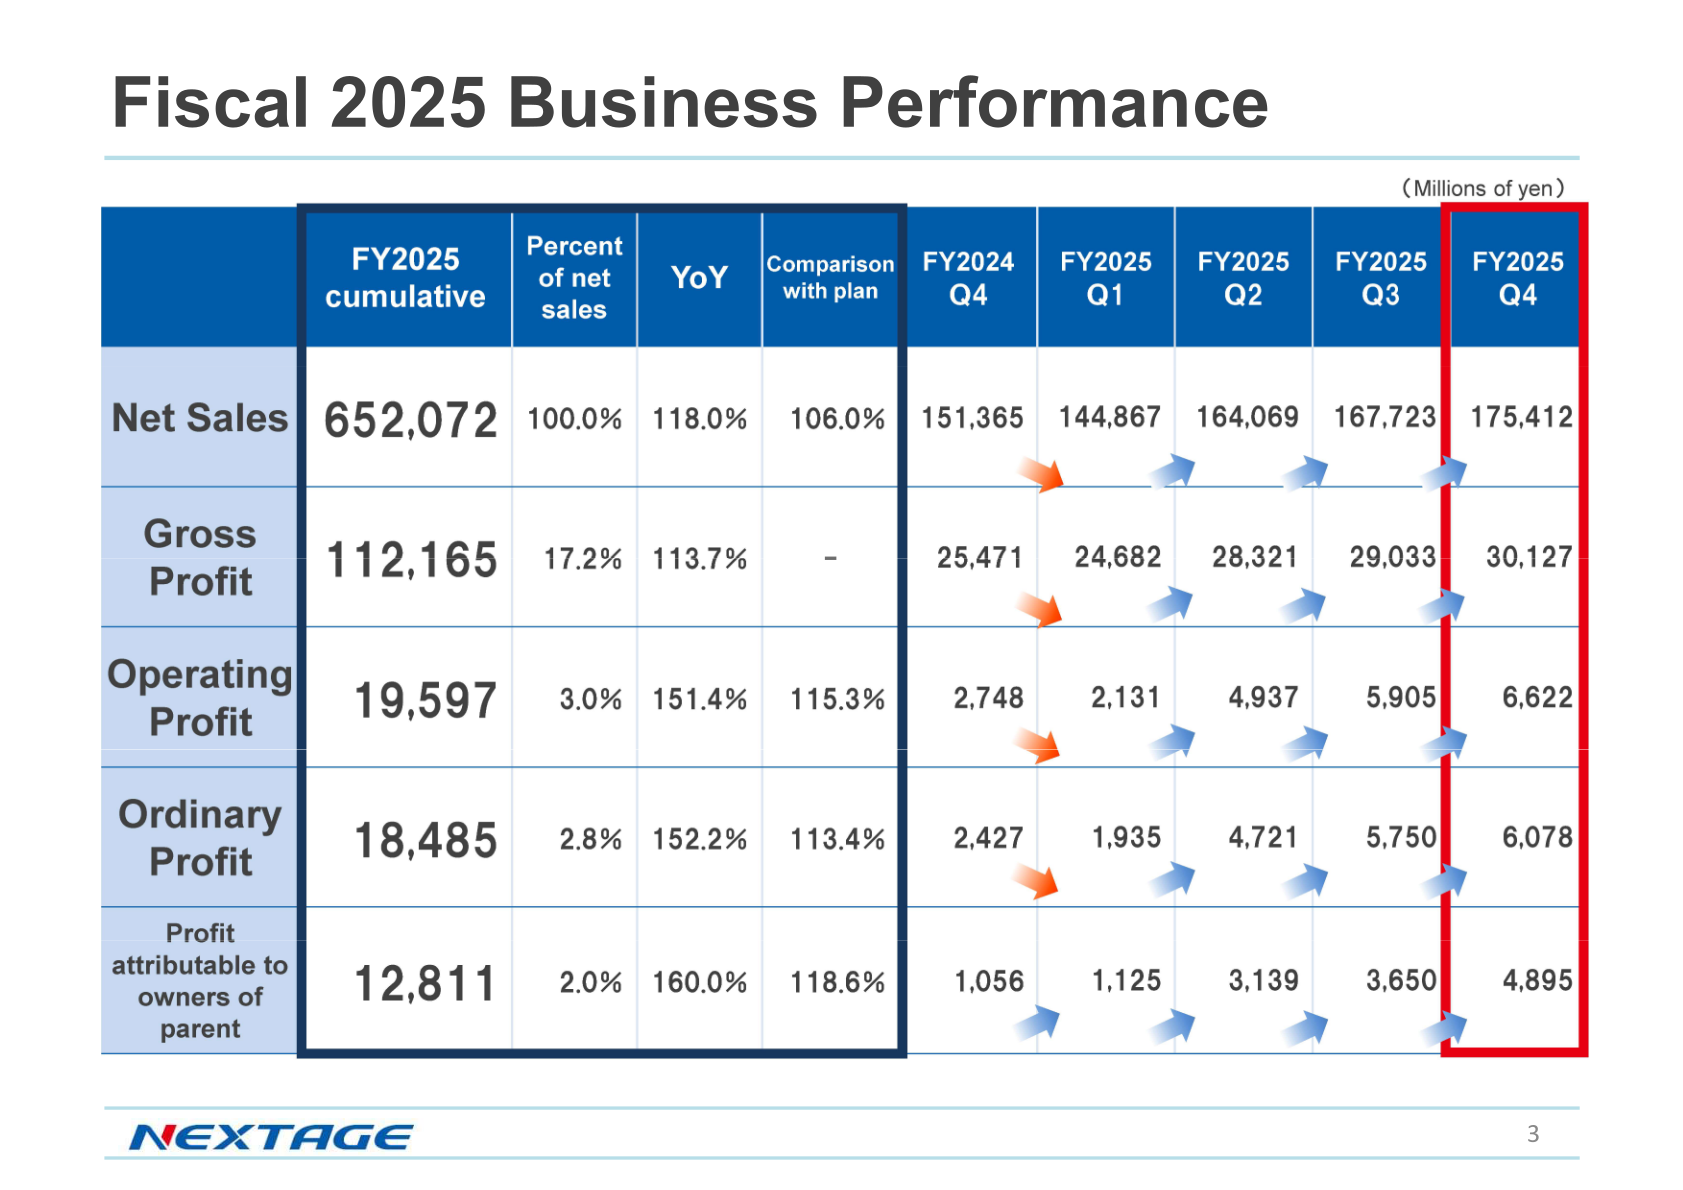
NEXTAGE Co., Ltd. (3186), an operator of new and used car dealerships, reported higher sales and profits for the fiscal year ended November 30, 2025 (FY2025). Net sales rose 18.0% year on year to ¥652,072 million and operating profit increased 51.4% to ¥19,597 million. Ordinary profit grew 52.2% to ¥18,485 million and profit attributable to owners of parent rose 60.0% to ¥12,811 million, exceeding the company’s plan. All four business units posted year-on-year gains in both net sales and gross profit, and the company is guiding to further increases in sales and profit for FY2026.
Consolidated Results (Full-Year Actual)
Net sales, gross profit and each profit line grew year on year. Operating profit margin came to 3.0% of net sales and net income margin to 2.0%. Figures are in millions of yen; the YoY column shows the rate of change as stated in the materials.
| Item (¥ million) | FY2025 | FY2024 | YoY |
|---|---|---|---|
| Net sales | 652,072 | 552,778 | +18.0% |
| Gross profit | 112,165 | 98,668 | +13.7% |
| Selling, general and administrative expenses | 92,567 | 85,725 | +8.0% |
| Operating income | 19,597 | 12,943 | +51.4% |
| Ordinary income | 18,485 | 12,144 | +52.2% |
| Profit attributable to owners of parent | 12,811 | 8,006 | +60.0% |
Business Unit Results
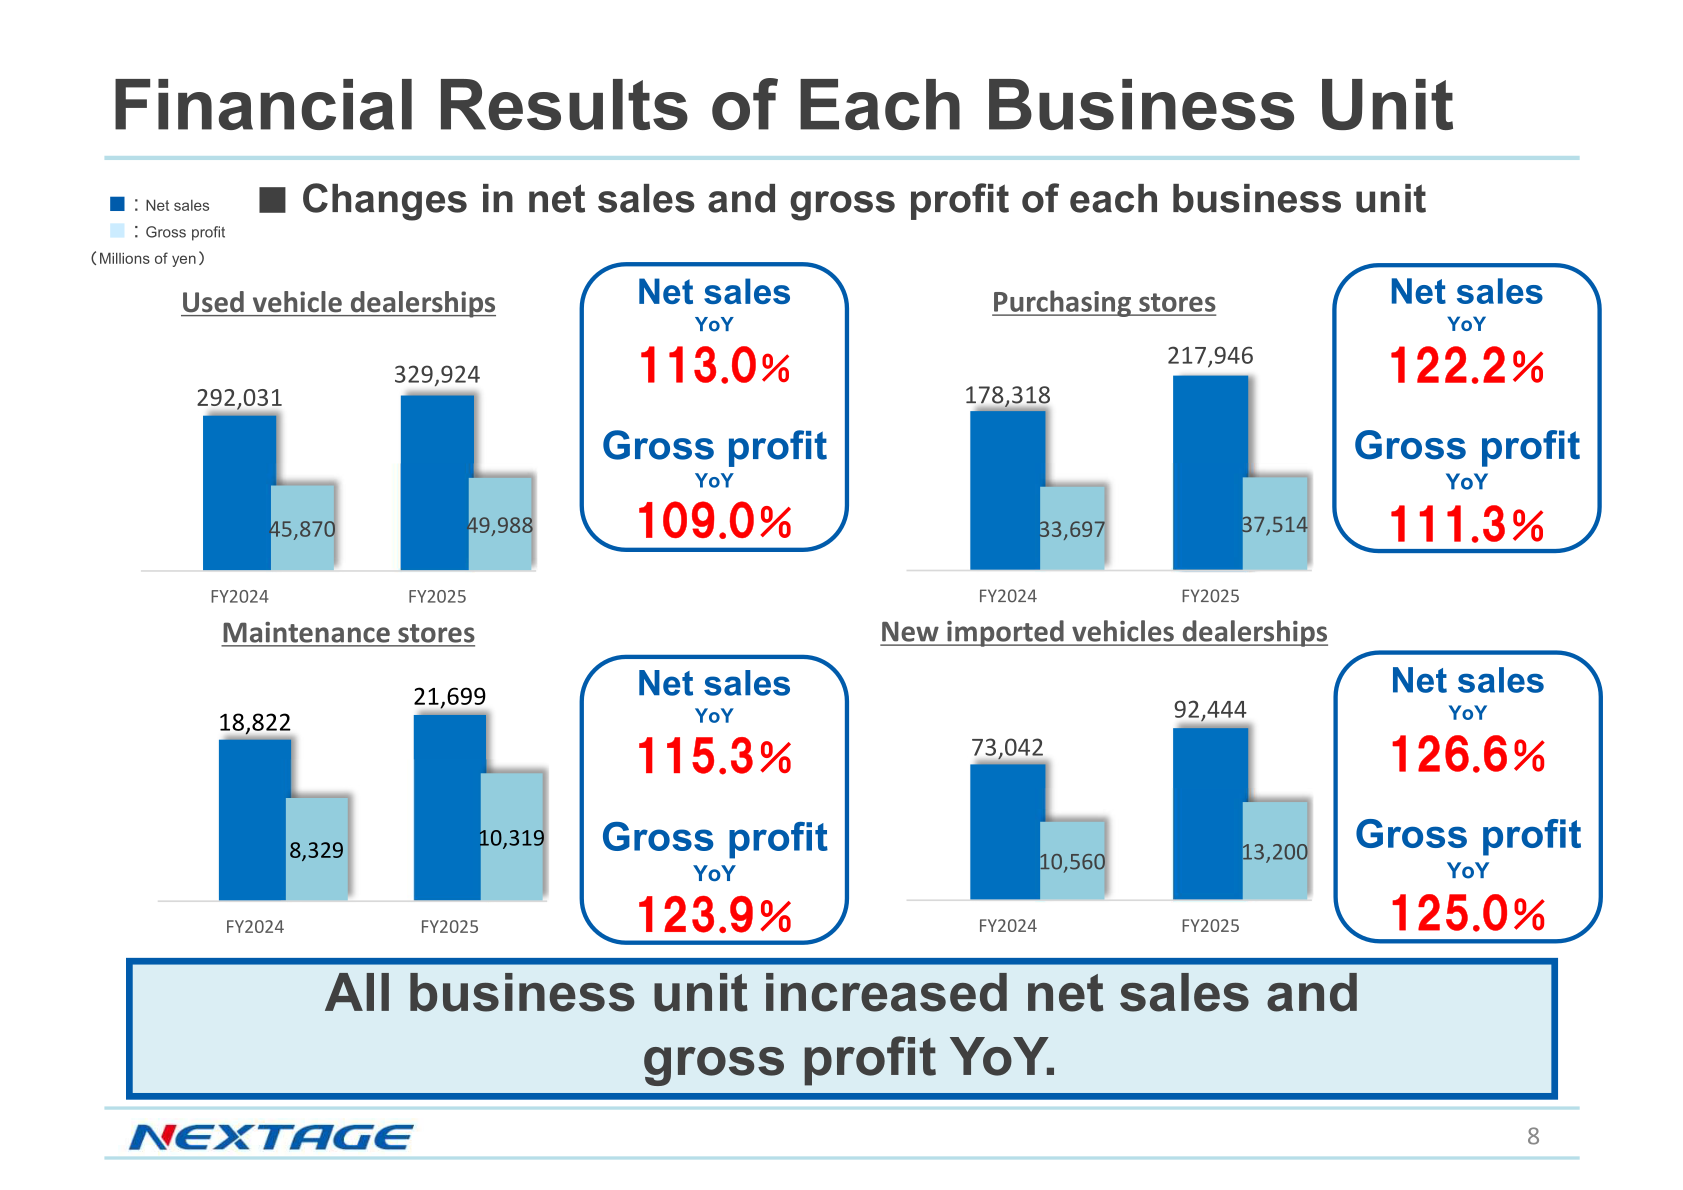
Every business unit increased both net sales and gross profit year on year. Growth was led by the purchasing stores and new imported vehicles dealerships units. Figures are in millions of yen.
| Business Unit | Metric (¥ million) | FY2025 | FY2024 |
|---|---|---|---|
| Used vehicle dealerships | Net sales | 329,924 | 292,031 |
| Used vehicle dealerships | Gross profit | 49,988 | 45,870 |
| Purchasing stores | Net sales | 217,946 | 178,318 |
| Purchasing stores | Gross profit | 37,514 | 33,697 |
| New imported vehicles dealerships | Net sales | 92,444 | 73,042 |
| New imported vehicles dealerships | Gross profit | 13,200 | 10,560 |
| Maintenance stores | Net sales | 21,699 | 18,822 |
| Maintenance stores | Gross profit | 10,319 | 8,329 |
Topics
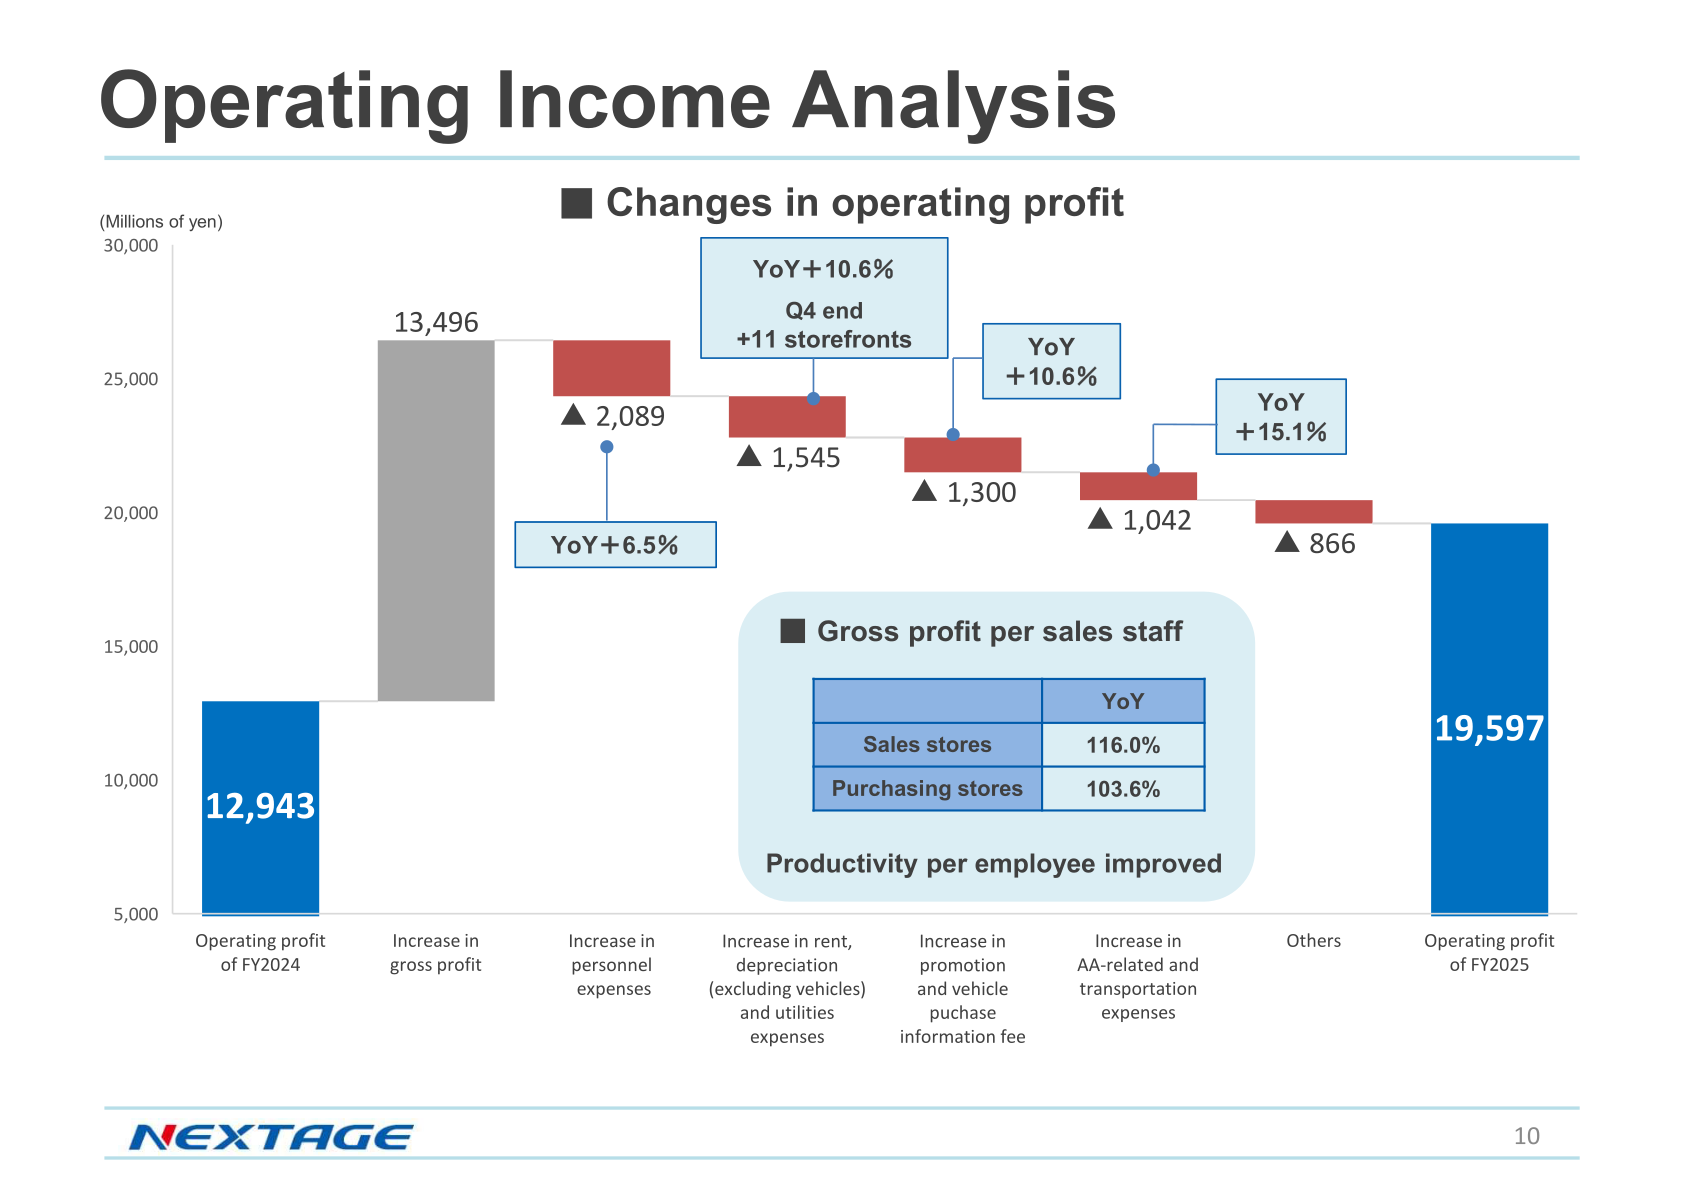
The company attributes the operating profit increase (from ¥12,943 million in FY2024 to ¥19,597 million in FY2025) mainly to higher gross profit, partly offset by increases in personnel expenses; rent, depreciation and utilities; promotion and vehicle-purchase information fees; and AA-related and transportation expenses. Productivity per employee improved, with gross profit per sales staff up. The company opened a net additional number of locations to reach 353 storefronts at the end of FY2025 (up from 342 at the beginning of the year) and plans 368 storefronts at the end of FY2026. It also reinforced its wholesale business through the “Shared Inventory” and “NEXTAGE STOCK” initiatives and reduced the number of loss-making general stores, whose operating results improved by approximately ¥2.2 billion.
FY2026 Forecast
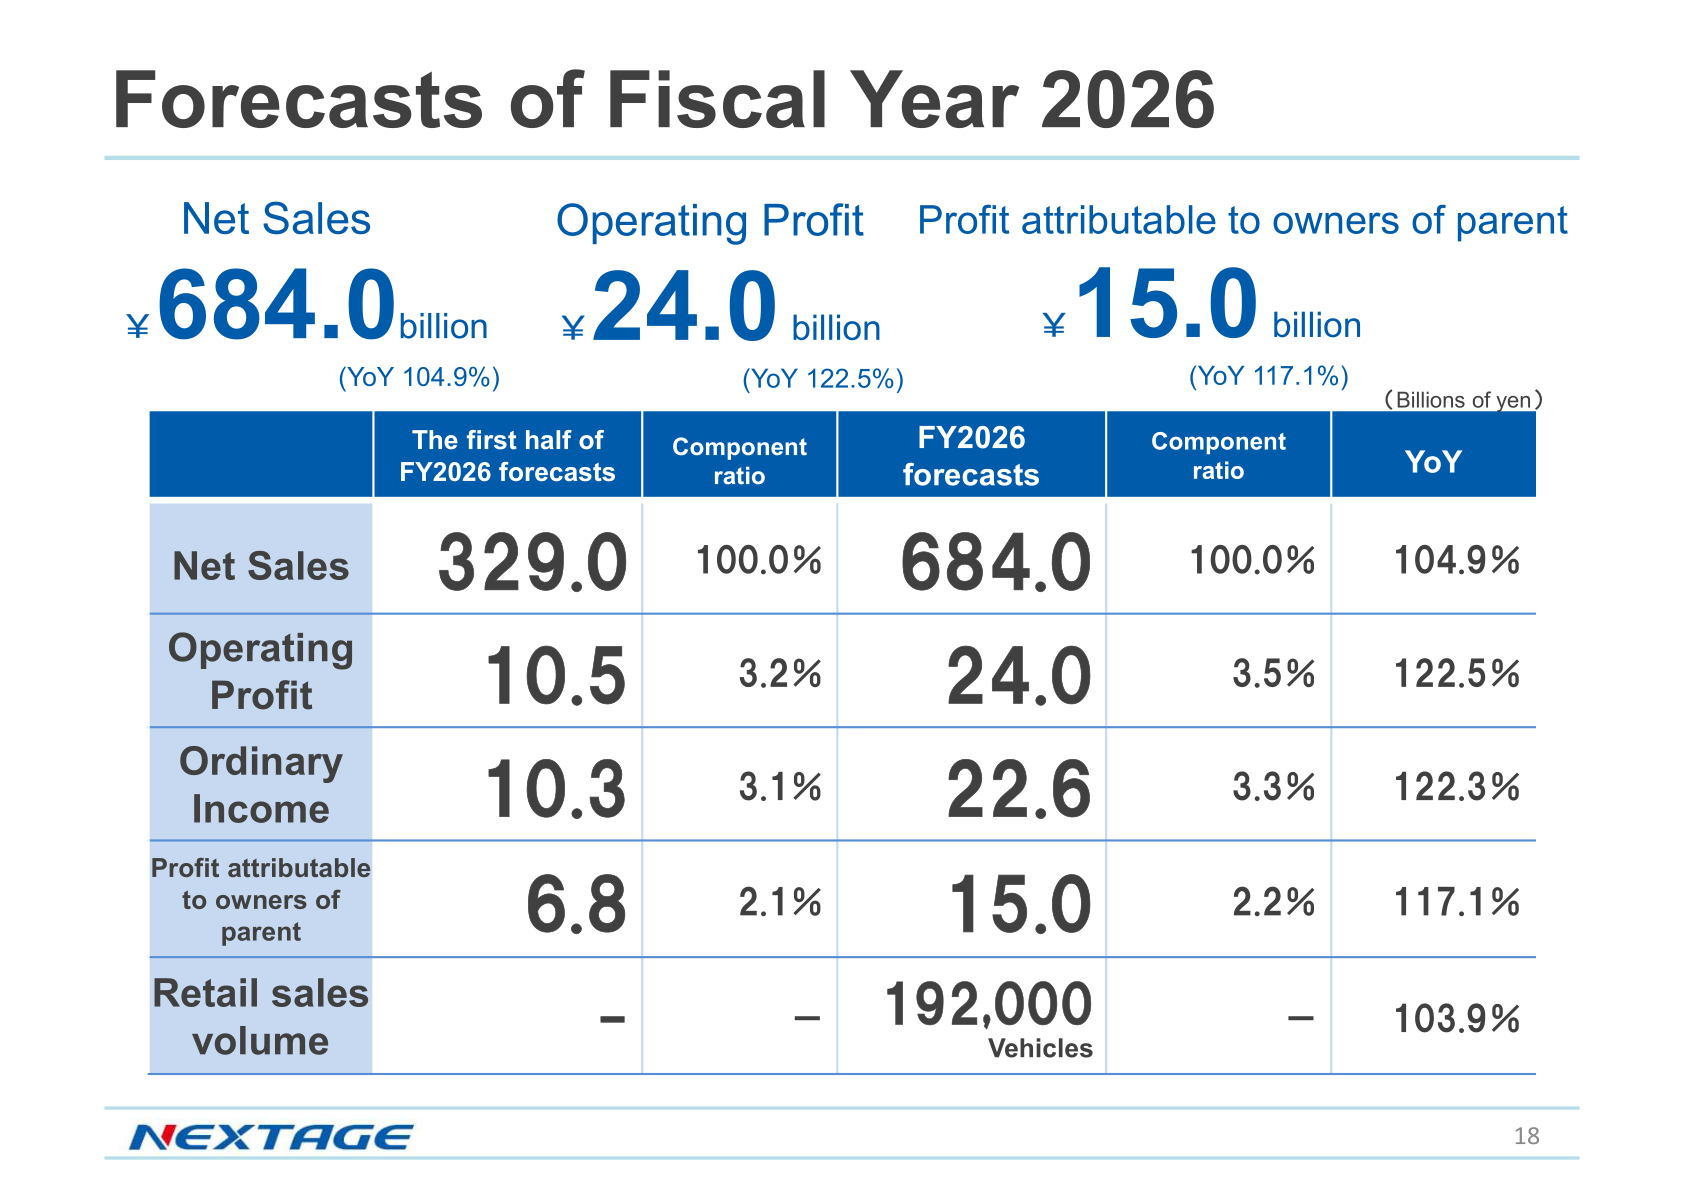
For the fiscal year ending November 30, 2026 (FY2026), the company forecasts higher sales and profits. Figures are in billions of yen except retail sales volume; the YoY column shows the index versus the FY2025 actual as stated in the materials.
| Item | H1 FY2026 Forecast | FY2026 Forecast | YoY |
|---|---|---|---|
| Net sales (¥ billion) | 329.0 | 684.0 | 104.9% |
| Operating profit (¥ billion) | 10.5 | 24.0 | 122.5% |
| Ordinary income (¥ billion) | 10.3 | 22.6 | 122.3% |
| Profit attributable to owners of parent (¥ billion) | 6.8 | 15.0 | 117.1% |
| Retail sales volume (vehicles) | – | 192,000 | 103.9% |
Financial Position
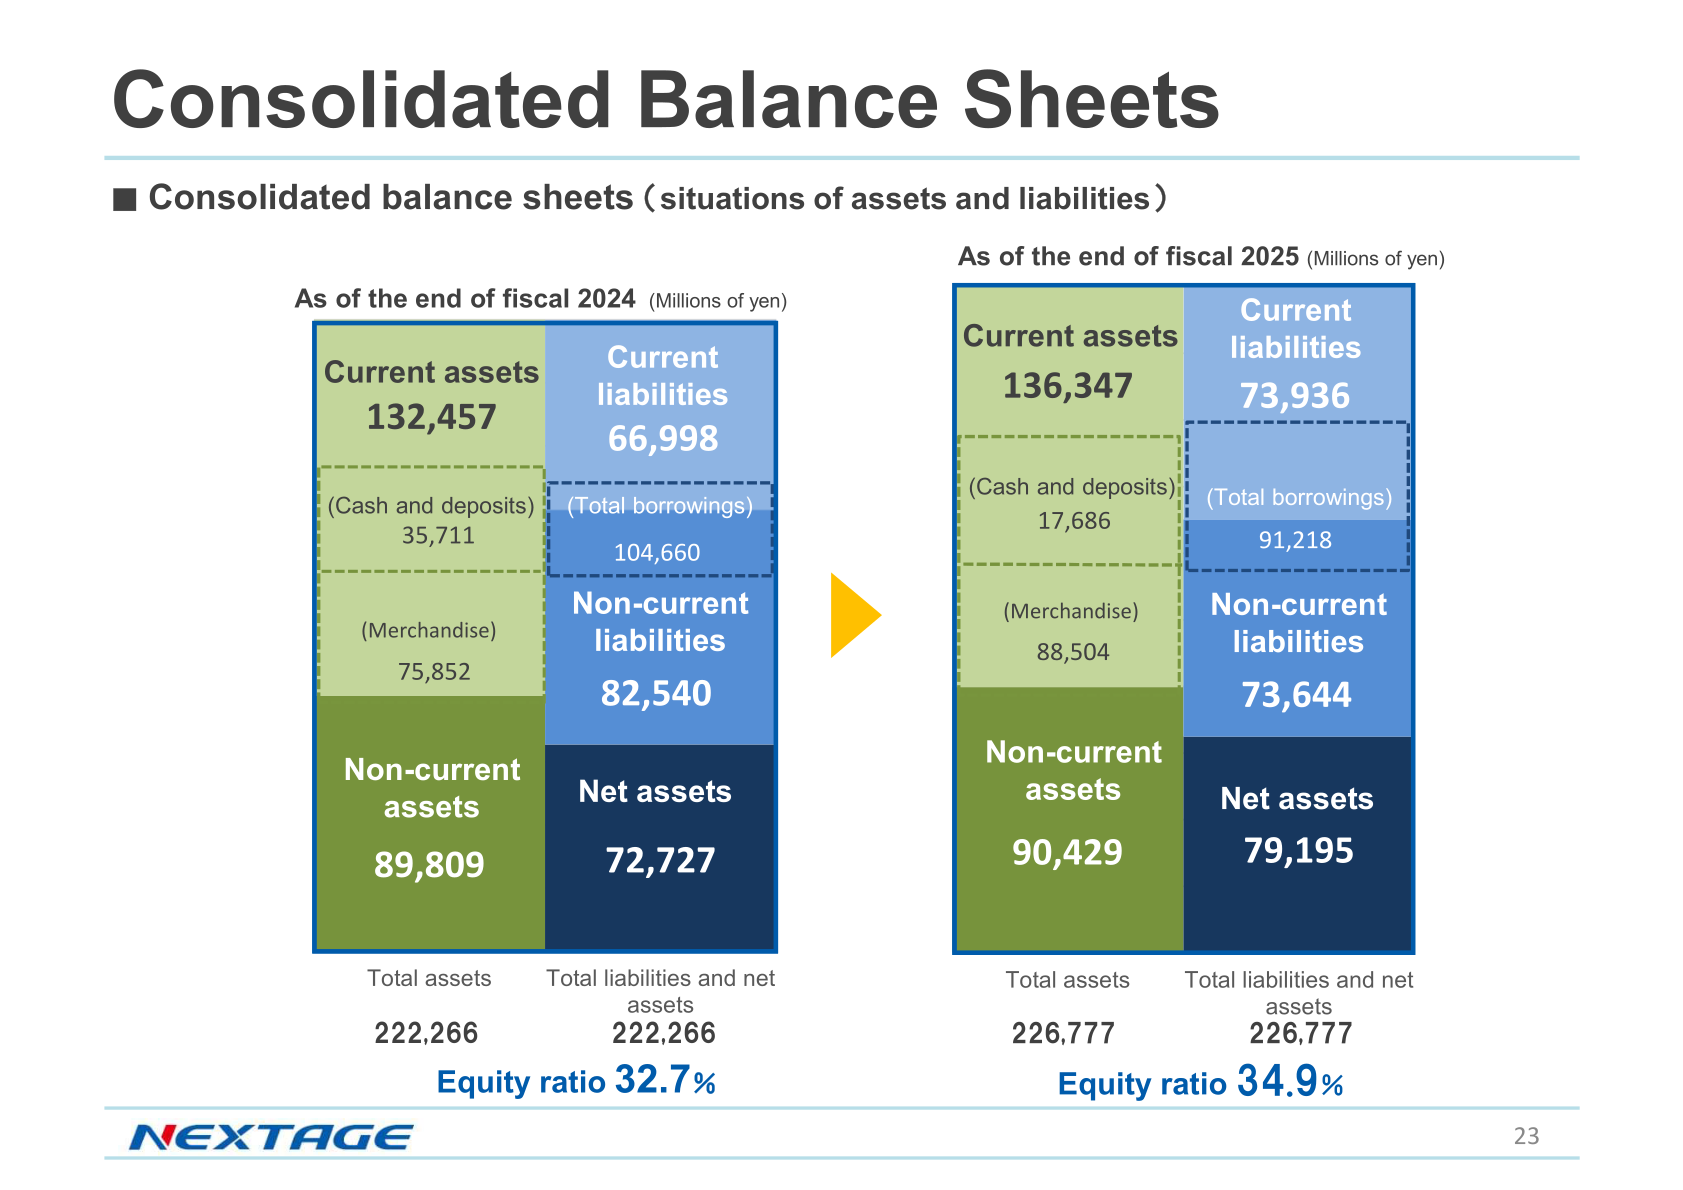
On a consolidated basis, total assets stood at ¥226,777 million at the end of FY2025 and net assets at ¥79,195 million. The equity ratio improved to 34.9% from 32.7% a year earlier, while total borrowings declined to ¥91,218 million from ¥104,660 million. Figures are in millions of yen.
| Item (¥ million) | End of FY2025 | End of FY2024 |
|---|---|---|
| Total assets | 226,777 | 222,266 |
| Current assets | 136,347 | 132,457 |
| Non-current assets | 90,429 | 89,809 |
| Current liabilities | 73,936 | 66,998 |
| Non-current liabilities | 73,644 | 82,540 |
| Net assets | 79,195 | 72,727 |
| Total borrowings | 91,218 | 104,660 |
| Cash and deposits | 17,686 | 35,711 |
| Merchandise | 88,504 | 75,852 |
| Equity ratio | 34.9% | 32.7% |
Shareholder Returns
The results presentation does not include information on dividends or share buybacks. This cannot be confirmed from the materials.
This article is an analysis based on publicly available information and is not a recommendation to buy or sell any specific securities. Investment decisions are your own responsibility.
















