
This article is based on publicly available IR materials and is not a recommendation to buy or sell any specific securities.
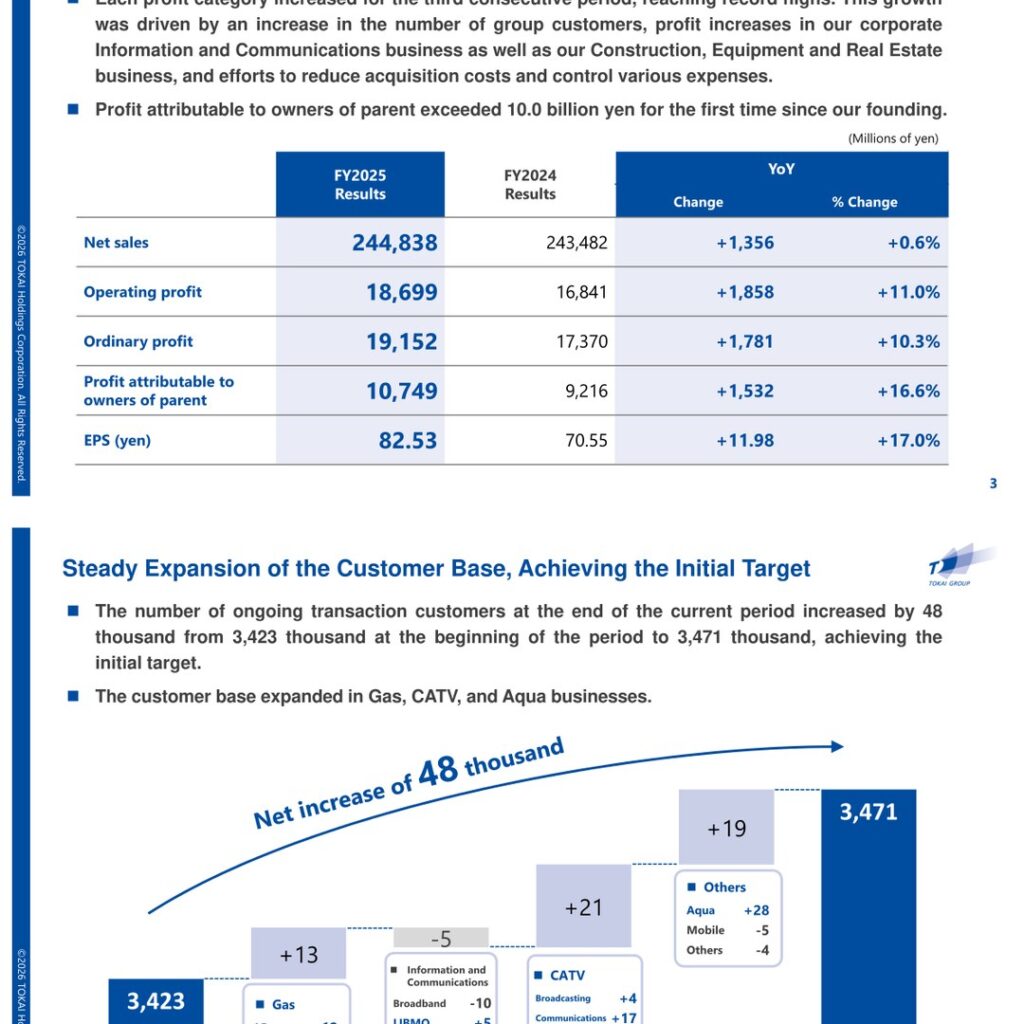
TOKAI Holdings Corporation (3167) reported record-high sales and profits for FY2025 (the fiscal year ended March 31, 2026; the company labels this year FY2025 in its materials). Net sales rose for the ninth consecutive period to ¥244,838 million (+0.6% YoY), while operating profit increased for the third consecutive period to ¥18,699 million (+11.0% YoY). Profit attributable to owners of parent grew 16.6% YoY to ¥10,749 million, exceeding ¥10.0 billion for the first time since the company’s founding. Alongside the results, the company announced its new Medium-Term Management Plan 2028.
Consolidated Results (Full-Year Actual)
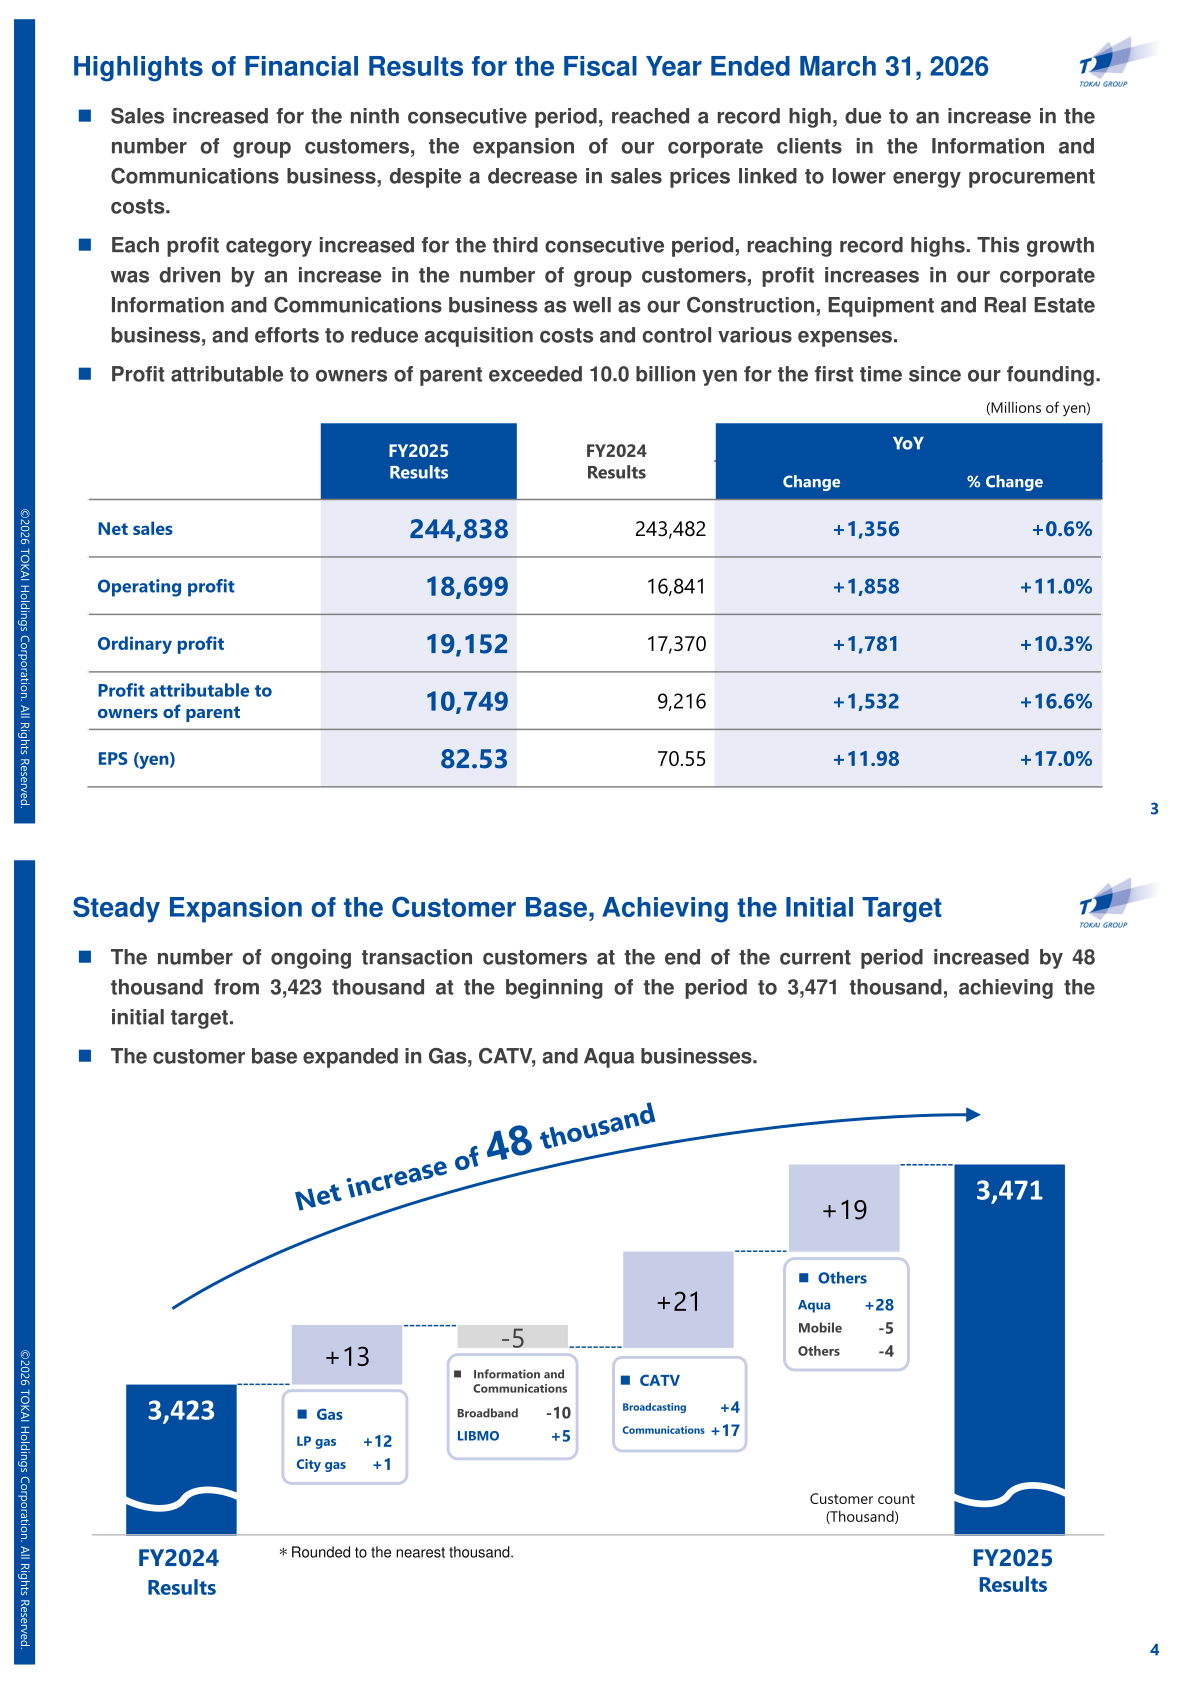
Sales increased due to growth in the number of group customers and the expansion of corporate clients in the Information and Communications business, despite lower sales prices linked to reduced energy procurement costs. Each profit category reached a record high, driven by customer base growth, profit increases in the Information and Communications and Construction, Equipment and Real Estate businesses, and efforts to reduce acquisition costs and control expenses. The number of ongoing transaction customers rose by 48 thousand, from 3,423 thousand at the beginning of the period to 3,471 thousand at period-end.
| Item | FY2025 | FY2024 | YoY Change | % Change |
|---|---|---|---|---|
| Net sales | 244,838 | 243,482 | +1,356 | +0.6% |
| Operating profit | 18,699 | 16,841 | +1,858 | +11.0% |
| Ordinary profit | 19,152 | 17,370 | +1,781 | +10.3% |
| Profit attributable to owners of parent | 10,749 | 9,216 | +1,532 | +16.6% |
| EPS (yen) | 82.53 | 70.55 | +11.98 | +17.0% |
Segment Results
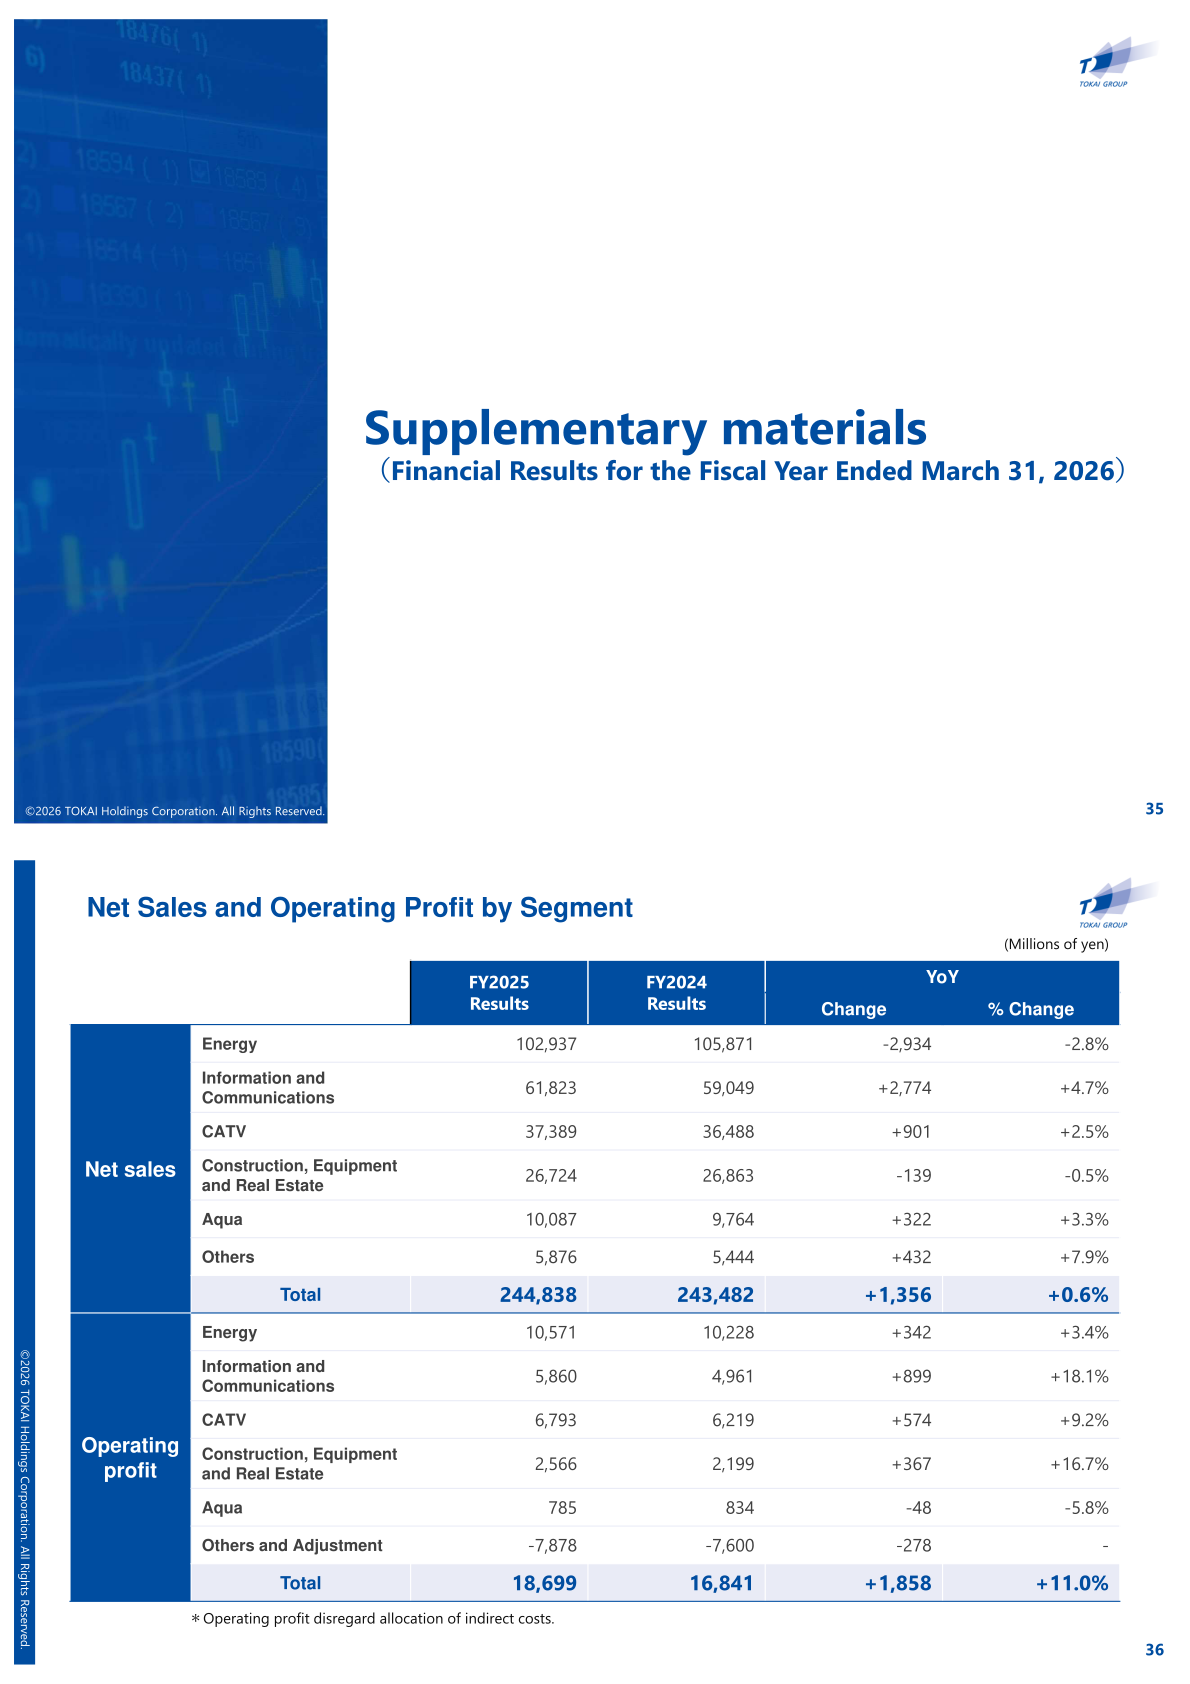
By segment, net sales in the Energy business declined amid lower energy sales prices, while Information and Communications, CATV, and Aqua all grew. On operating profit, all reporting segments except Aqua increased profits: Energy on higher customer numbers and a review of acquisition costs; Information and Communications on steady cloud-service progress and lower SG&A; CATV on customer growth; and Construction, Equipment and Real Estate on steady orders in facility construction and real estate sales. Aqua profit edged down as strengthened customer acquisition raised acquisition costs. (Segment operating profit disregards allocation of indirect costs.)
| Segment | Net Sales FY2025 | Net Sales FY2024 | YoY Change | % Change |
|---|---|---|---|---|
| Energy | 102,937 | 105,871 | -2,934 | -2.8% |
| Information and Communications | 61,823 | 59,049 | +2,774 | +4.7% |
| CATV | 37,389 | 36,488 | +901 | +2.5% |
| Construction, Equipment and Real Estate | 26,724 | 26,863 | -139 | -0.5% |
| Aqua | 10,087 | 9,764 | +322 | +3.3% |
| Others | 5,876 | 5,444 | +432 | +7.9% |
| Total | 244,838 | 243,482 | +1,356 | +0.6% |
| Segment | Operating Profit FY2025 | Operating Profit FY2024 | YoY Change | % Change |
|---|---|---|---|---|
| Energy | 10,571 | 10,228 | +342 | +3.4% |
| Information and Communications | 5,860 | 4,961 | +899 | +18.1% |
| CATV | 6,793 | 6,219 | +574 | +9.2% |
| Construction, Equipment and Real Estate | 2,566 | 2,199 | +367 | +16.7% |
| Aqua | 785 | 834 | -48 | -5.8% |
| Others and Adjustment | -7,878 | -7,600 | -278 | – |
| Total | 18,699 | 16,841 | +1,858 | +11.0% |
FY2026 Forecast and Medium-Term Targets
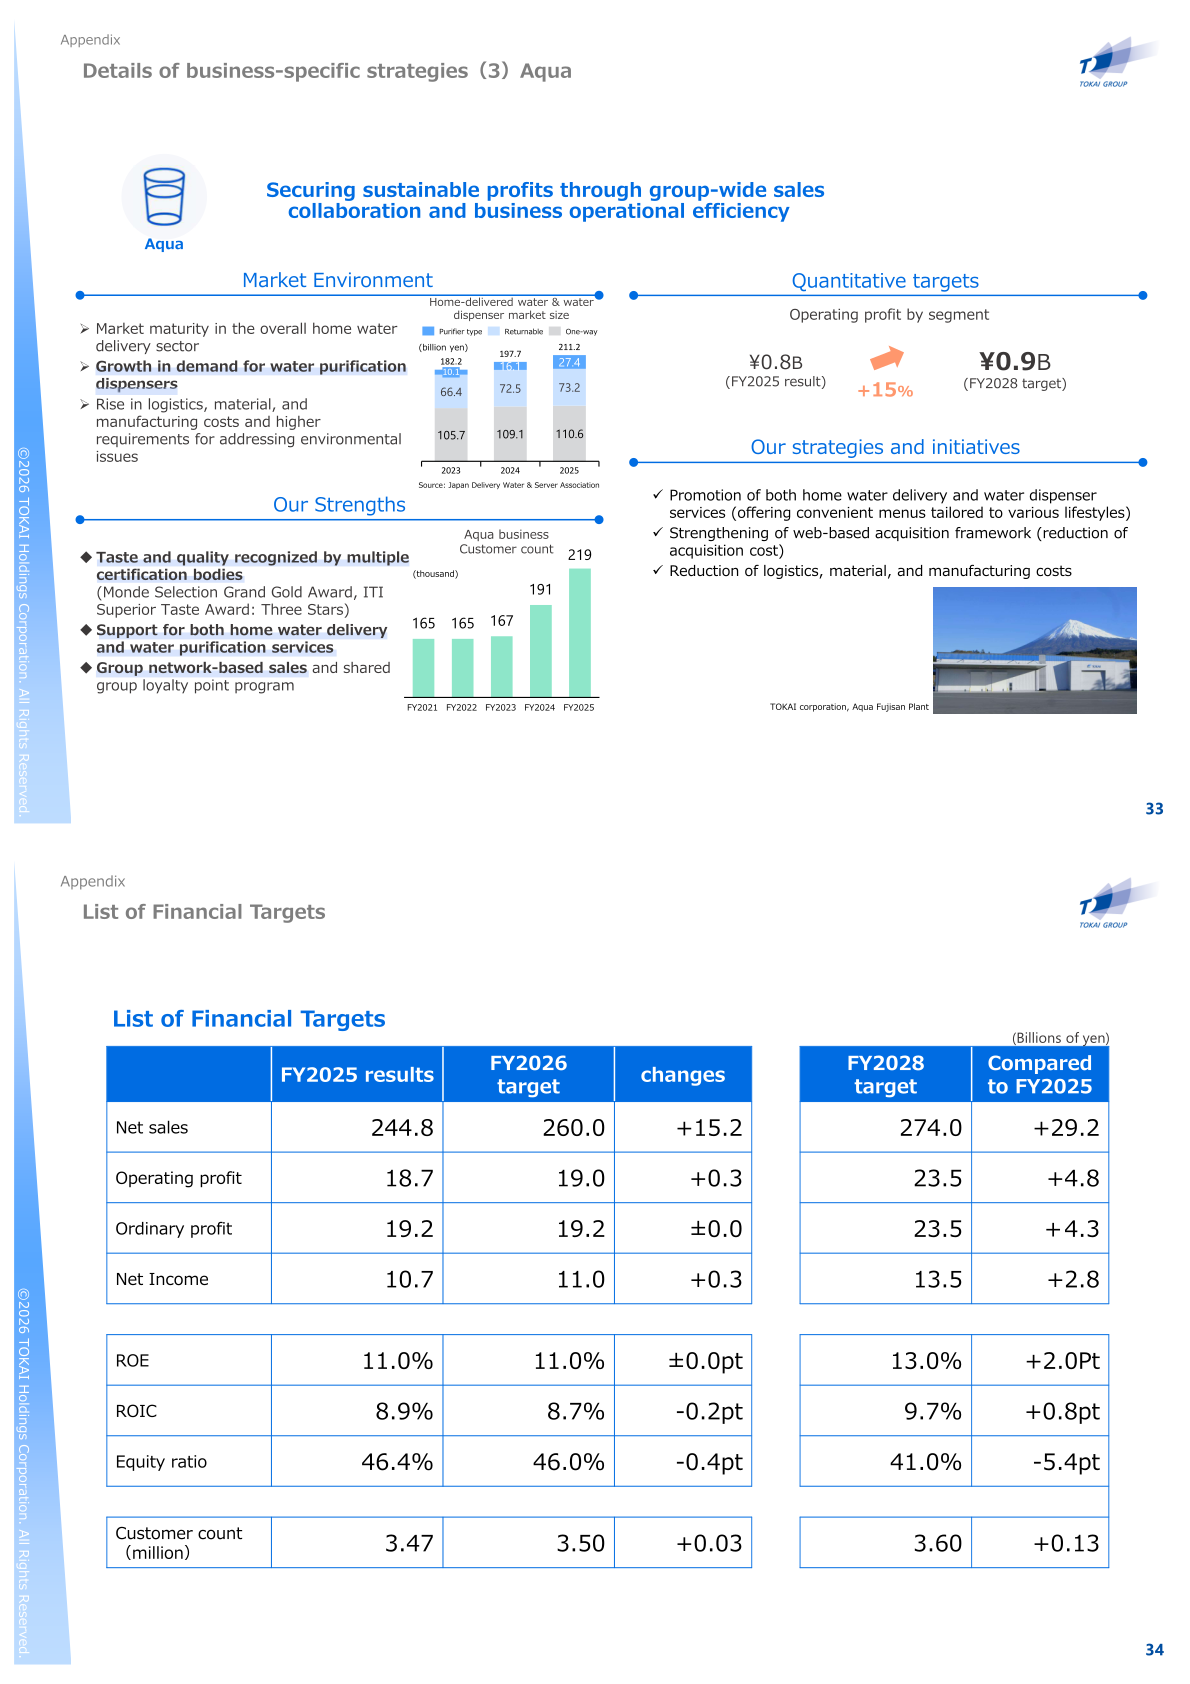
For FY2026 (the fiscal year ending March 31, 2027), the company forecasts net sales of ¥260.0 billion, operating profit of ¥19.0 billion, ordinary profit of ¥19.2 billion, and net income of ¥11.0 billion. Under Medium-Term Management Plan 2028 (FY2026–FY2028), the FY2028 targets are net sales of ¥274.0 billion, operating profit of ¥23.5 billion, net income of ¥13.5 billion, ROE of 13.0%, and an equity ratio of over 40%. Figures in the table below are presented in billions of yen as shown in the company’s materials.
| Item | FY2025 (Actual) | FY2026 (Forecast) | FY2028 (Target) |
|---|---|---|---|
| Net sales | 244.8 | 260.0 | 274.0 |
| Operating profit | 18.7 | 19.0 | 23.5 |
| Ordinary profit | 19.2 | 19.2 | 23.5 |
| Net income | 10.7 | 11.0 | 13.5 |
| ROE | 11.0% | 11.0% | 13.0% |
| ROIC | 8.9% | 8.7% | 9.7% |
| Equity ratio | 46.4% | 46.0% | 41.0% |
| Customer count (million) | 3.47 | 3.50 | 3.60 |
Shareholder Returns
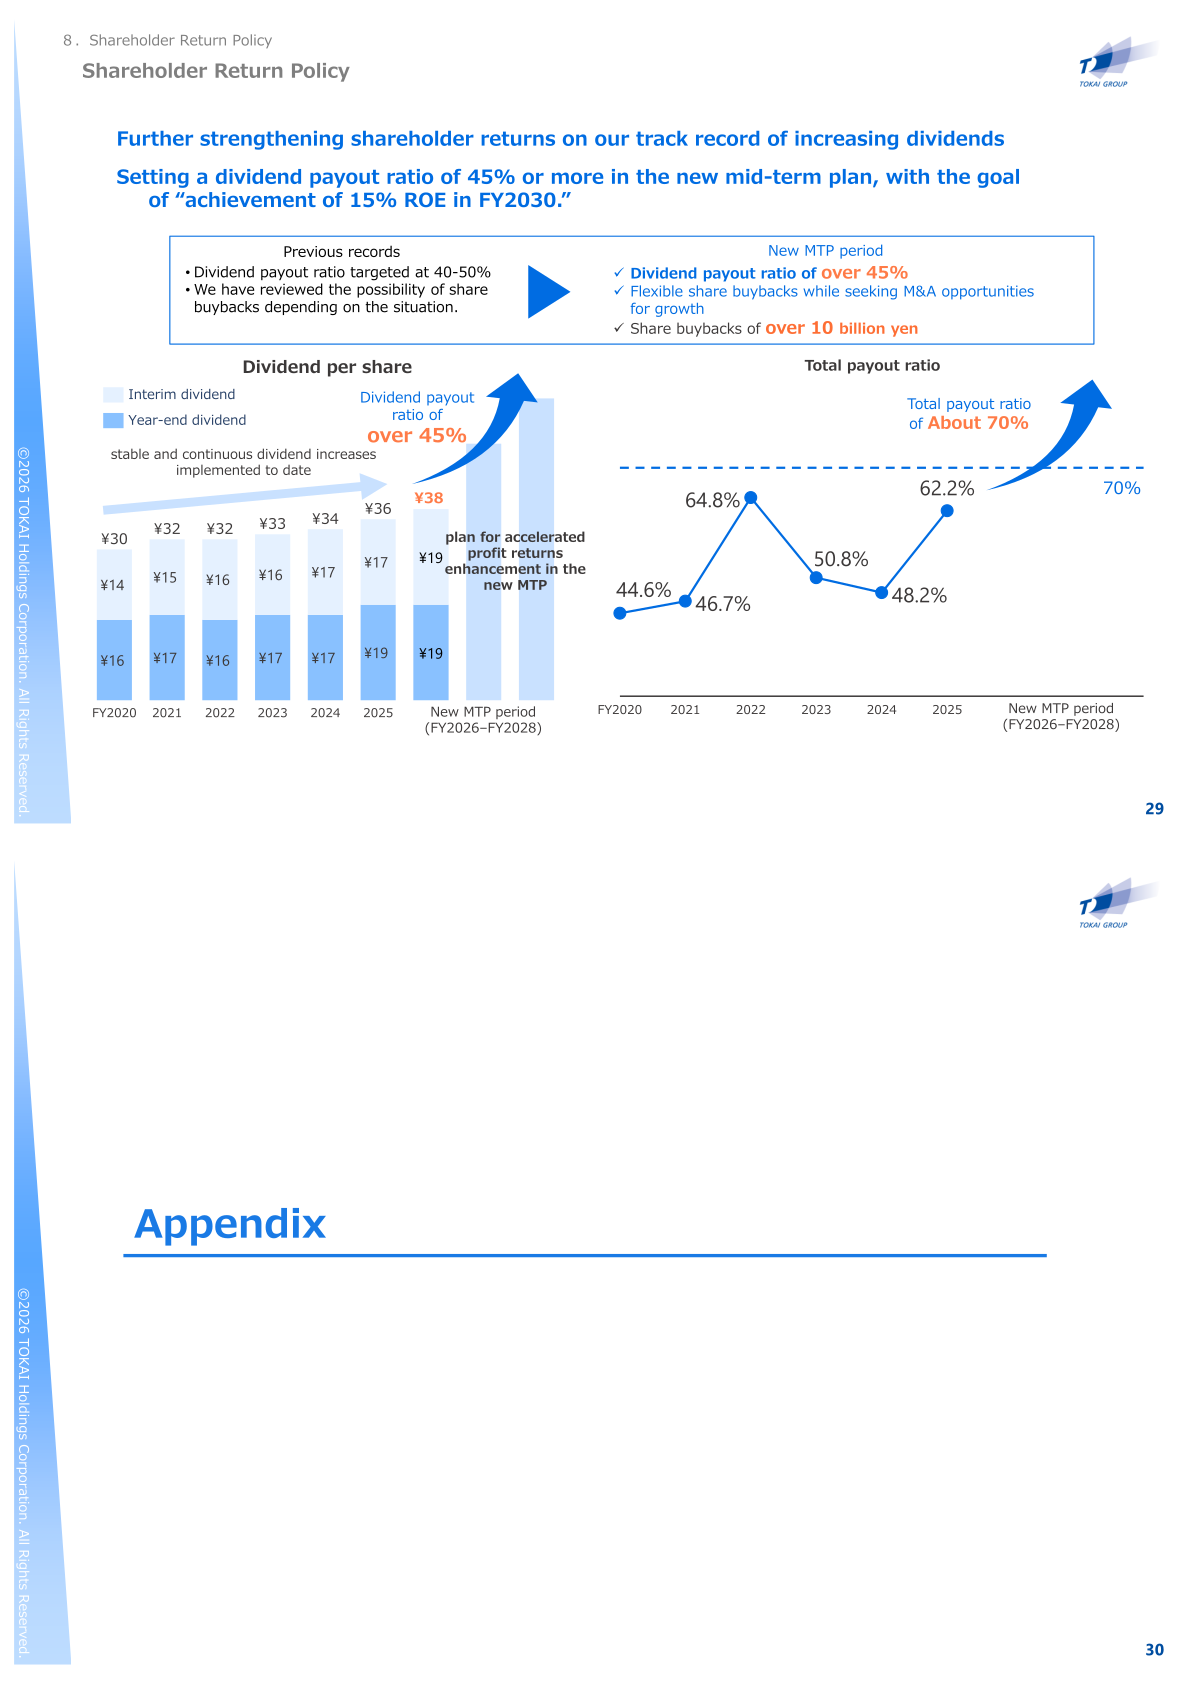
For FY2025, the total annual dividend is ¥36 per share (interim ¥17, year-end ¥19), marking the third consecutive period of dividend increase. As announced on February 5, 2026, the year-end dividend was raised by ¥2 from the initial forecast to ¥19 per share. Under the new Medium-Term Management Plan 2028, the company set a dividend payout ratio target of over 45%, share buybacks of over ¥10 billion, and cumulative dividends of over ¥16 billion over the three-year plan period, aiming for a total payout ratio of about 70%.
Medium-Term Management Plan 2028 and Capital Allocation
Medium-Term Management Plan 2028 aims to maximize corporate value through the dual engines of business profit growth and enhanced shareholder returns, driven by the “Triple Accel” Strategy that strengthens three axes: Area, Account, and ARPU. The company set a long-term target of achieving 15% ROE in FY2030. On capital allocation over the three-year plan, the company plans to draw on approximately ¥90 billion of operating cash flow plus about ¥10 billion of interest-bearing debt utilization, directing funds to maintenance and enhancement of the earnings base (approximately ¥55 billion), growth investments including M&A and partnerships (approximately ¥20 billion), and shareholder returns.
This article is an analysis based on publicly available information and is not a recommendation to buy or sell any specific securities. Investment decisions are your own responsibility.
















