
This article is based on publicly available IR materials and is not a recommendation to buy or sell any specific securities.
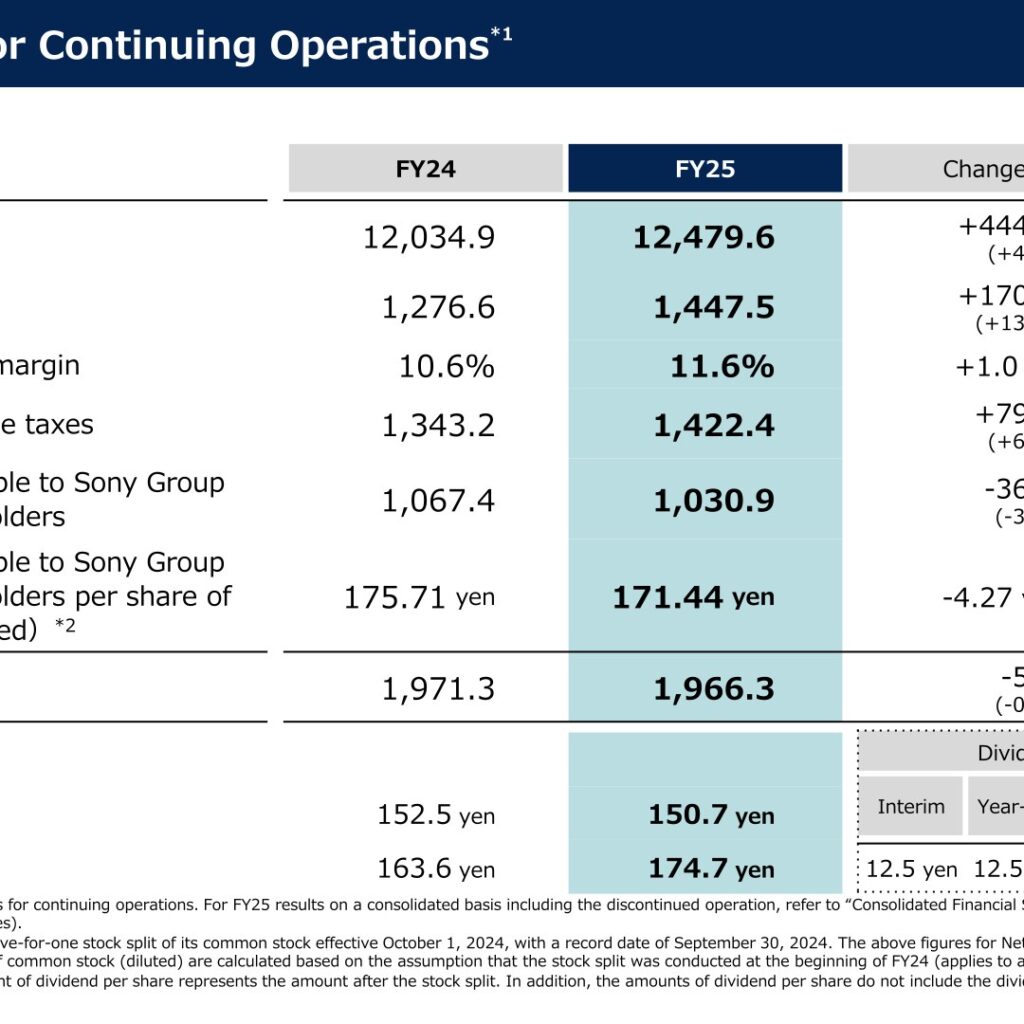
Sony Group Corporation reported FY2025 (fiscal year ended March 31, 2026) results for continuing operations: sales of 12,479.6 billion yen (+4% year-on-year) and operating income of 1,447.5 billion yen (+13% year-on-year), with an operating income margin of 11.6%. Net income attributable to Sony Group Corporation’s stockholders declined 3% year-on-year to 1,030.9 billion yen, mainly due to a decrease in financial income and expenses and a higher effective tax rate. Effective October 1, 2025, Sony executed a partial spin-off of Sony Financial Group Inc. (SFGI), and the Financial Services business has been classified as a discontinued operation since Q1 FY25, with these results presented on a continuing-operations basis throughout.
Consolidated Results (Full-Year Actual)
Sales increased 444.7 billion yen (+4%), mainly on higher sales in the I&SS and Music segments; on a constant currency basis, sales increased approximately 3%. Operating income increased 170.9 billion yen (+13%), driven mainly by increases in I&SS and Music segment operating income. Share of profit (loss) of investments accounted for using the equity method decreased 56.3 billion yen year-on-year, reflecting an additional 44.9 billion yen share of loss recorded in All Other resulting from the discontinuation of the launch of Sony Honda Mobility’s electric vehicle models. Financial income and expenses, net, decreased 91.7 billion yen, mainly due to a decrease in unrealized gains on Sony’s shares of Spotify Technology S.A. Income tax expense increased 109.6 billion yen, mainly due to the absence of decreases in tax expense recorded in FY24 from the repayment of capital from a subsidiary (48.4 billion yen) and the dissolution of a subsidiary (35.3 billion yen); the effective tax rate rose from 19% to 26%. As a result, net income attributable to Sony Group Corporation’s stockholders declined 36.5 billion yen (-3%) to 1,030.9 billion yen.
| Item | FY2025 | FY2024 | Change |
|---|---|---|---|
| Sales (Bln Yen) | 12,479.6 | 12,034.9 | +444.7 (+4%) |
| Operating income (Bln Yen) | 1,447.5 | 1,276.6 | +170.9 (+13%) |
| Operating income margin | 11.6% | 10.6% | +1.0 pts |
| Income before income taxes (Bln Yen) | 1,422.4 | 1,343.2 | +79.2 (+6%) |
| Net income attributable to Sony Group Corporation’s stockholders (Bln Yen) | 1,030.9 | 1,067.4 | -36.5 (-3%) |
| Net income per share (diluted) | 171.44 yen | 175.71 yen | -4.27 yen |
| Operating Cash Flow (Bln Yen) | 1,966.3 | 1,971.3 | -5.1 (-0%) |
Segment Results
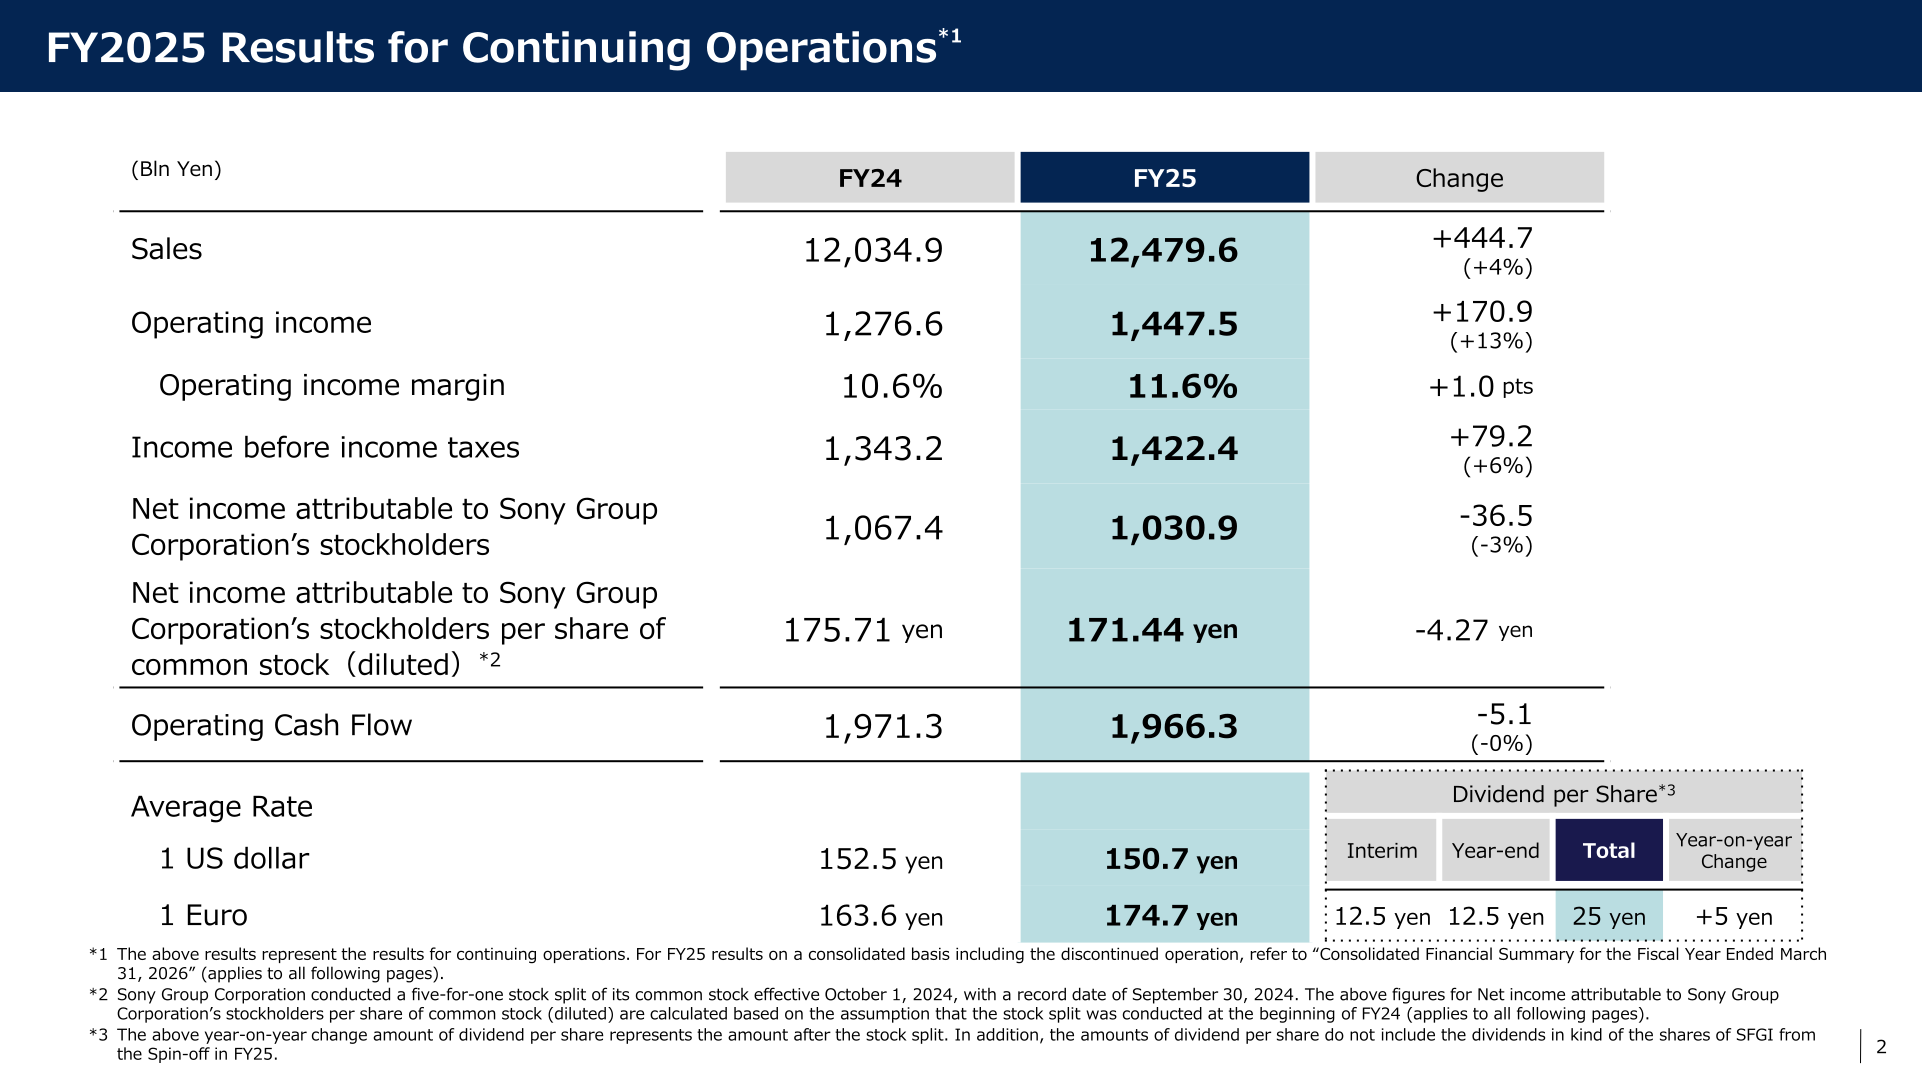
Game & Network Services (G&NS): Sales were essentially flat (FX impact: +87.3 billion yen), with increases in network services sales and non-first-party game software sales offset by lower hardware unit sales. Operating income increased 48.4 billion yen (+12%) to a record high for the segment, up 45% year-on-year excluding one-time items; results included impairment losses against Bungie, Inc.’s intangible and other assets totaling 120.1 billion yen for FY25 (Q2: 31.5 billion yen, Q4: 88.6 billion yen). Monthly Active Users in March reached 125 million accounts (+1% year-on-year), a record high for a fourth quarter. Music: Sales increased 277.5 billion yen (+15%) on higher streaming revenue in Recorded Music and Music Publishing, higher live events and merchandising revenue, higher Visual Media & Platform revenue including contributions from Demon Slayer: Kimetsu no Yaiba Infinity Castle and Kokuho, and higher mobile game application revenue. Operating income increased 89.7 billion yen (+25%) to a record high even excluding one-time items, including a 34.7 billion yen remeasurement gain from the acquisition of additional equity interest in Peanuts Holdings LLC. Full-year streaming revenue growth on a U.S. dollar basis was +9% for Recorded Music and +14% for Music Publishing. Pictures: Sales were essentially flat (U.S. dollar basis: +18 million USD / +0%), with higher Crunchyroll revenue and increased Television Productions series deliveries offset by lower Motion Pictures theatrical revenue. Operating income decreased 12.4 billion yen (-11%; U.S. dollar basis: -87 million USD / -11%), reflecting 27.1 billion yen of impairment losses and shutdown costs associated with Pixomondo; excluding this impact, operating income on a yen basis increased approximately 13% year-on-year. Entertainment, Technology & Services (ET&S): Sales decreased 148.7 billion yen (-6%) on lower Displays unit sales, and operating income decreased 32.3 billion yen (-17%), partly offset by reductions in operating expenses. Imaging & Sensing Solutions (I&SS): Sales increased 352.5 billion yen (+20%) on higher sales of image sensors for mobile products, improved product mix and higher unit sales. Operating income increased 96.2 billion yen (+37%) to a record high despite the recording of restructuring costs, a 19.9 billion yen loss on the sale of the equity interest in Sony Semiconductor Israel Ltd., and 16.5 billion yen of impairment losses against a portion of the display device business’s long-lived assets.
| Segment | Metric | FY2025 | FY2024 |
|---|---|---|---|
| Game & Network Services | Sales (Bln Yen) | 4,685.7 | 4,670.0 |
| Game & Network Services | Operating income (Bln Yen) | 463.3 | 414.8 |
| Music | Sales (Bln Yen) | 2,120.1 | 1,842.6 |
| Music | Operating income (Bln Yen) | 447.0 | 357.3 |
| Pictures | Sales (Bln Yen) | 1,499.3 | 1,505.9 |
| Pictures | Operating income (Bln Yen) | 104.9 | 117.3 |
| Entertainment, Technology & Services | Sales (Bln Yen) | 2,260.5 | 2,409.3 |
| Entertainment, Technology & Services | Operating income (Bln Yen) | 158.6 | 190.9 |
| Imaging & Sensing Solutions | Sales (Bln Yen) | 2,151.5 | 1,799.0 |
| Imaging & Sensing Solutions | Operating income (Bln Yen) | 357.3 | 261.1 |
| All Other | Sales (Bln Yen) | 89.1 | 96.3 |
| All Other | Operating income (Bln Yen) | -74.6 | -18.0 |
| Corporate and elimination | Sales (Bln Yen) | -326.6 | -288.3 |
| Corporate and elimination | Operating income (Bln Yen) | -8.9 | -46.8 |
| Continuing Operations (Total) | Sales (Bln Yen) | 12,479.6 | 12,034.9 |
| Continuing Operations (Total) | Operating income (Bln Yen) | 1,447.5 | 1,276.6 |
FY2026 Forecast
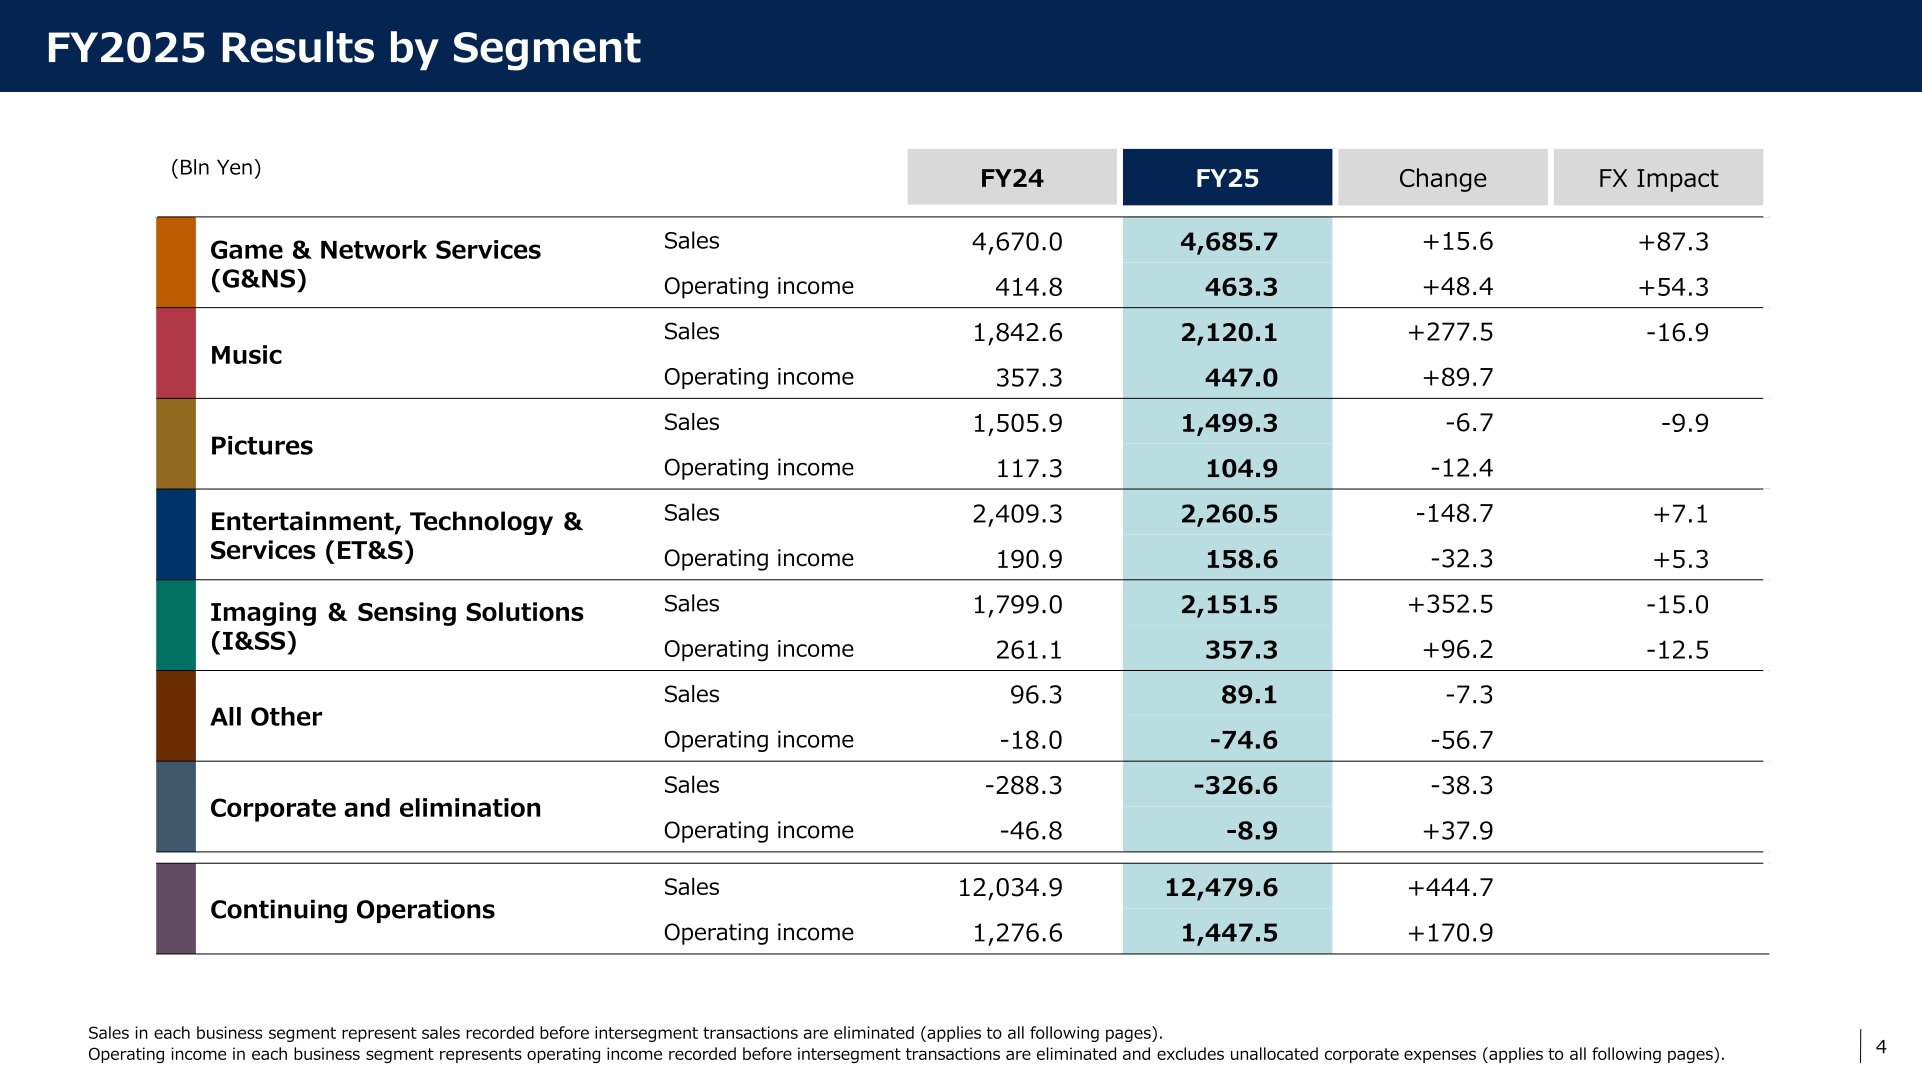
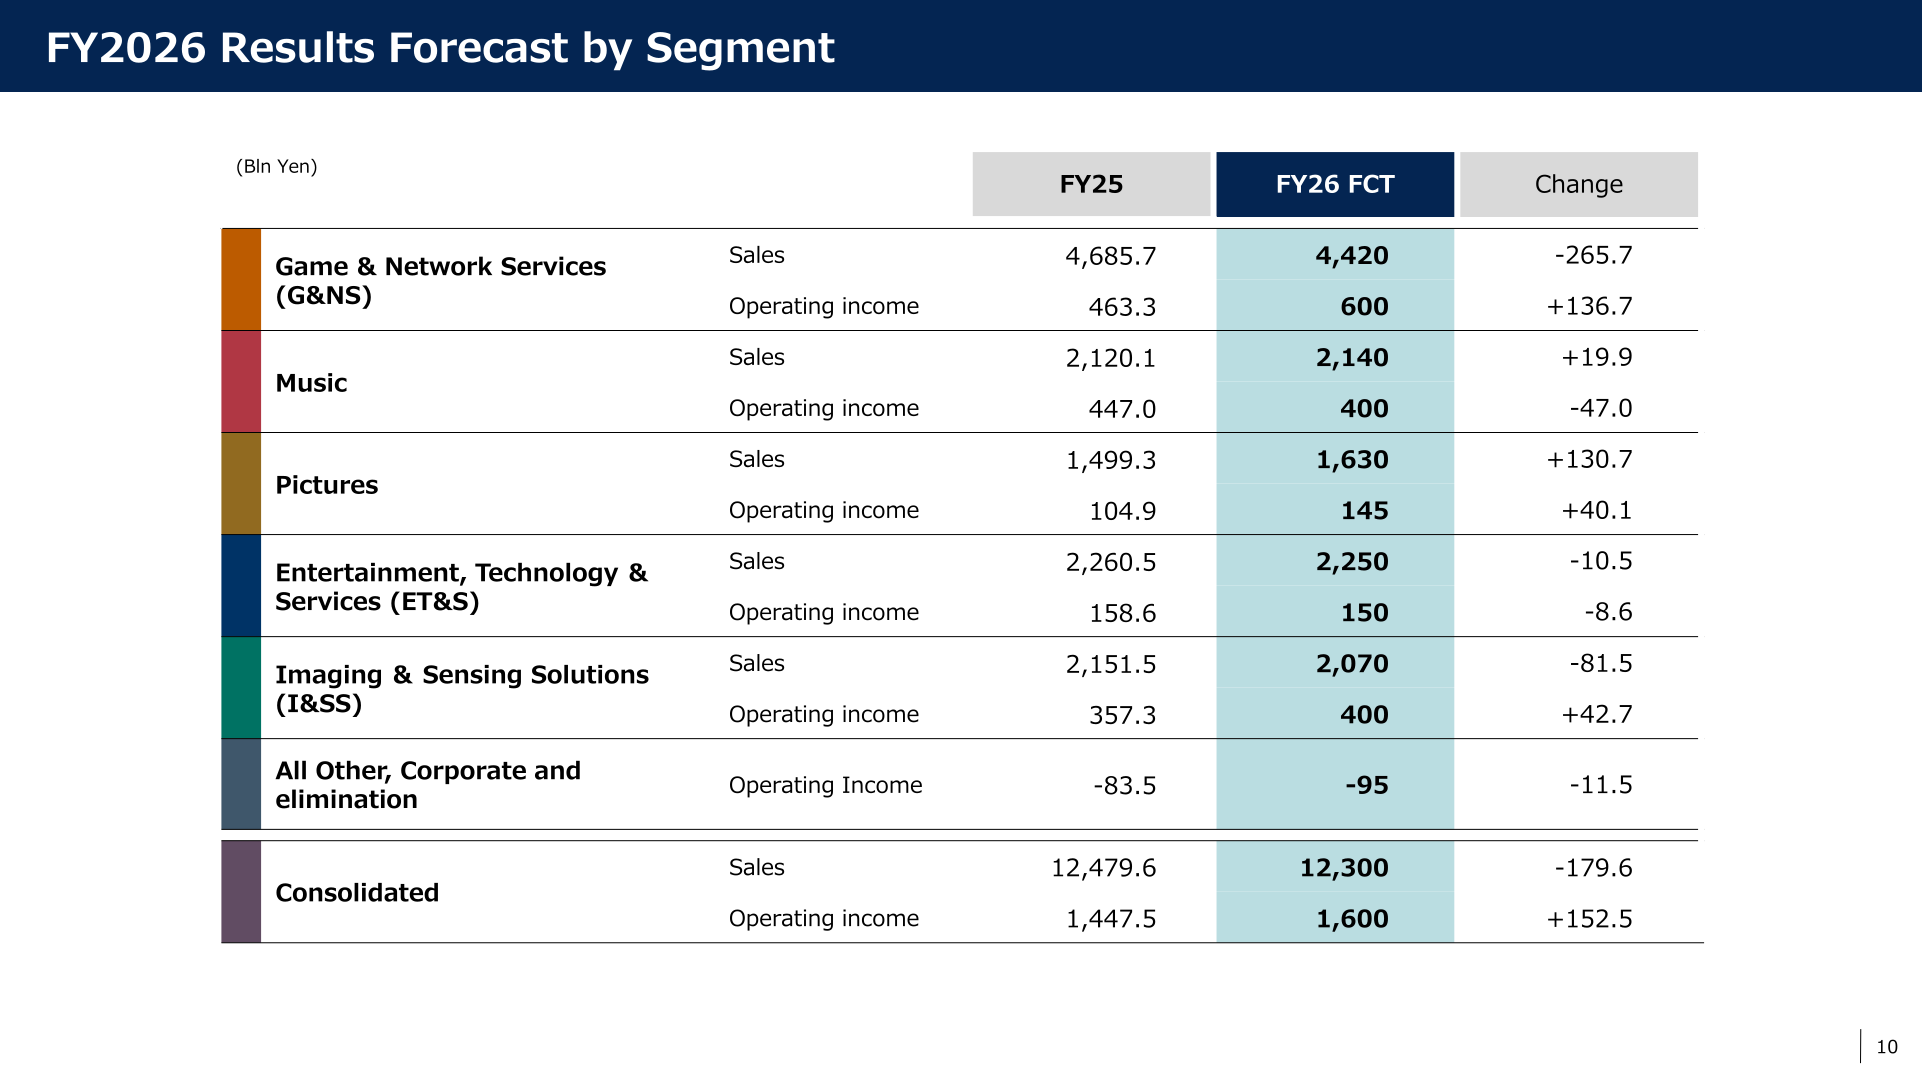
For FY2026, Sony forecasts sales of 12,300 billion yen (-1% year-on-year), mainly reflecting a decrease in G&NS segment sales, and operating income of 1,600 billion yen (+11%), mainly reflecting an increase in G&NS segment operating income. Income before income taxes is forecast to increase 14% to 1,615 billion yen, aided by an improvement in financial income and expenses as foreign exchange gains and losses are not included in the forecast. Net income attributable to Sony Group Corporation’s stockholders is forecast to increase 13% to 1,160 billion yen. By segment, G&NS sales are expected to decrease 265.7 billion yen (-6%) on lower hardware unit sales, while operating income is expected to increase 136.7 billion yen (+30%), mainly reflecting the absence of the FY25 Bungie impairment loss. Music sales are expected to be essentially flat with operating income down 47 billion yen (-11%) on the absence of FY25 remeasurement gains. Pictures sales are expected to increase 130.7 billion yen (+9%) and operating income to increase 40.1 billion yen (+38%), supported by planned theatrical releases including Spider-Man: Brand New Day and Jumanji: Open World. ET&S sales are expected to be essentially flat with operating income down 8.6 billion yen (-5%), reflecting approximately 20 billion yen of costs related to the strategic partnership with TCL and an expected approximately 30 billion yen impact from higher memory prices. I&SS sales are expected to decrease 81.5 billion yen (-4%) with operating income up 42.7 billion yen (+12%).
| Item | Forecast (FY2026) | FY2025 (Actual) |
|---|---|---|
| Sales (Bln Yen) | 12,300 | 12,479.6 |
| Operating income (Bln Yen) | 1,600 | 1,447.5 |
| Operating income margin | 13.0% | 11.6% |
| Income before income taxes (Bln Yen) | 1,615 | 1,422.4 |
| Net income attributable to Sony Group Corporation’s stockholders (Bln Yen) | 1,160 | 1,030.9 |
| Operating Cash Flow (Bln Yen) | 1,500 | 1,966.3 |
Shareholder Returns
For FY2025, Sony paid an interim dividend of 12.5 yen and a year-end dividend of 12.5 yen per share, for a total of 25 yen. For FY2026, Sony plans an interim dividend of 17.5 yen and a year-end dividend of 17.5 yen, for a planned total of 35 yen, up 10 yen year-on-year; this year-on-year change amount does not include the dividends in kind of SFGI shares distributed as part of the Spin-off in FY25. The company’s capital allocation framework for the 5th Mid-Range Plan (FY2024-FY2026) covers capital expenditure, strategic investment, and shareholder returns, with shareholder returns comprising dividends and share buybacks.
| Item | FY2025 (Actual) | FY2026 (Planned) |
|---|---|---|
| Interim dividend per share | 12.5 yen | 17.5 yen |
| Year-end dividend per share | 12.5 yen | 17.5 yen |
| Total dividend per share | 25 yen | 35 yen |
| Year-on-year change | +5 yen | +10 yen |
Medium-Term Plan / Topics
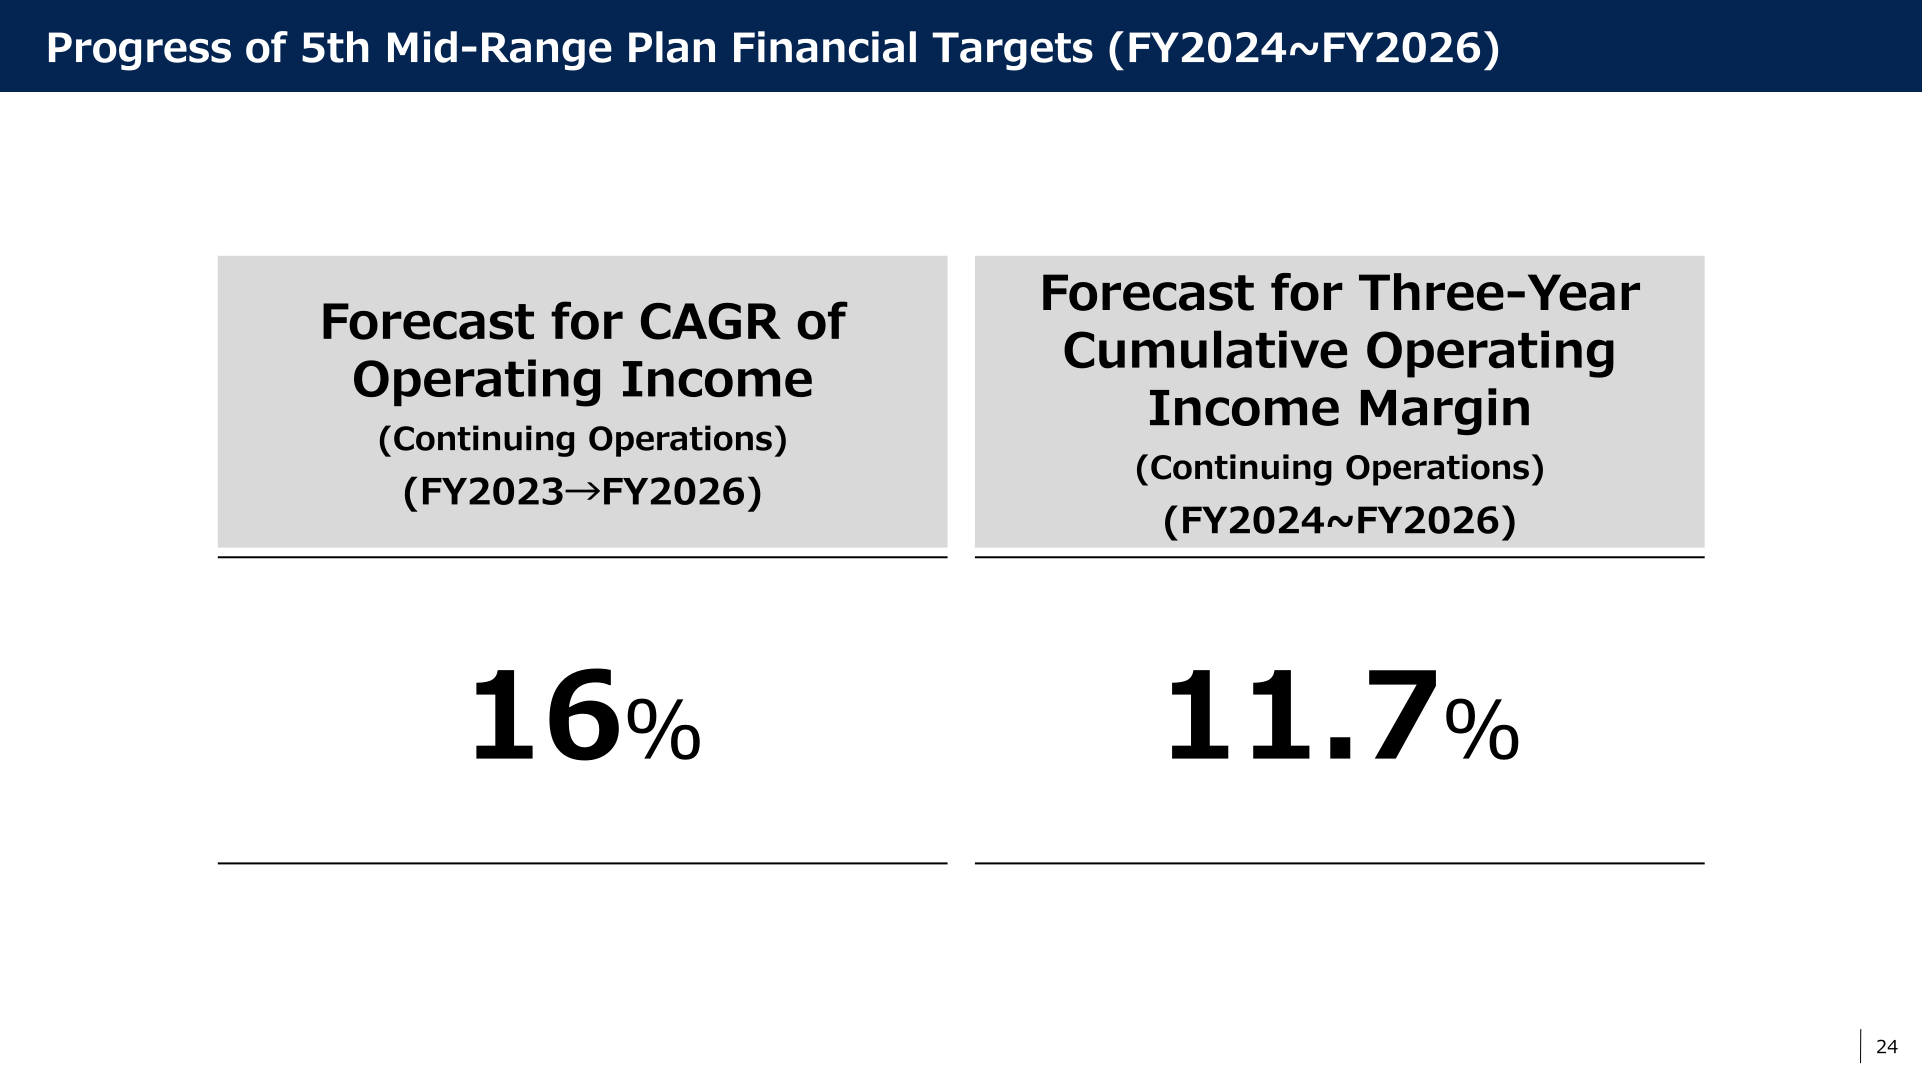
Under the 5th Mid-Range Plan (FY2024-FY2026), Sony’s financial targets for continuing operations are a CAGR of operating income of 10% or more (FY2023 to FY2026) and a three-year cumulative operating income margin of 10% or more (FY2024-FY2026). As of the latest forecast (May 2026), Sony projects a CAGR of operating income of 16% and a three-year cumulative operating income margin of 11.7%, both above the plan’s targets. Separately, effective October 1, 2025, Sony executed a partial spin-off of Sony Financial Group Inc. (SFGI), a formerly wholly-owned subsidiary operating the Financial Services business. The Financial Services business has been classified as a discontinued operation under IFRS Accounting Standards from Q1 FY25, and from Q3 FY25 Sony has applied the equity method to the SFGI shares it continues to hold, recording profit or loss from those shares as operating income or loss within continuing operations.
This article is an analysis based on publicly available information and is not a recommendation to buy or sell any specific securities. Investment decisions are your own responsibility.
![[Obayashi] Investors’ Guide 2026 — The Complete 24-Article Breakdown](https://japan-equity.com/wp-content/uploads/2026/07/hub_cover-1024x1024.png)
![[Obayashi] IR & SR Policy — Feeding Dialogue Back into Management](https://japan-equity.com/wp-content/uploads/2026/07/p32_sq-1024x1024.jpg)
![[Obayashi] Real Estate Development — 18.7% Margin, ¥287.7bn Unrealized Gains](https://japan-equity.com/wp-content/uploads/2026/07/p20_sq-1024x1024.jpg)
![[Obayashi] Domestic Civil Engineering — Resilience Spending Supports 9.6% Margin](https://japan-equity.com/wp-content/uploads/2026/07/p11_sq-1024x1024.jpg)
![[Obayashi] Share Price & External Ratings — vs TOPIX, ESG Index Inclusion](https://japan-equity.com/wp-content/uploads/2026/07/p40_sq-1024x1024.jpg)
![[Construction] ¥75.5tn Investment, Shrinking Workforce — Big-5 Market Share](https://japan-equity.com/wp-content/uploads/2026/07/p12_sq-1024x1024.jpg)



![[Obayashi] Capital Policy & Shareholder Returns — ROE 10%+, DOE ~5%, ¥100bn Buyback](https://japan-equity.com/wp-content/uploads/2026/07/p27_sq-1024x1024.jpg)
![[Obayashi] Reducing Cross-Shareholdings — ¥285.2bn Sold in Five Years](https://japan-equity.com/wp-content/uploads/2026/07/p29_sq-1024x1024.jpg)
![[Obayashi] ¥750bn Investment Plan — ¥300bn to Development, ¥190bn to Tech/DX](https://japan-equity.com/wp-content/uploads/2026/07/p30_sq-1024x1024.jpg)
![[Obayashi] MTP2022 KPIs — Operating Profit ~2x Target, ROE 14.4%](https://japan-equity.com/wp-content/uploads/2026/07/p25_sq-1024x1024.jpg)
![[Obayashi] Cash Allocation — ¥420bn Investment CF Over Five Years](https://japan-equity.com/wp-content/uploads/2026/07/p26_sq-1024x1024.jpg)
![[Obayashi] Green Energy — 44 Plants, 344MW, and the Green Hydrogen Challenge](https://japan-equity.com/wp-content/uploads/2026/07/p21_sq-1024x1024.jpg)
![[Obayashi] Tackling the Labor Shortage — Robotics Construction®](https://japan-equity.com/wp-content/uploads/2026/07/p14_sq-1024x1024.jpg)
