
This article is based on publicly available IR materials and is not a recommendation to buy or sell any specific securities.
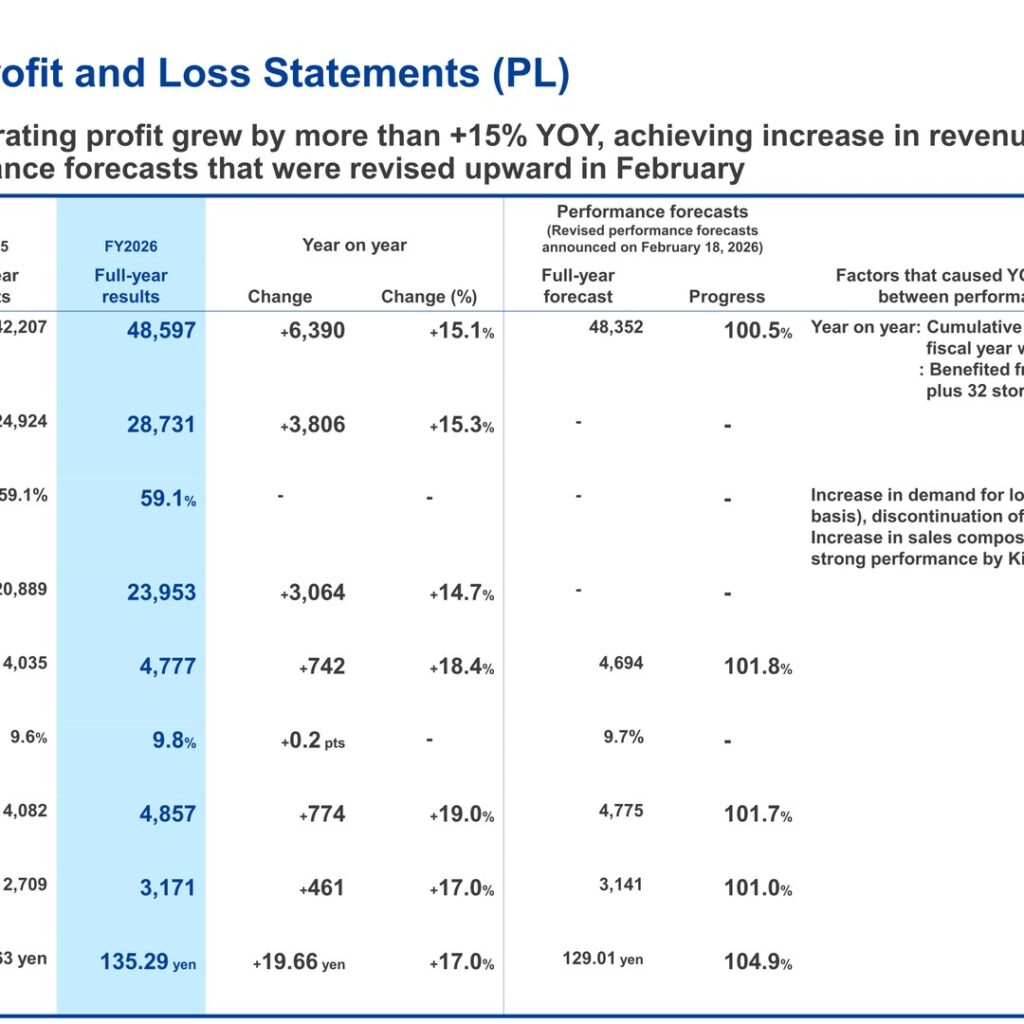
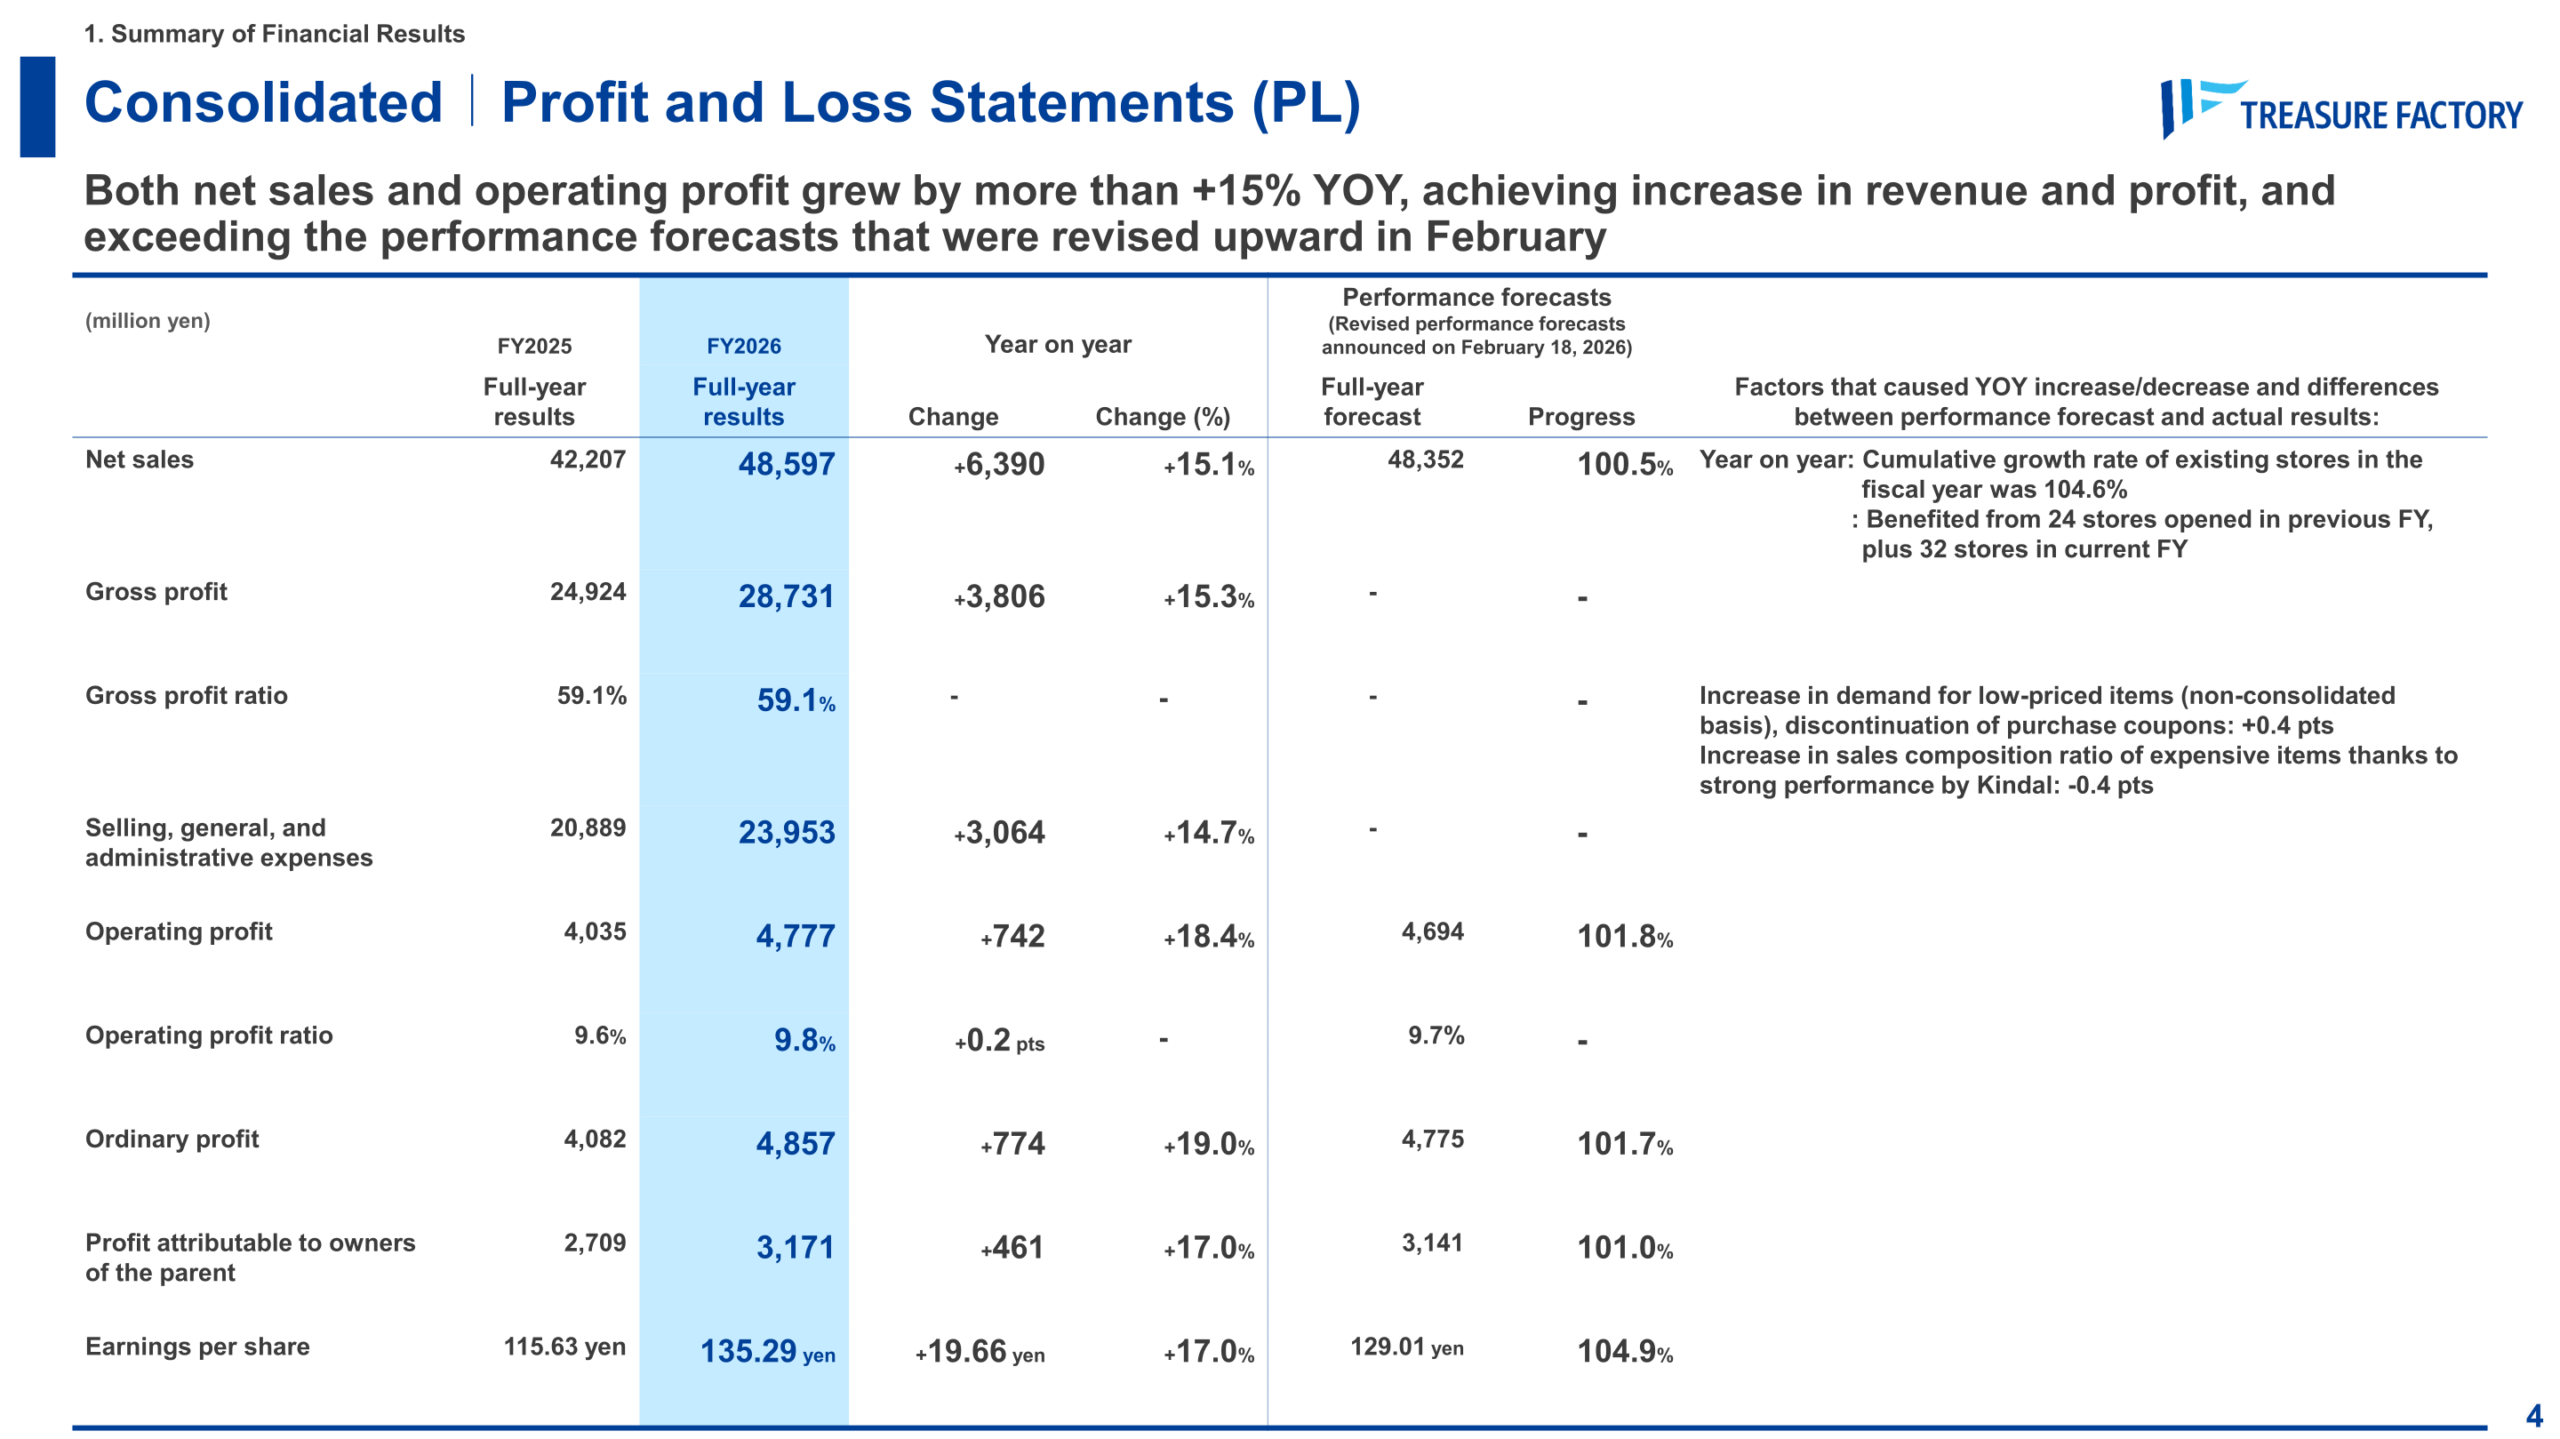
Note: Treasure Factory’s fiscal year ends in February; this article covers the fiscal year ended February 28, 2026, which the company labels “FY2026” (the prior year is “FY2025” and the forecast year “FY2027”), classified here as FY2025 per our site convention. Consolidated net sales rose 15.1% year on year to 48,597 million yen and operating profit rose 18.4% to 4,777 million yen, both reaching record-high levels and exceeding the upwardly revised full-year forecast announced on February 18, 2026. Profit attributable to owners of the parent grew 17.0% to 3,171 million yen. Growth was driven by continued strength at existing stores, the contribution of newly opened stores, and strong performance at group companies such as Kindal.
Consolidated Results (Full-Year Actual)
Net sales grew 15.1% to a record 48,597 million yen, with existing-store cumulative sales growth of 104.6% year on year and the benefit of 24 stores opened in the previous fiscal year plus 32 stores opened in the current fiscal year. The gross profit ratio was unchanged at 59.1%, while operating profit rose 18.4% to 4,777 million yen and the operating profit ratio improved 0.2 pts to 9.8%. All profit lines exceeded the performance forecasts that had been revised upward in February. Earnings per share were 135.29 yen.
| Item (million yen) | FY2025 | FY2026 | Change | Change (%) |
|---|---|---|---|---|
| Net sales | 42,207 | 48,597 | +6,390 | +15.1% |
| Gross profit | 24,924 | 28,731 | +3,806 | +15.3% |
| Gross profit ratio | 59.1% | 59.1% | – | – |
| Selling, general and administrative expenses | 20,889 | 23,953 | +3,064 | +14.7% |
| Operating profit | 4,035 | 4,777 | +742 | +18.4% |
| Operating profit ratio | 9.6% | 9.8% | +0.2 pts | – |
| Ordinary profit | 4,082 | 4,857 | +774 | +19.0% |
| Profit attributable to owners of the parent | 2,709 | 3,171 | +461 | +17.0% |
| Earnings per share | 115.63 yen | 135.29 yen | +19.66 yen | +17.0% |
Key KPIs
Non-consolidated existing-store sales exceeded prior-year levels for 54 consecutive months from September 2021 through February 2026, with full-year existing-store sales at 104.6% year on year. The gross profit ratio of non-consolidated existing stores was 64.3% (+0.4 pts year on year). The company opened 32 stores during the year against its target of 30-35 stores per year. The e-commerce ratio was 15.7% (up from 14.5% in the prior year), consolidated purchases were 115.5% year on year, and the duty-free sales ratio was 10.7% (+0.8 pts year on year).
Segment / Group Company Results
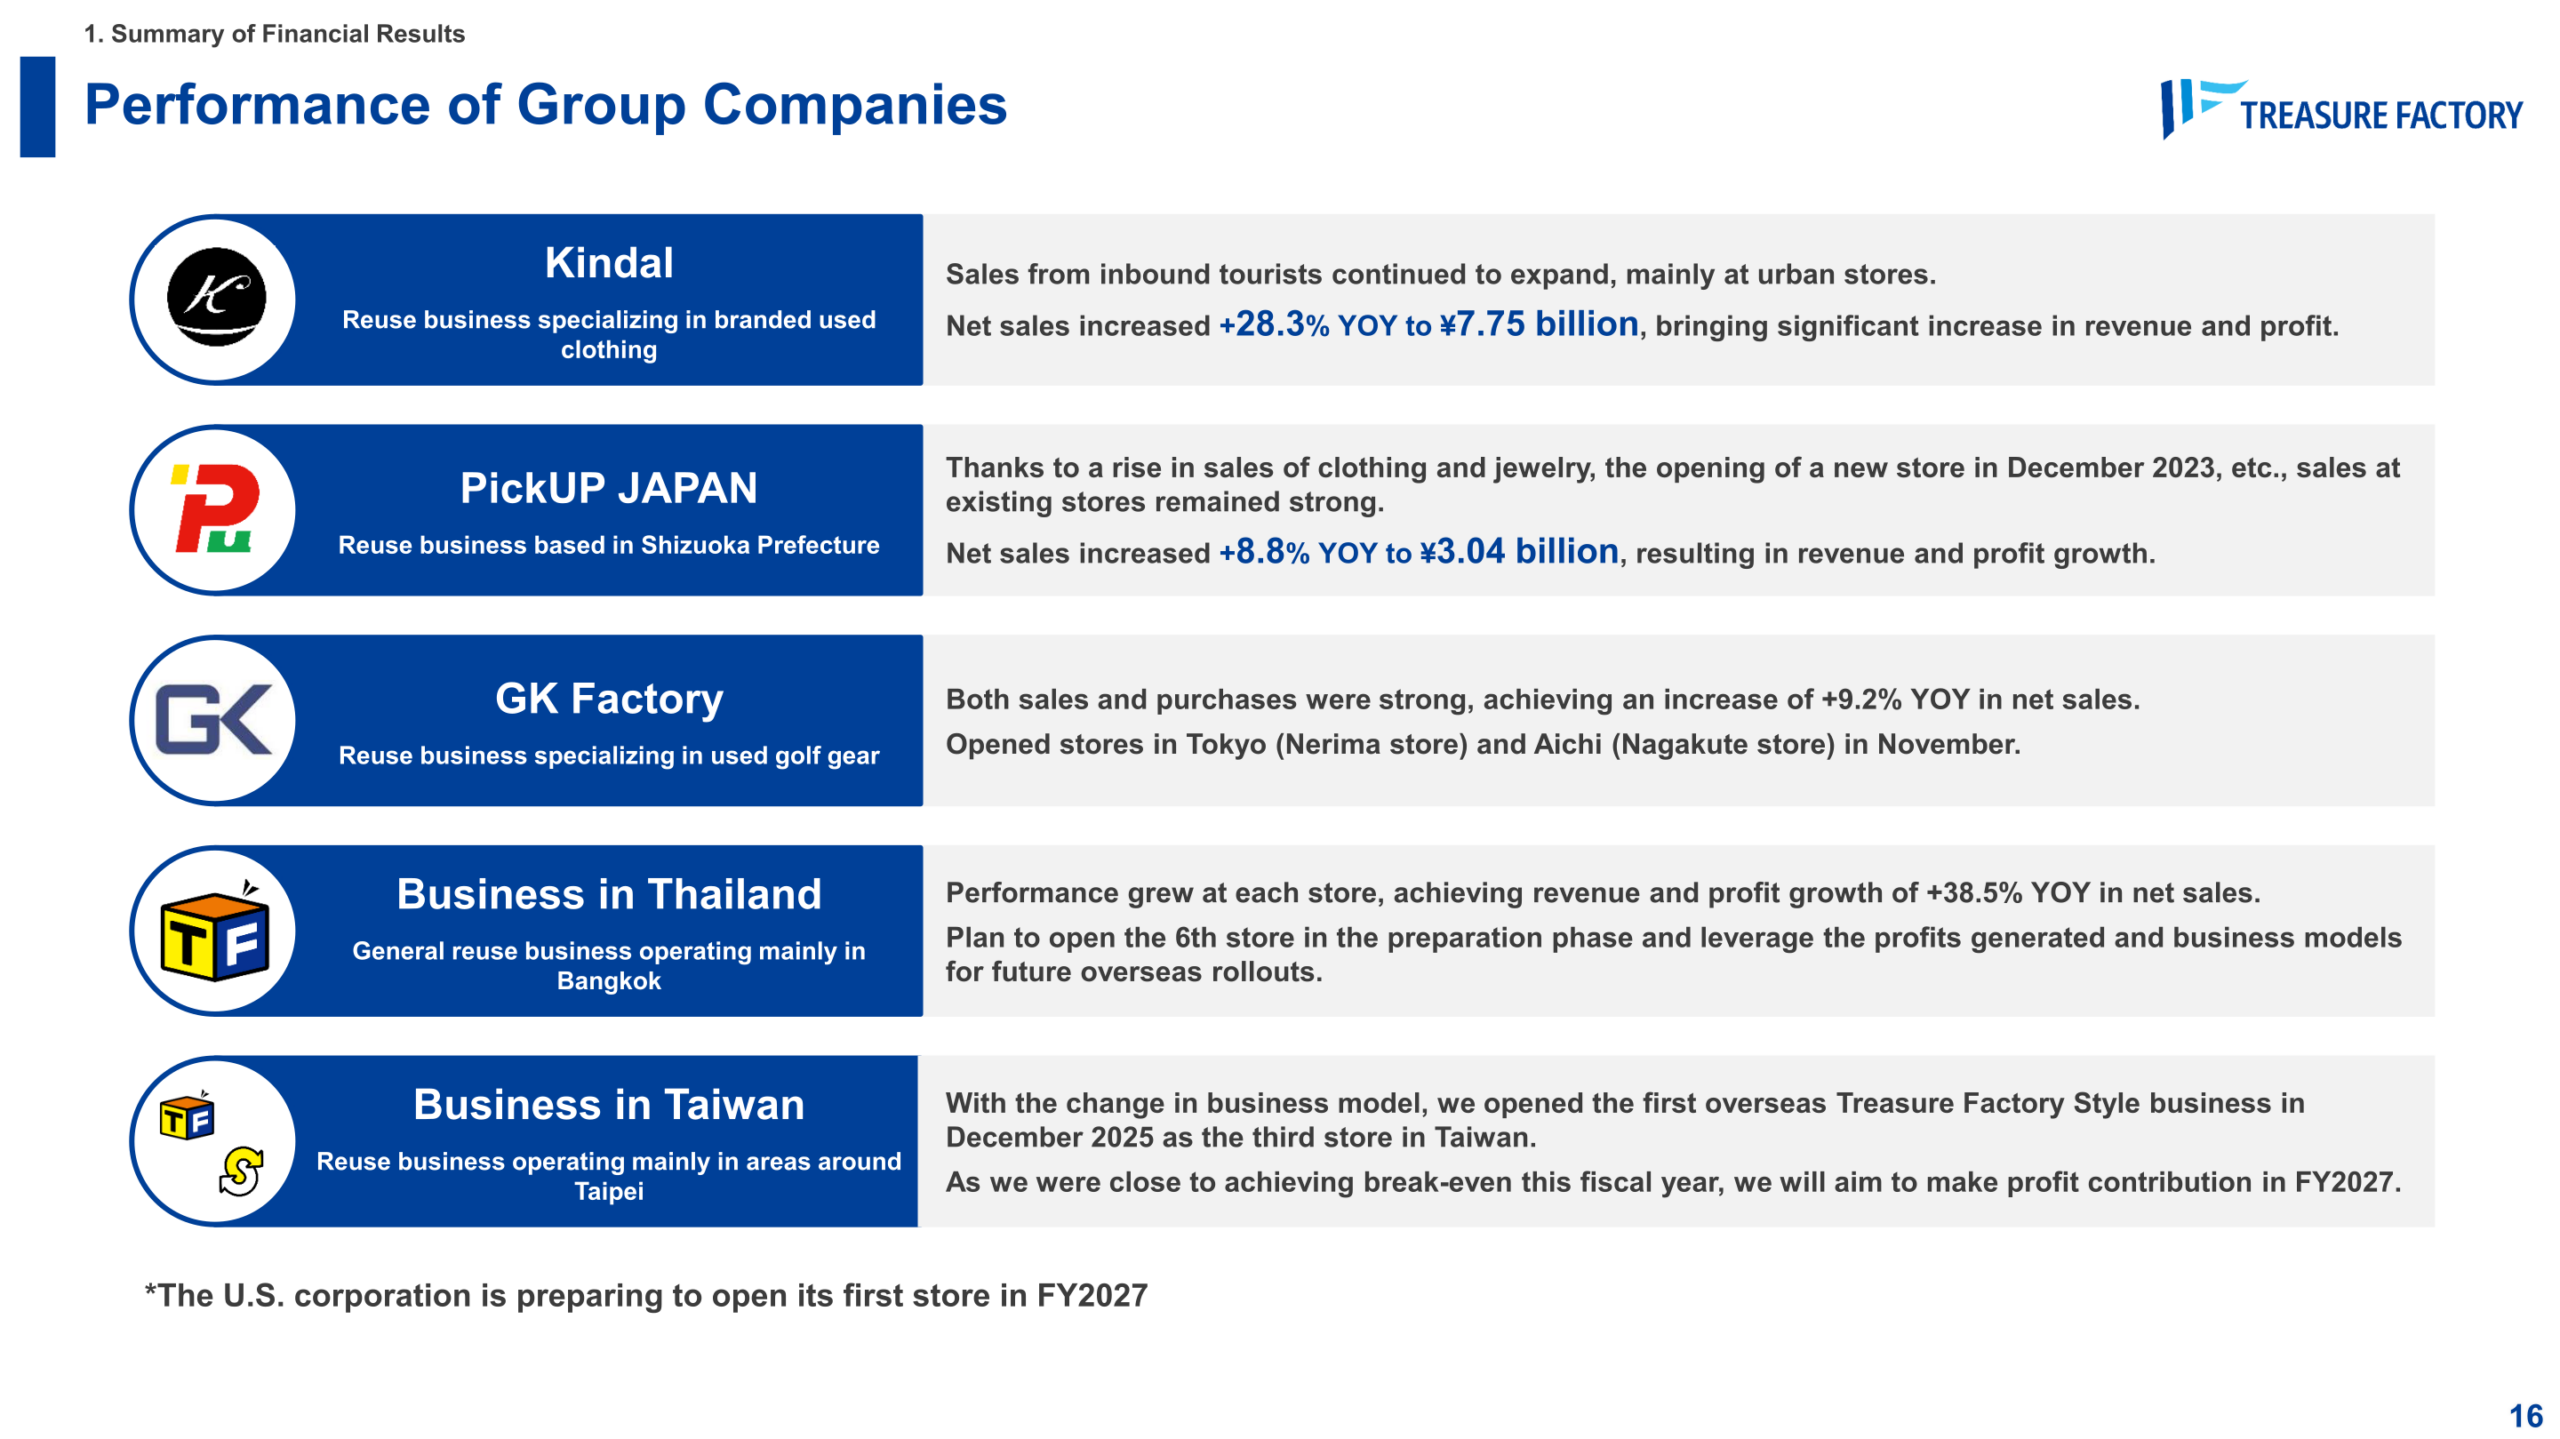
Growth was broad-based across the group. Among group companies, Kindal (branded used clothing) performed particularly well, with net sales up 28.3% year on year to 7.75 billion yen; GK Factory (used golf gear) grew 8.8% to 3.04 billion yen; PickUP JAPAN (general reuse in Shizuoka Prefecture) grew 9.2%; and the Thailand business grew 38.5%. The Taiwan business opened the first overseas Treasure Factory Style store in December 2025 (its third store in Taiwan) and, having approached break-even this fiscal year, aims to contribute to profit in FY2027. Of the 6,390 million yen total increase in net sales, subsidiaries contributed +2,353 million yen, non-consolidated existing stores +2,420 million yen, and non-consolidated new stores +2,137 million yen, partly offset by -594 million yen from closed stores.
| Group Company | Business | FY2026 Net Sales | YoY Change |
|---|---|---|---|
| Kindal | Branded used clothing reuse | 7.75 billion yen | +28.3% |
| GK Factory | Used golf gear reuse | 3.04 billion yen | +8.8% |
| PickUP JAPAN | General reuse (Shizuoka) | – | +9.2% |
| Thailand business | General reuse (Bangkok) | – | +38.5% |
FY2027 Forecast
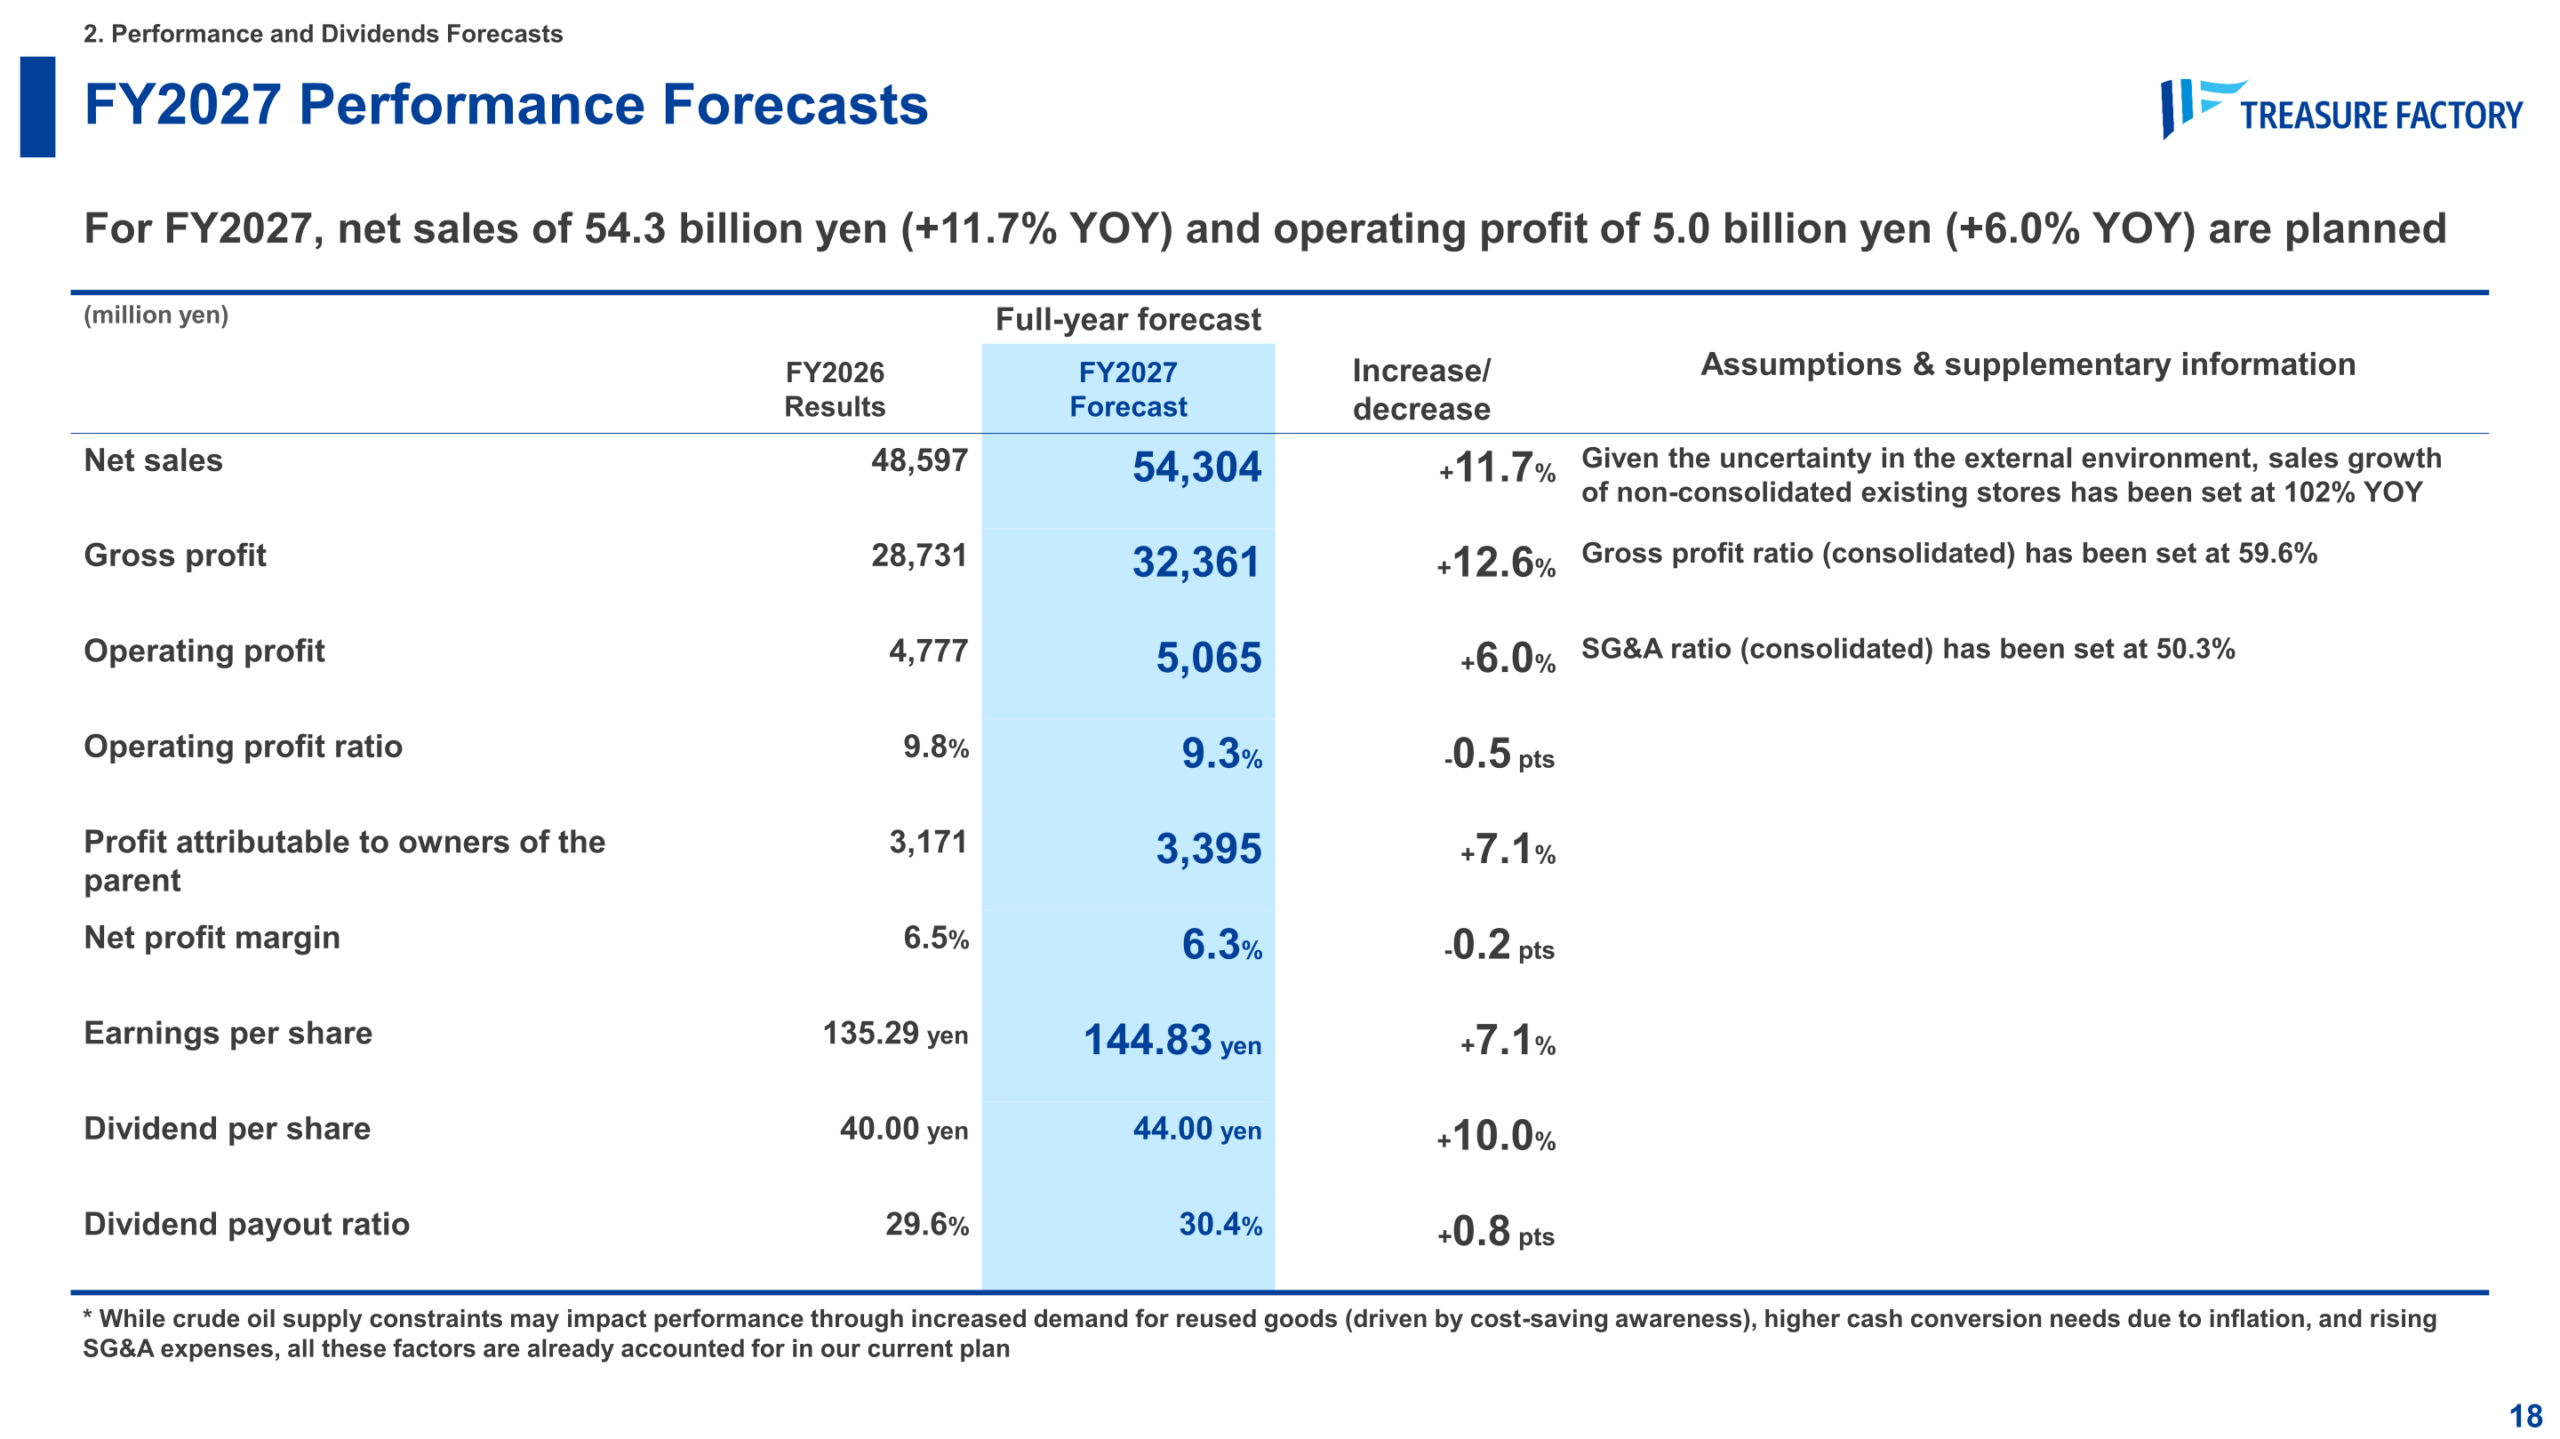
For FY2027 (fiscal year ending February 2027), the company plans net sales of 54,304 million yen (+11.7% year on year) and operating profit of 5,065 million yen (+6.0%). Sales growth of non-consolidated existing stores is assumed at 102% year on year given uncertainty in the external environment, with the consolidated gross profit ratio set at 59.6% and the consolidated SG&A ratio at 50.3%. Profit attributable to owners of the parent is forecast at 3,395 million yen (+7.1%).
| Item (million yen) | FY2026 Results | FY2027 Forecast | Change |
|---|---|---|---|
| Net sales | 48,597 | 54,304 | +11.7% |
| Gross profit | 28,731 | 32,361 | +12.6% |
| Operating profit | 4,777 | 5,065 | +6.0% |
| Operating profit ratio | 9.8% | 9.3% | -0.5 pts |
| Profit attributable to owners of the parent | 3,171 | 3,395 | +7.1% |
| Net profit margin | 6.5% | 6.3% | -0.2 pts |
| Earnings per share | 135.29 yen | 144.83 yen | +7.1% |
| Dividend per share | 40.00 yen | 44.00 yen | +10.0% |
| Dividend payout ratio | 29.6% | 30.4% | +0.8 pts |
Shareholder Returns
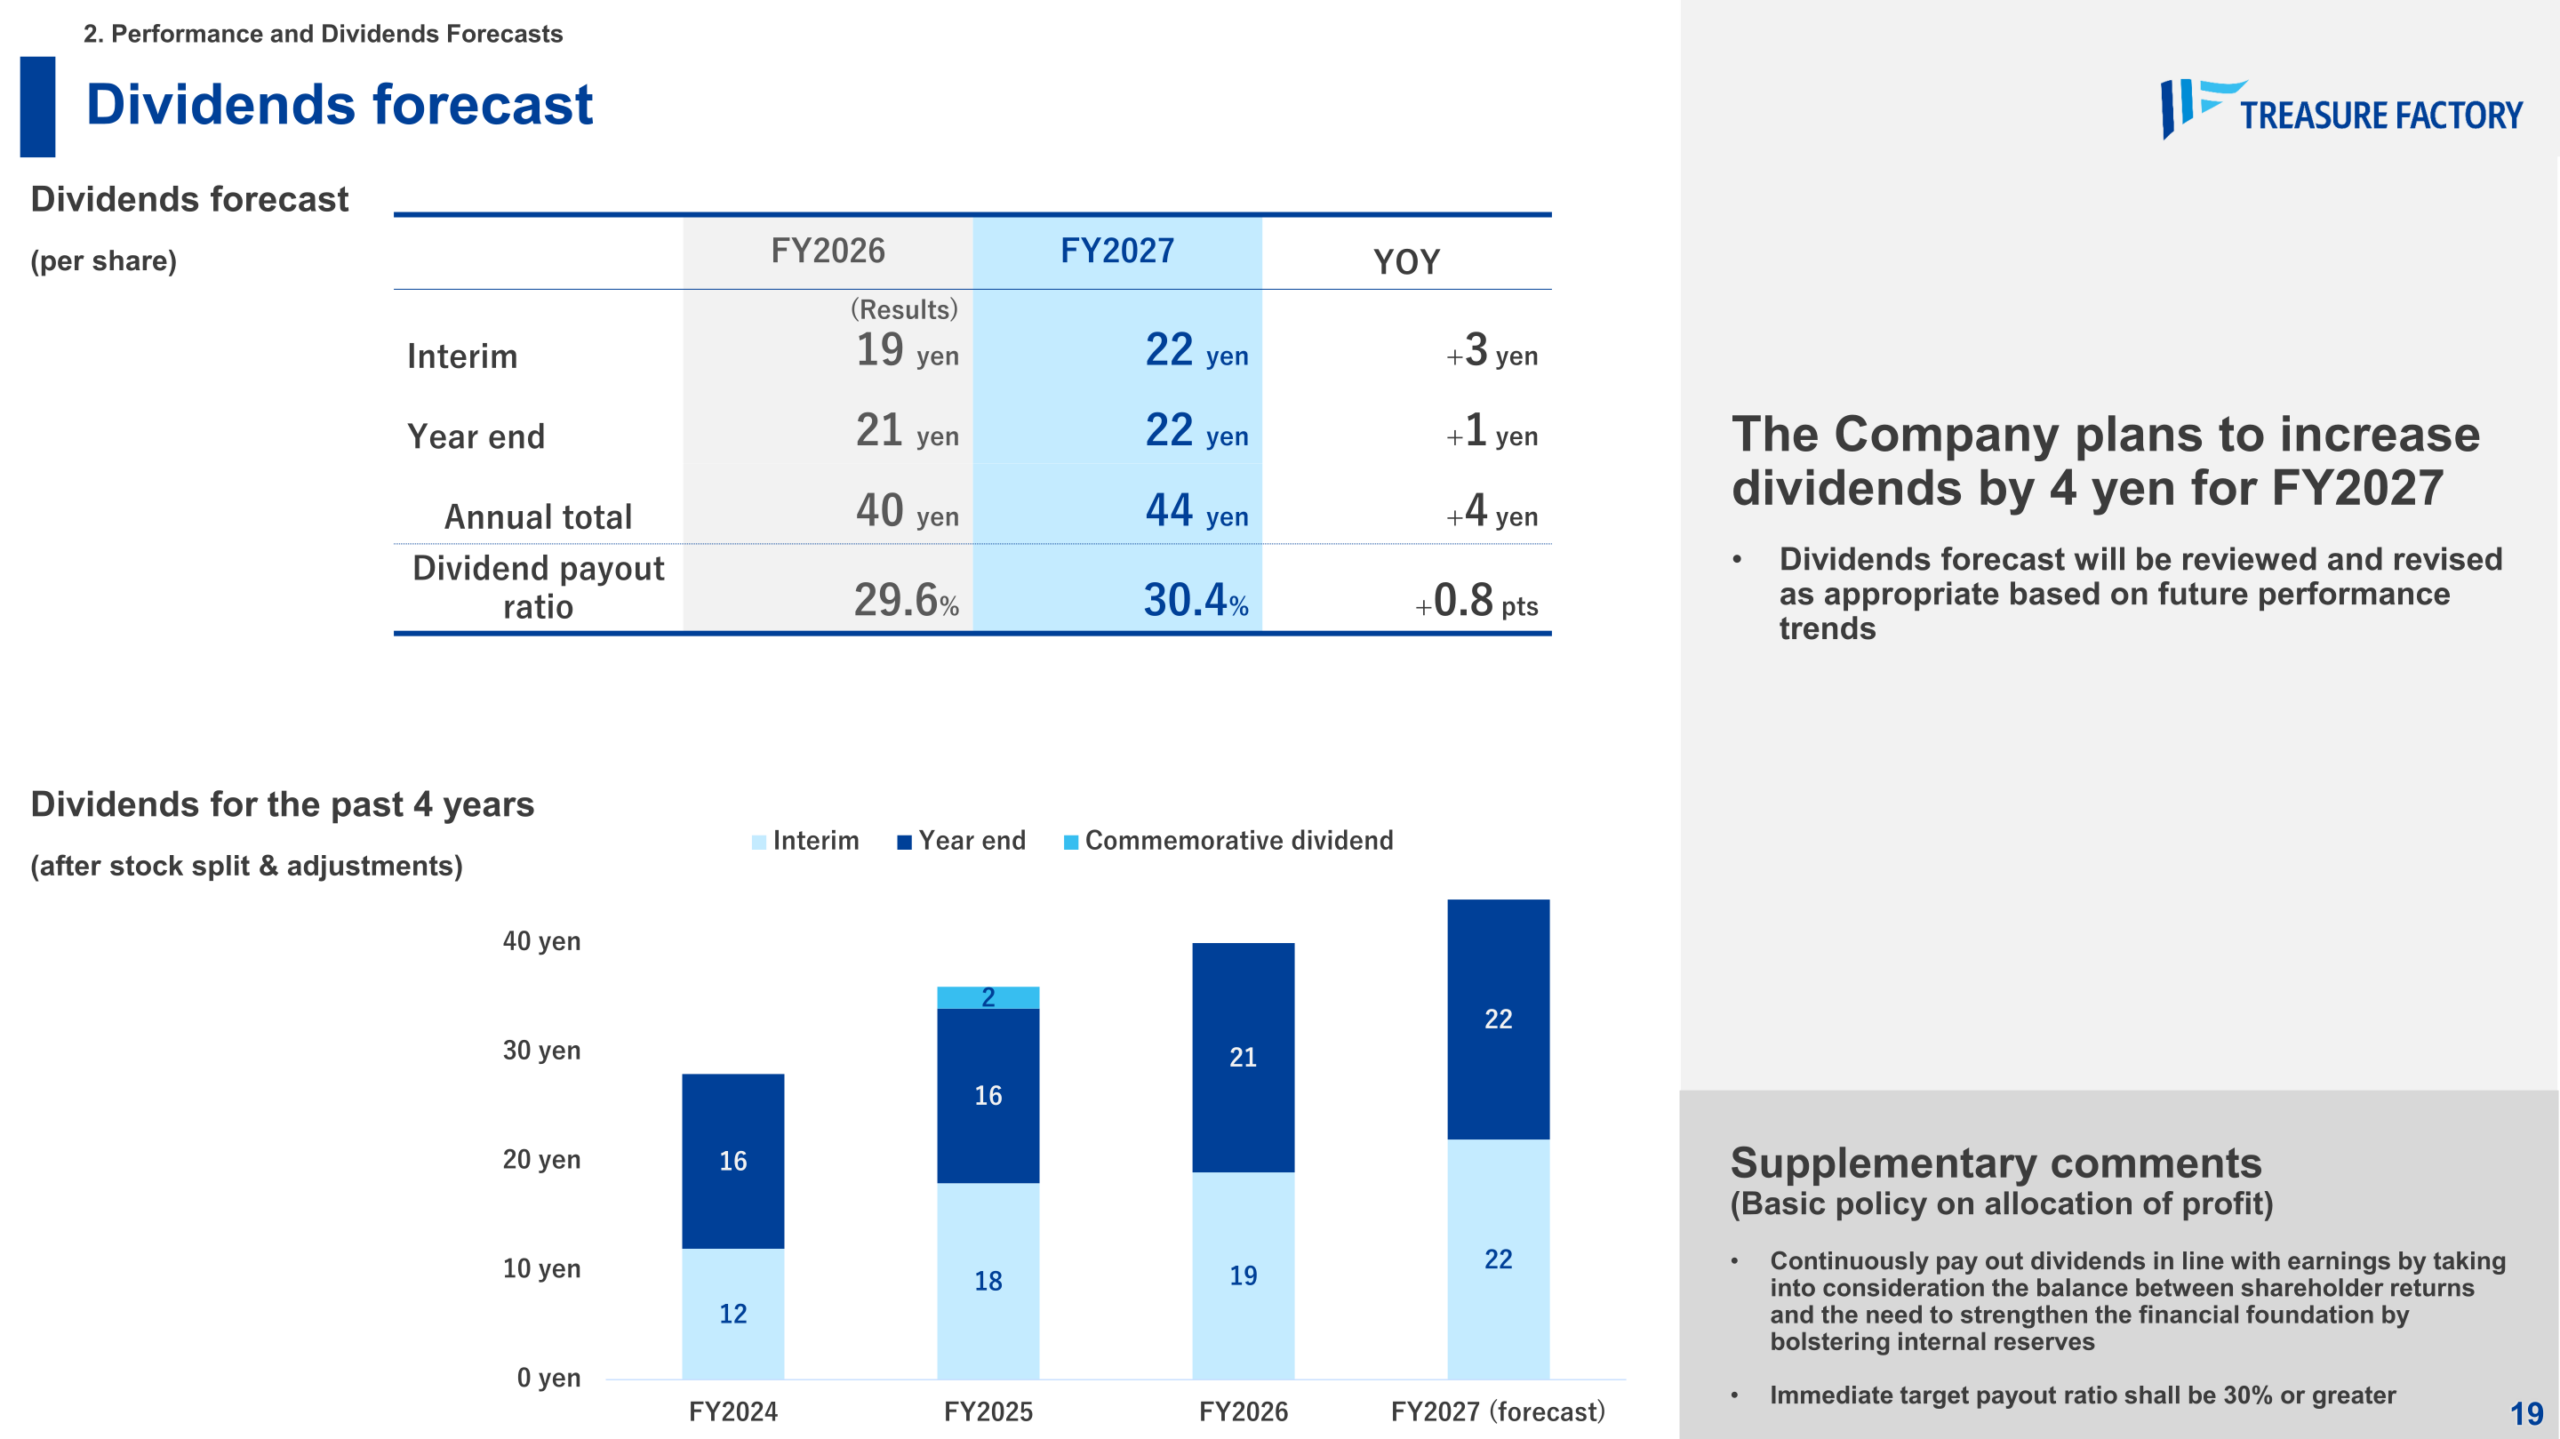
The FY2026 annual dividend was 40 yen per share (interim 19 yen, year-end 21 yen), for a payout ratio of 29.6%. For FY2027 the company plans an annual dividend of 44 yen per share (interim 22 yen, year-end 22 yen), an increase of 4 yen, for a payout ratio of 30.4%. The basic policy is to continuously pay dividends in line with earnings while strengthening the financial foundation, with an immediate target payout ratio of 30% or greater. Purchases of treasury shares are planned to be conducted in a timely manner based on stock price trends and funds on hand.
| Dividend per share | FY2026 (Results) | FY2027 (Forecast) | Change |
|---|---|---|---|
| Interim | 19 yen | 22 yen | +3 yen |
| Year-end | 21 yen | 22 yen | +1 yen |
| Annual total | 40 yen | 44 yen | +4 yen |
| Dividend payout ratio | 29.6% | 30.4% | +0.8 pts |
Medium-Term Management Plan
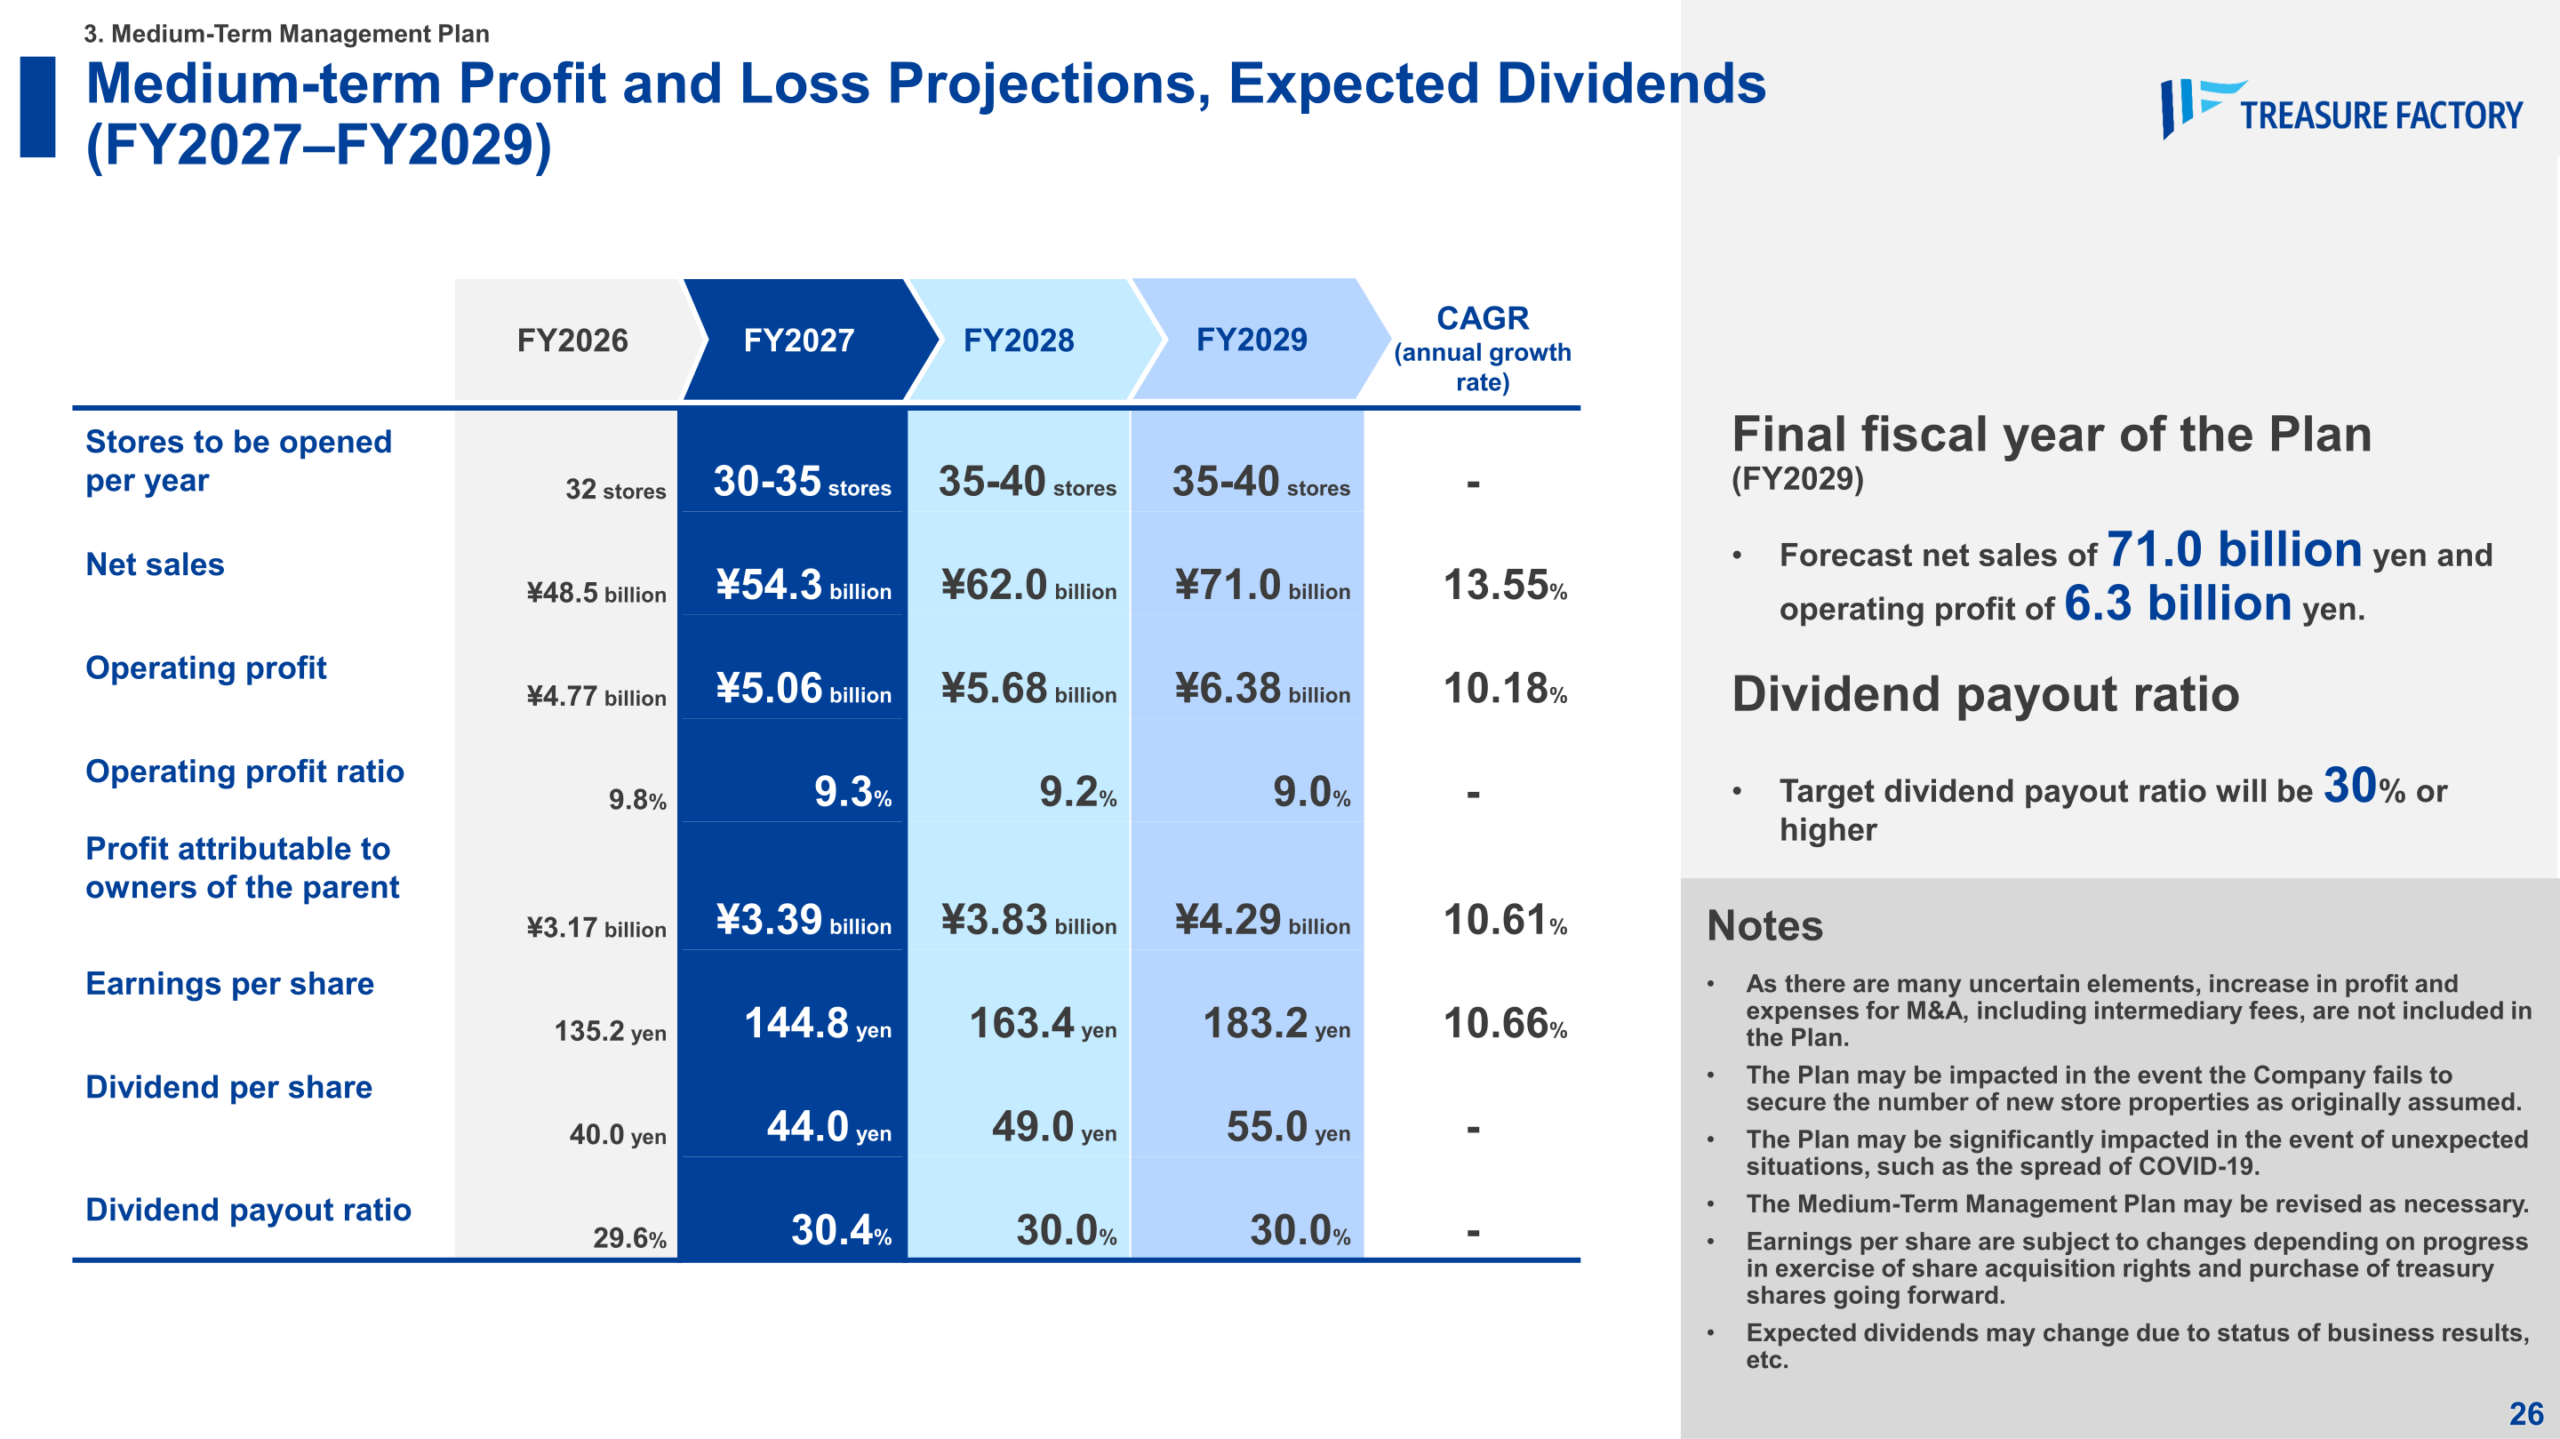
Under its rolling medium-term management plan (updated each April), the company targets net sales of 71.0 billion yen and operating profit of 6.3 billion yen in the final fiscal year, FY2029. The plan is built on developing the reuse business by opening 30 to 40 new stores per year on a consolidated basis, growth in overseas markets (beyond Thailand, Taiwan and the U.S.), growth through M&A, and investment in digital transformation and AI. The company targets a dividend payout ratio of 30% or higher throughout the plan. In FY2026, ROE was 27.4% (net profit margin 6.5% x total assets turnover 2.10 x financial leverage 2.00) and ROIC was 18.3%, both well above the company’s estimated cost of equity of approximately 4.6% and WACC of approximately 4.1%.
| Item | FY2026 | FY2027 | FY2028 | FY2029 | CAGR |
|---|---|---|---|---|---|
| Stores opened per year | 32 stores | 30-35 stores | 35-40 stores | 35-40 stores | – |
| Net sales | 48.5 billion yen | 54.3 billion yen | 62.0 billion yen | 71.0 billion yen | 13.55% |
| Operating profit | 4.77 billion yen | 5.06 billion yen | 5.68 billion yen | 6.38 billion yen | 10.18% |
| Operating profit ratio | 9.8% | 9.3% | 9.2% | 9.0% | – |
| Profit attributable to owners of the parent | 3.17 billion yen | 3.39 billion yen | 3.83 billion yen | 4.29 billion yen | 10.61% |
| Earnings per share | 135.2 yen | 144.8 yen | 163.4 yen | 183.2 yen | 10.66% |
| Dividend per share | 40.0 yen | 44.0 yen | 49.0 yen | 55.0 yen | – |
| Dividend payout ratio | 29.6% | 30.4% | 30.0% | 30.0% | – |
This article is an analysis based on publicly available information and is not a recommendation to buy or sell any specific securities. Investment decisions are your own responsibility.
















